Downloaded 211 times
![Results- Experiment no 1
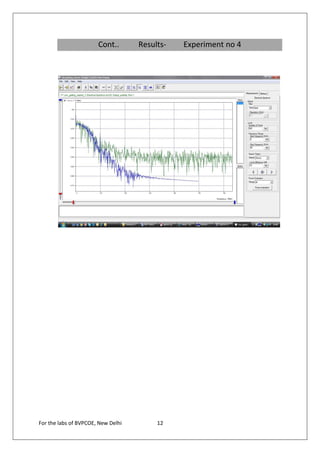
1. Optical power at opowme1 Run(s): 1
Power [dBm] = -6.053
Power [mW] = 0.248E+00
2. Optical power at opowme2 Run(s): 1
Power [dBm] = -16.032
Power [mW] = 0.249E-01
3.
4.
For the labs of BVPCOE, New Delhi 3](https://image.slidesharecdn.com/optsimmanual-130128010616-phpapp01/85/Opt-sim-manual-3-320.jpg)
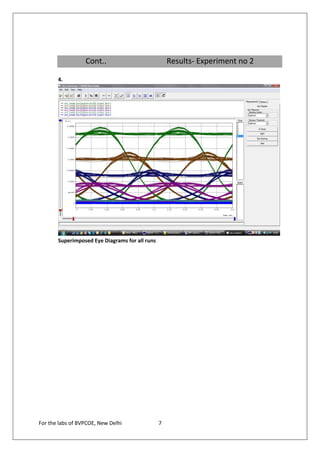
![Results- Experiment no 2
1.
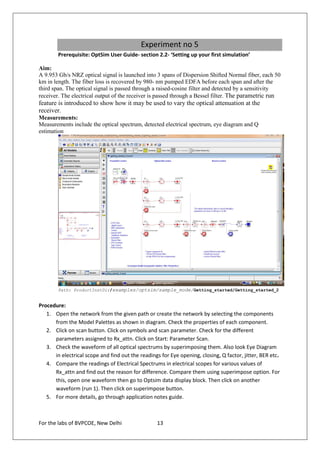
Optical power at opowme1 Run(s): 1 2 3 4 5 6
Power [dBm] = -6.032
Power [mW] = 0.249E+00
2.
Optical power at opowme2 Run(s): 1
Power [dBm] = -8.079
Power [mW] = 0.156E+00
------------------------------------------------------
Optical power at opowme2 Run(s): 2
Power [dBm] = -10.111
Power [mW] = 0.975E-01
------------------------------------------------------
Optical power at opowme2 Run(s): 3
Power [dBm] = -12.107
Power [mW] = 0.616E-01
------------------------------------------------------
Optical power at opowme2 Run(s): 4
Power [dBm] = -14.093
Power [mW] = 0.390E-01
------------------------------------------------------
Optical power at opowme2 Run(s): 5
Power [dBm] = -22.051
Power [mW] = 0.624E-02
------------------------------------------------------
Optical power at opowme2 Run(s): 6
Power [dBm] = -25.964
Power [mW] = 0.253E-02
3.
Superimposed Optical Spectrum for all runs
For the labs of BVPCOE, New Delhi 6](https://image.slidesharecdn.com/optsimmanual-130128010616-phpapp01/85/Opt-sim-manual-6-320.jpg)
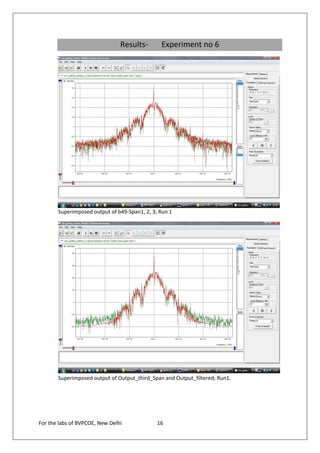
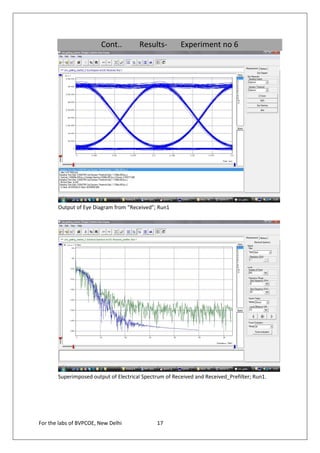

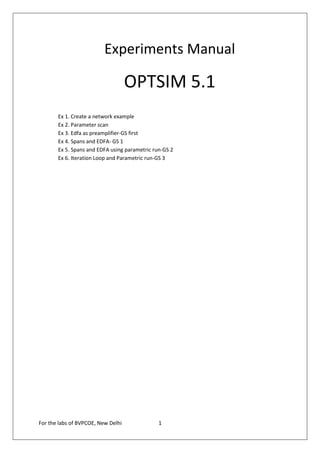
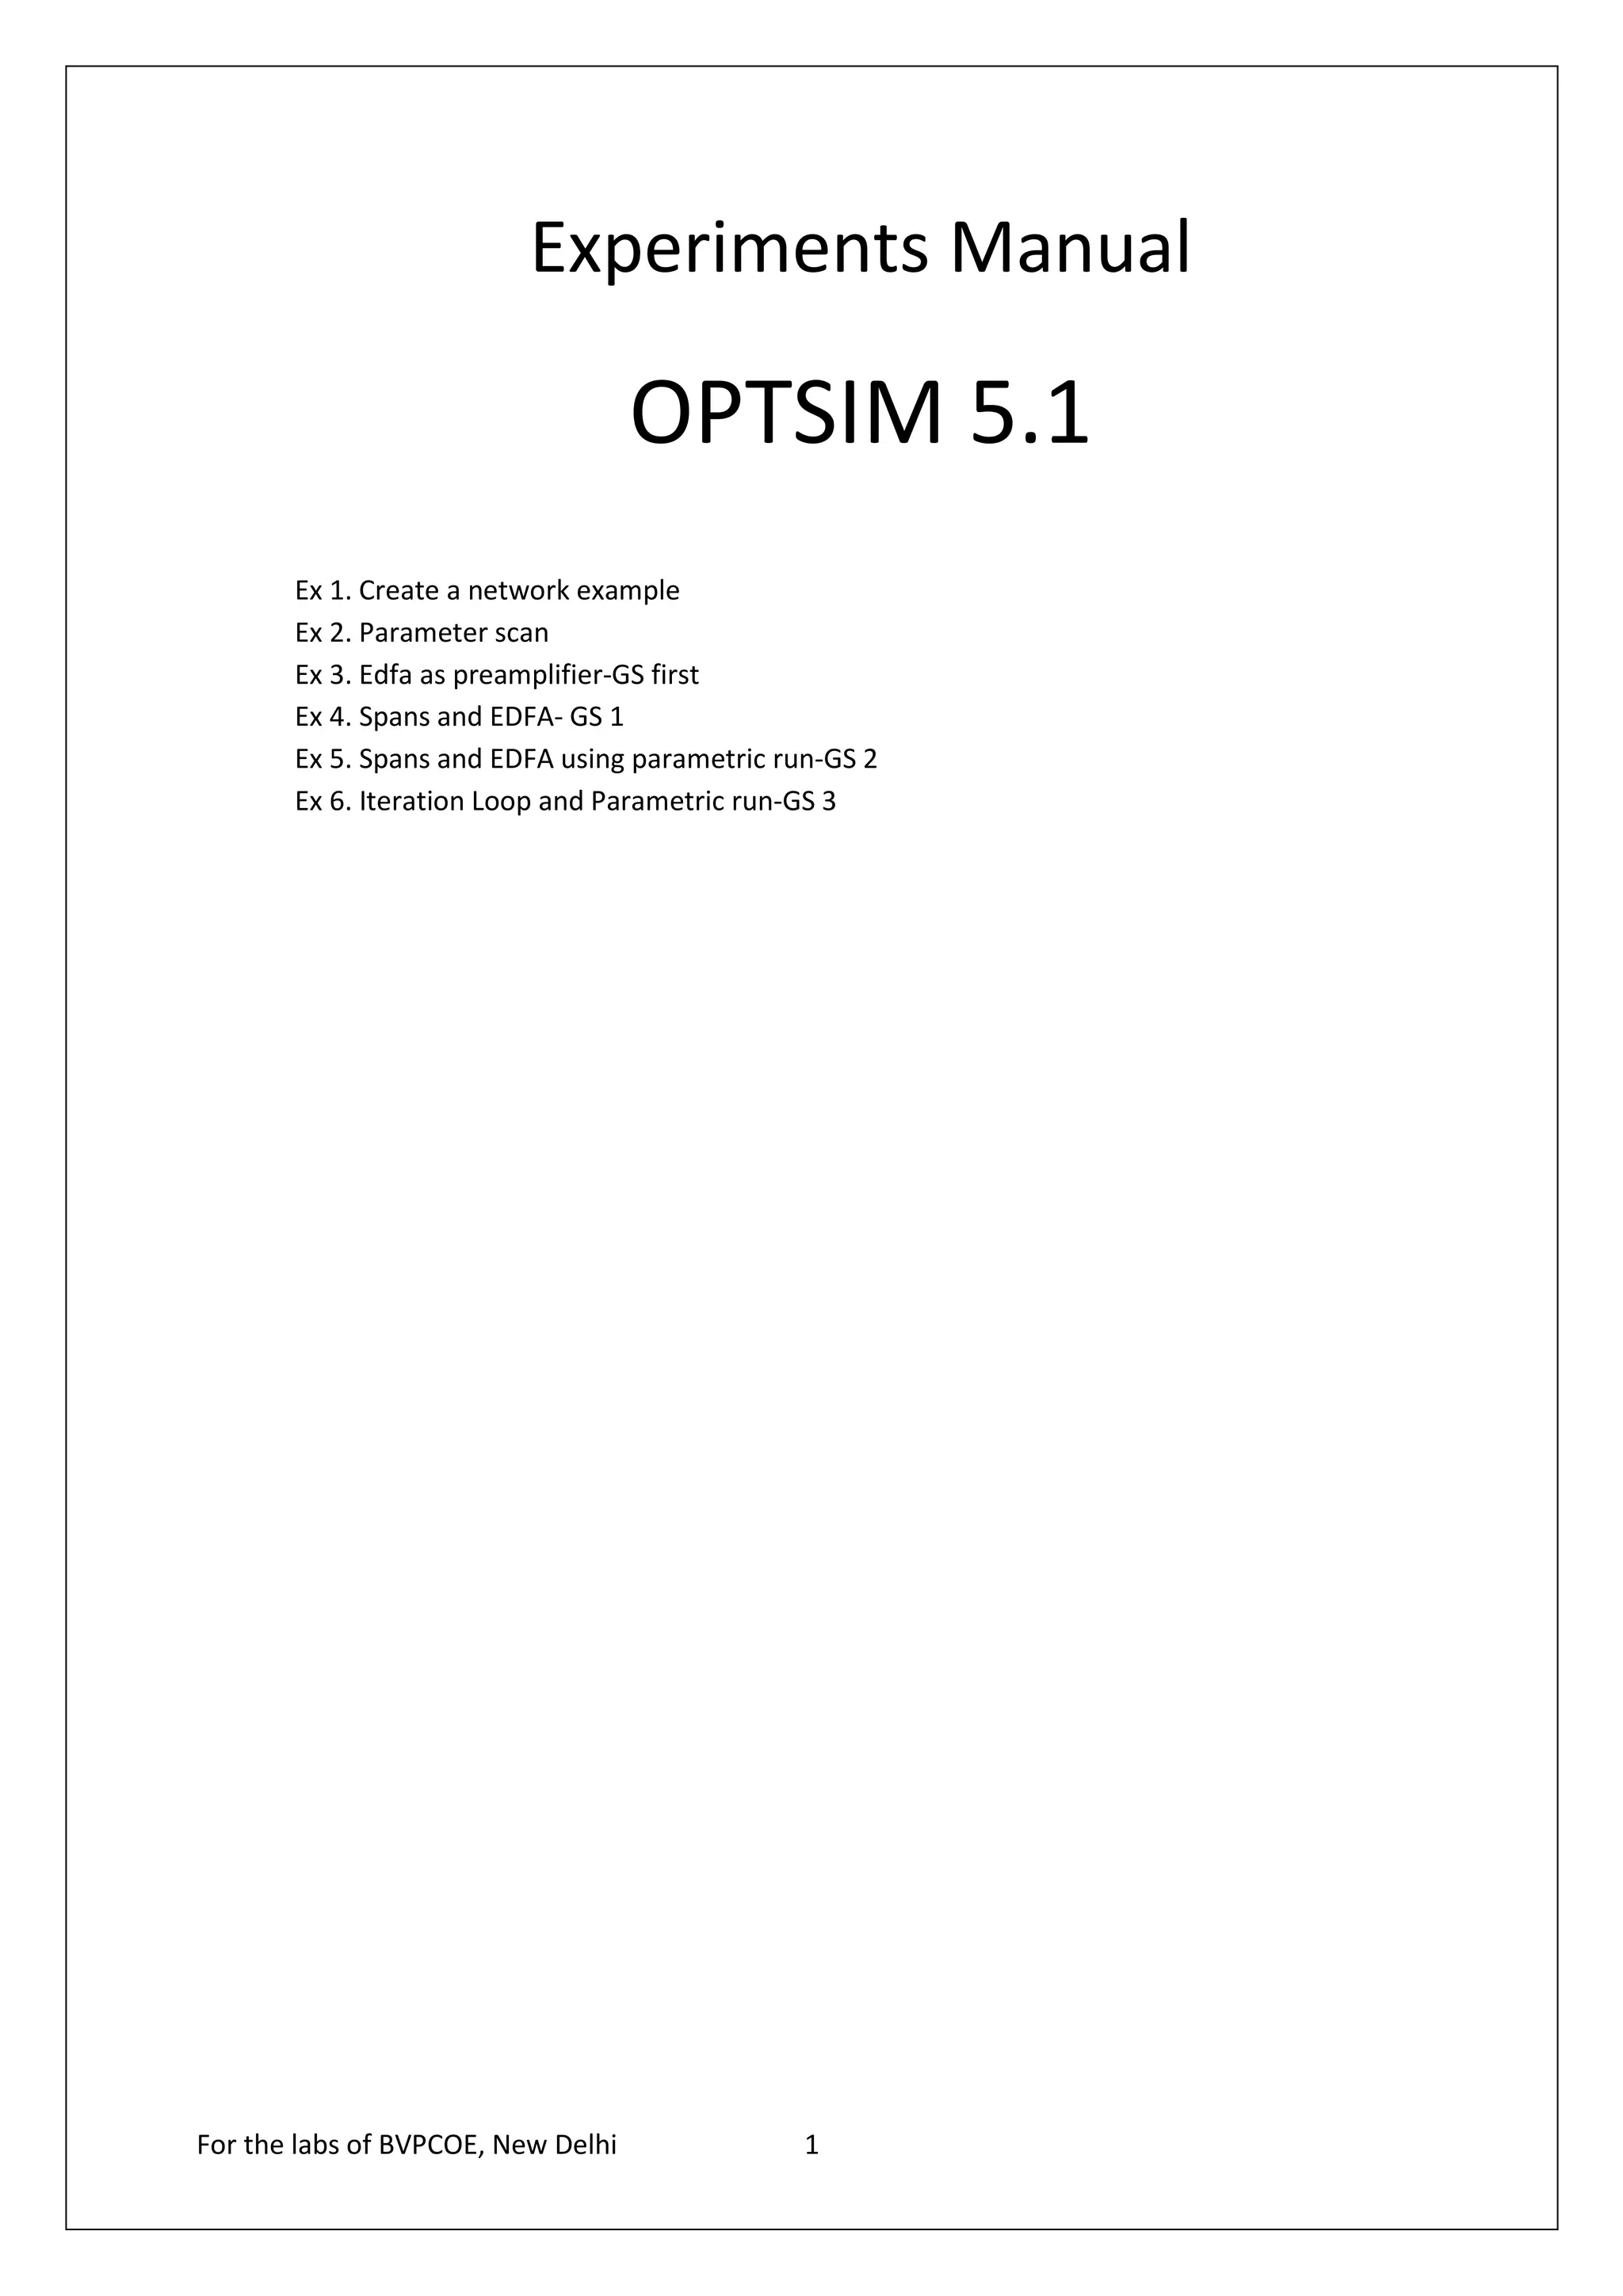
The document provides instructions for 6 experiments using OptSim software. Experiment 1 creates a basic network to transmit a 10Gb/s NRZ signal over 50km fiber and measure the output. Experiment 2 adds parameter scanning to vary the fiber length and observe its effect. Experiment 3 adds an EDFA preamplifier to the receiver section. Experiment 4 transmits a 9.953Gb/s signal over 3 fiber spans with EDFAs. Experiment 5 is similar but introduces parametric scanning of the receiver attenuation. Experiment 6 uses iteration loops with parametric runs.