Download as PDF, PPTX


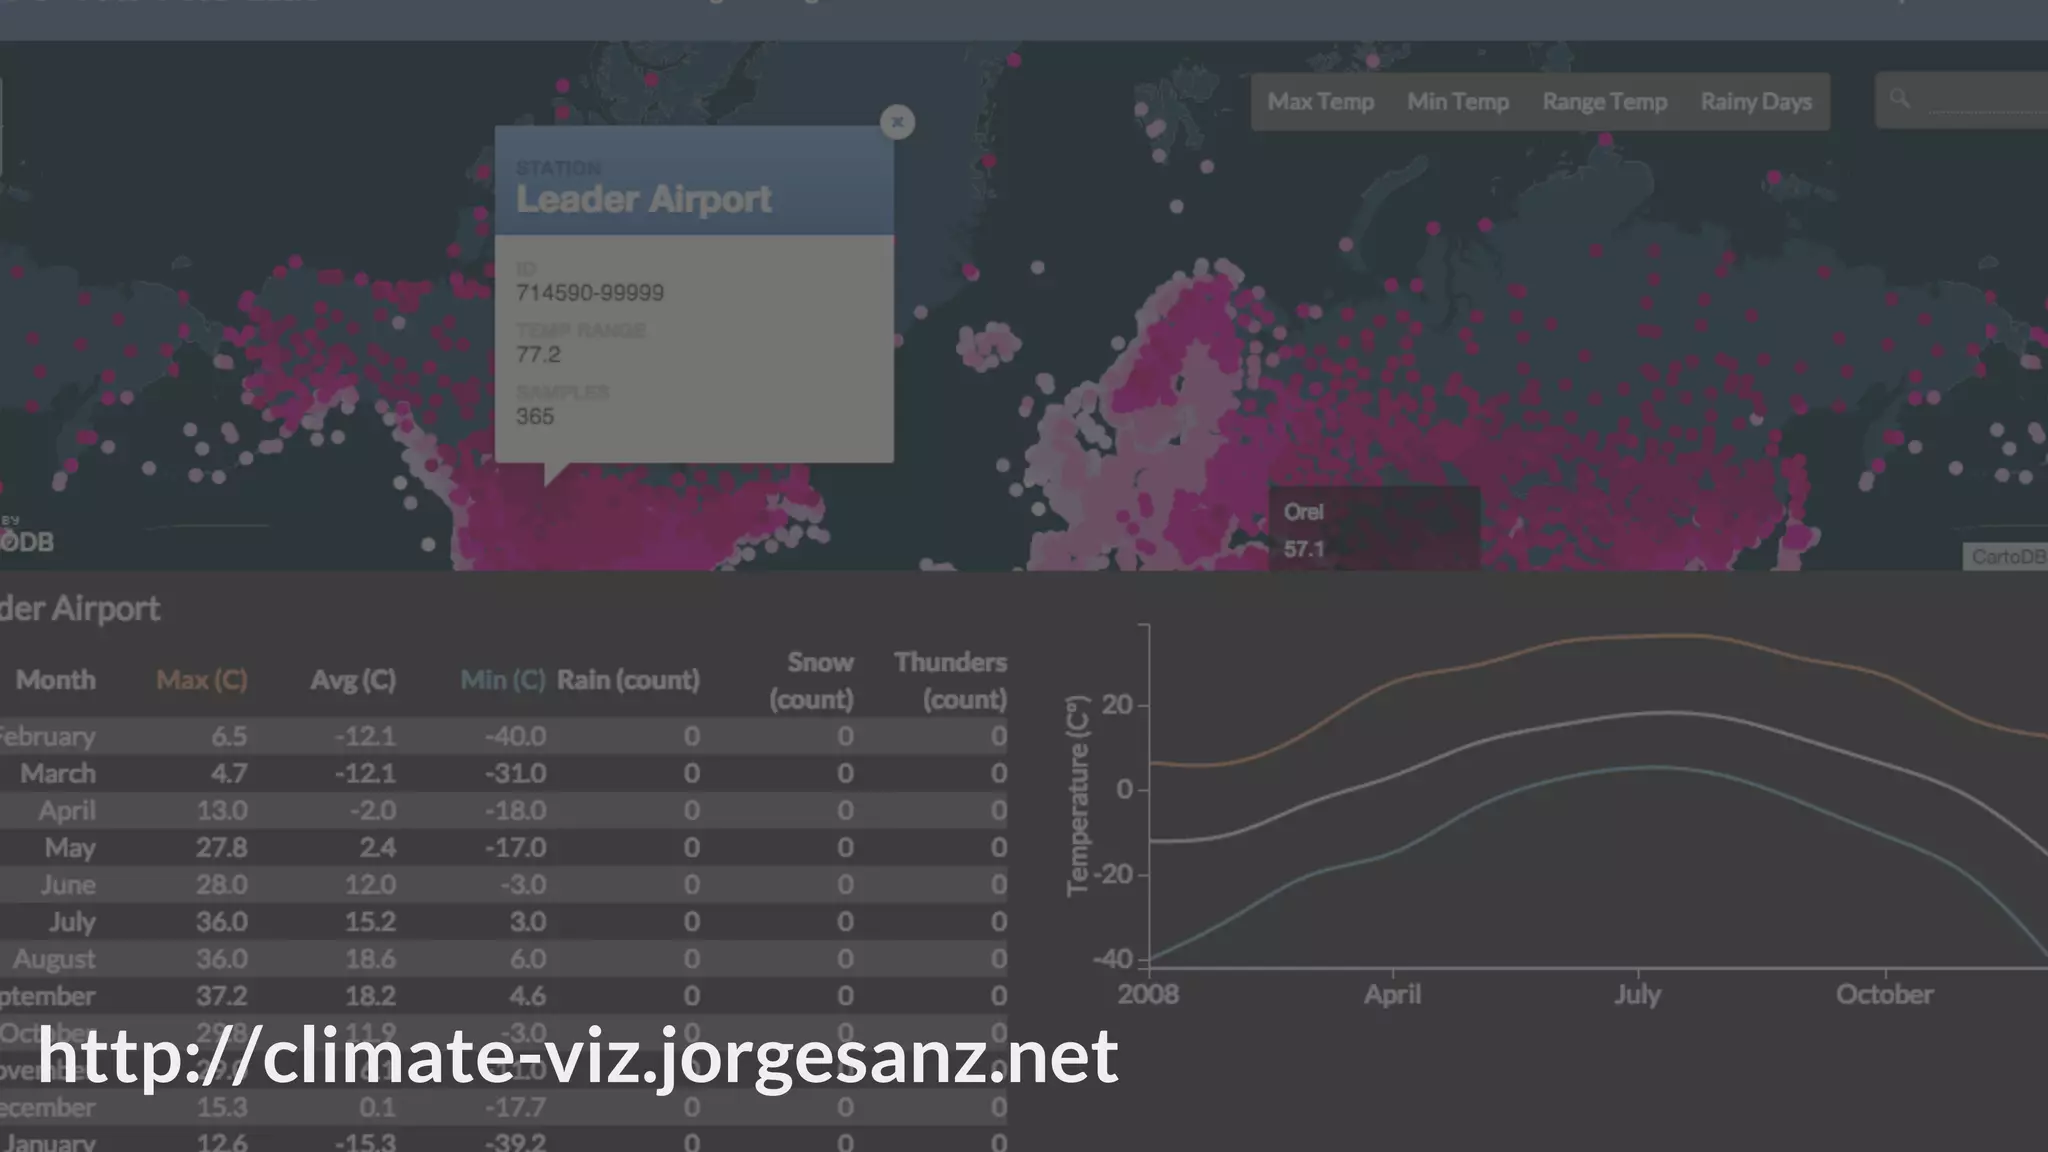
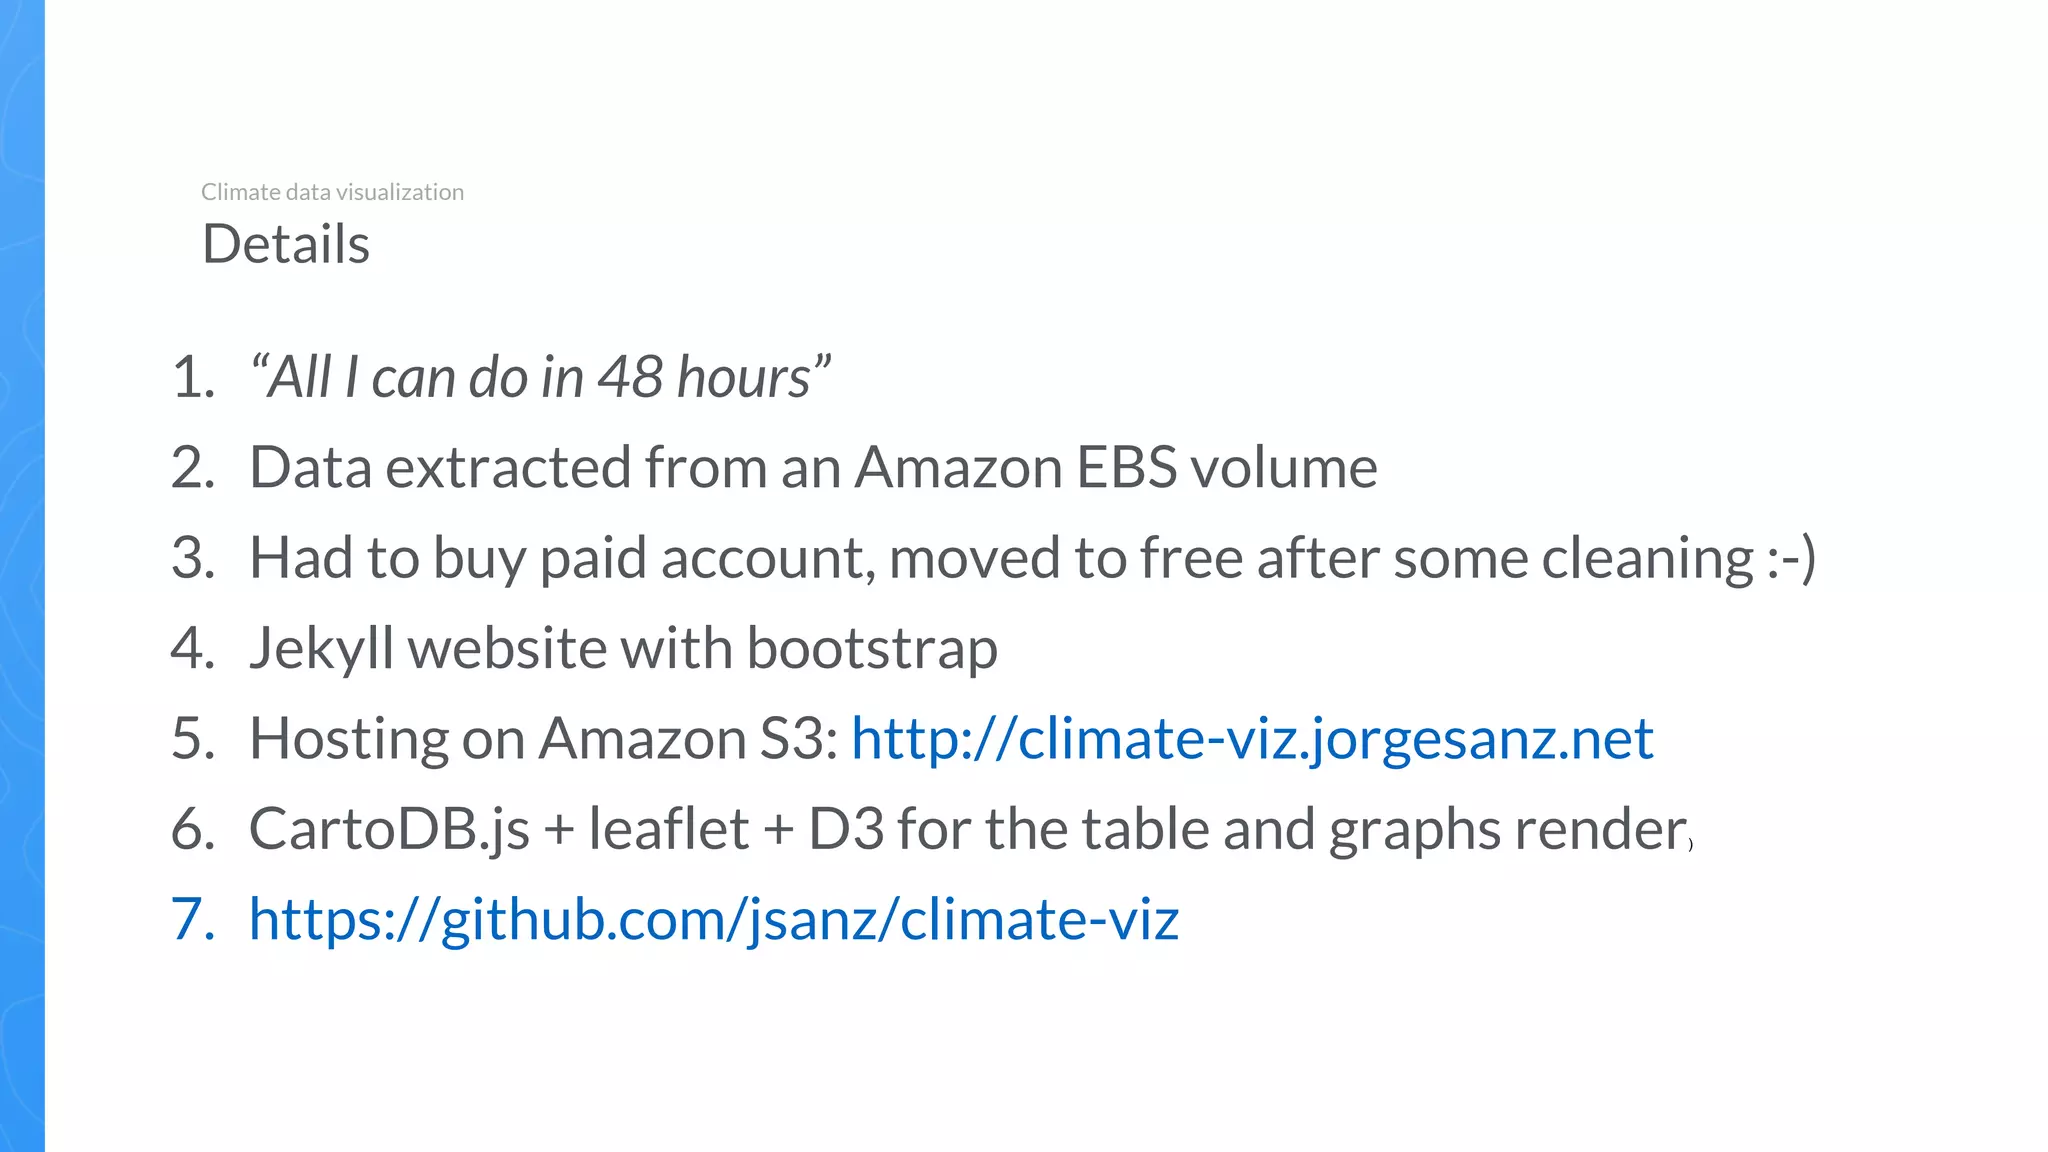
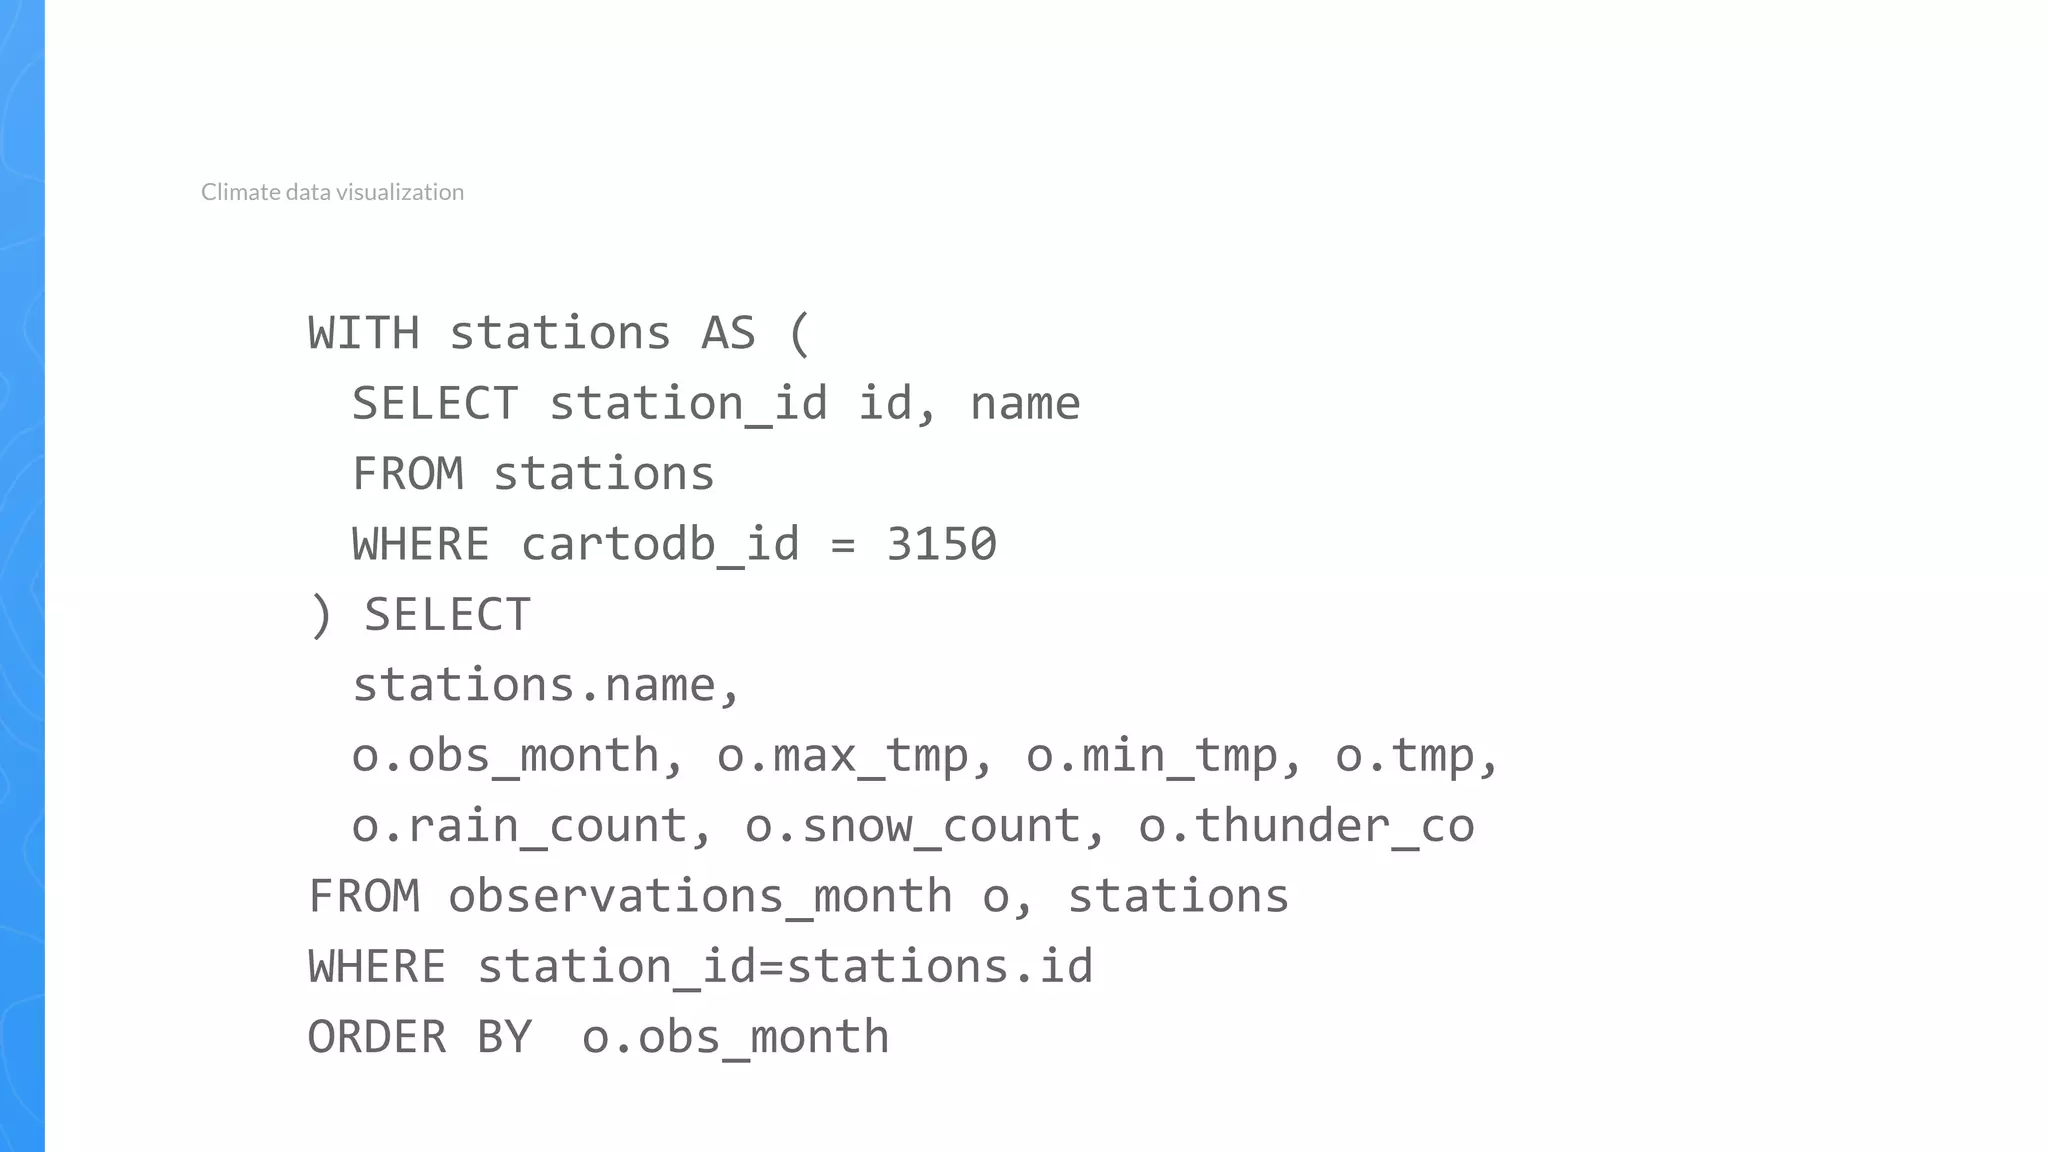
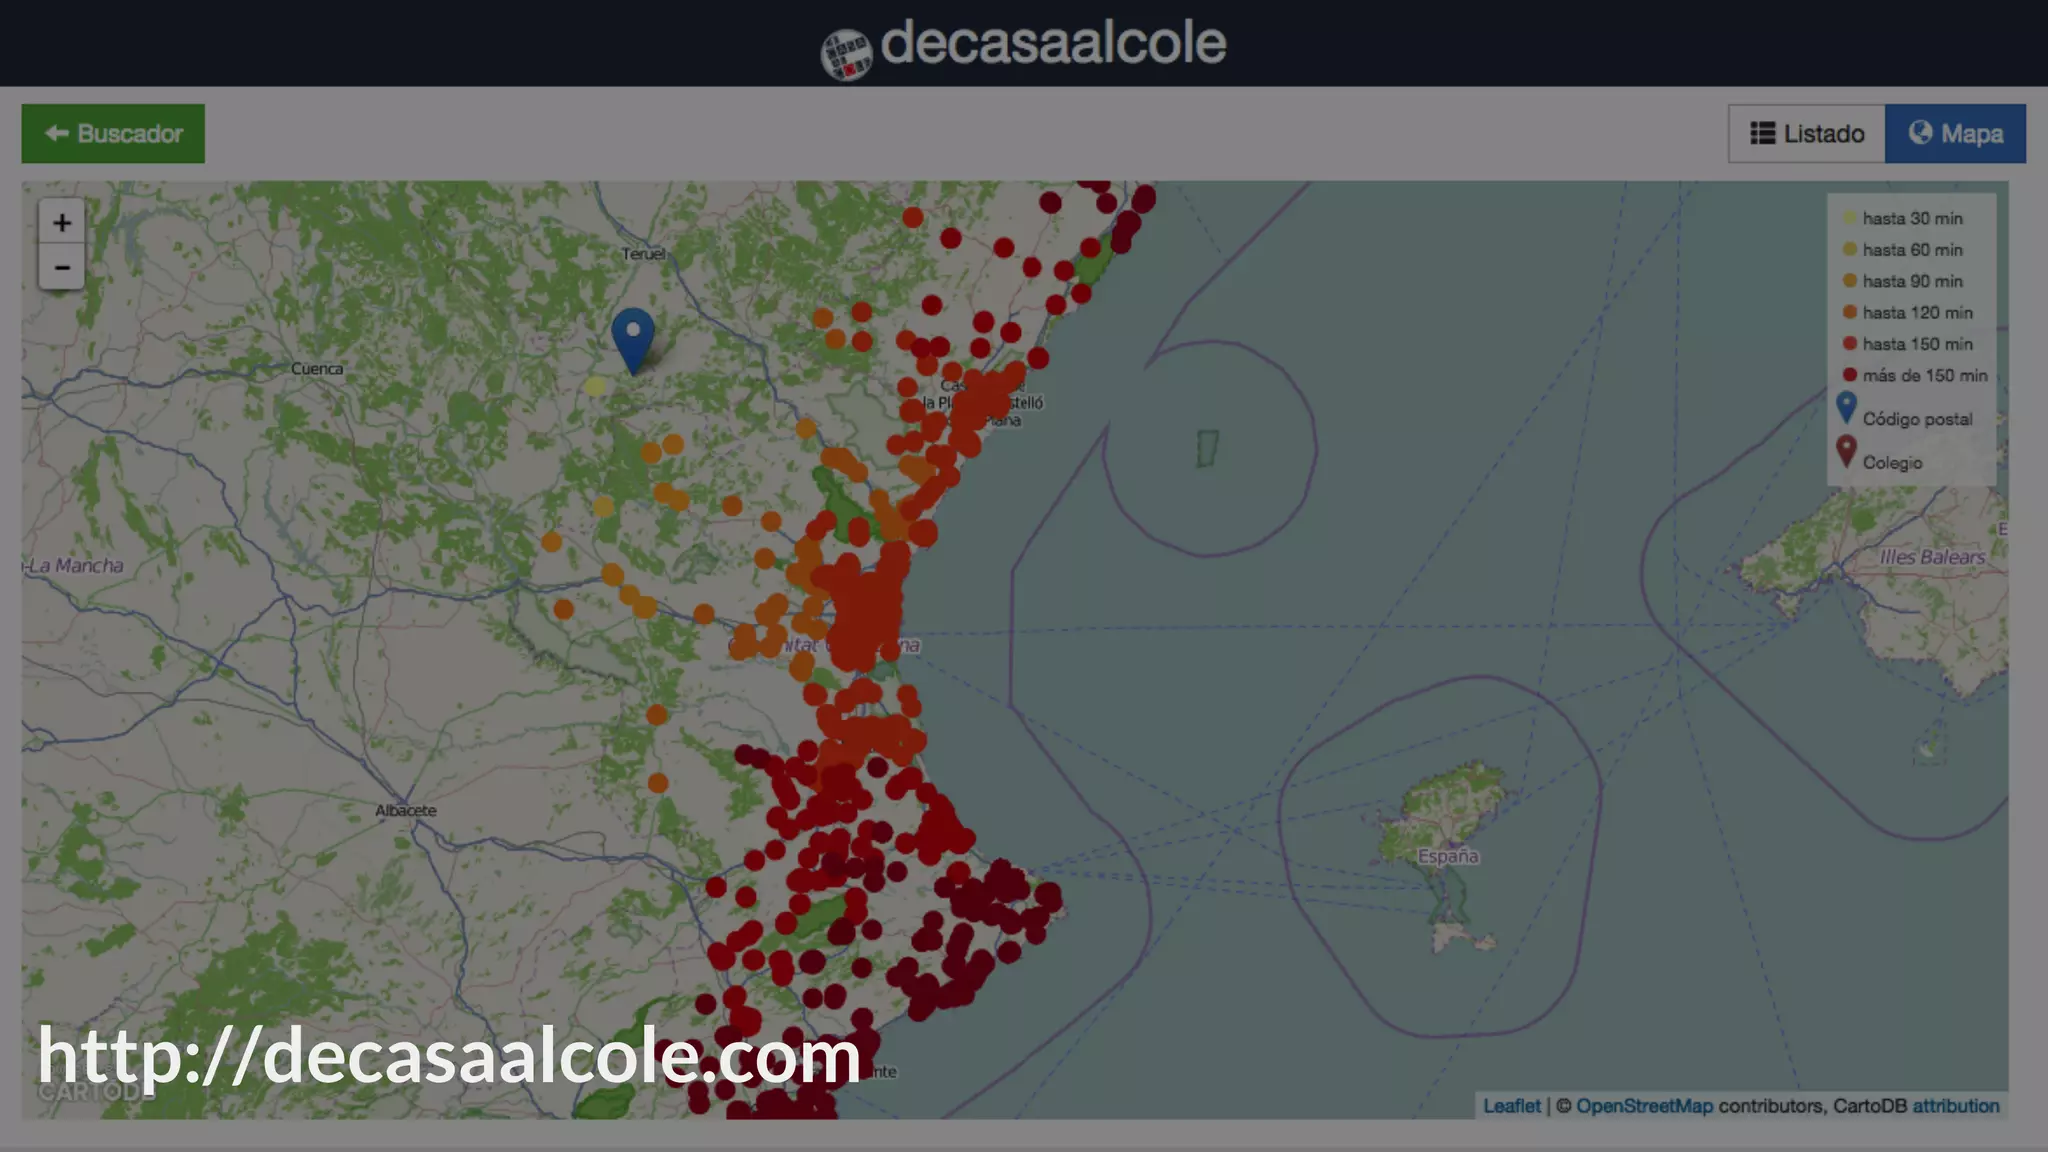
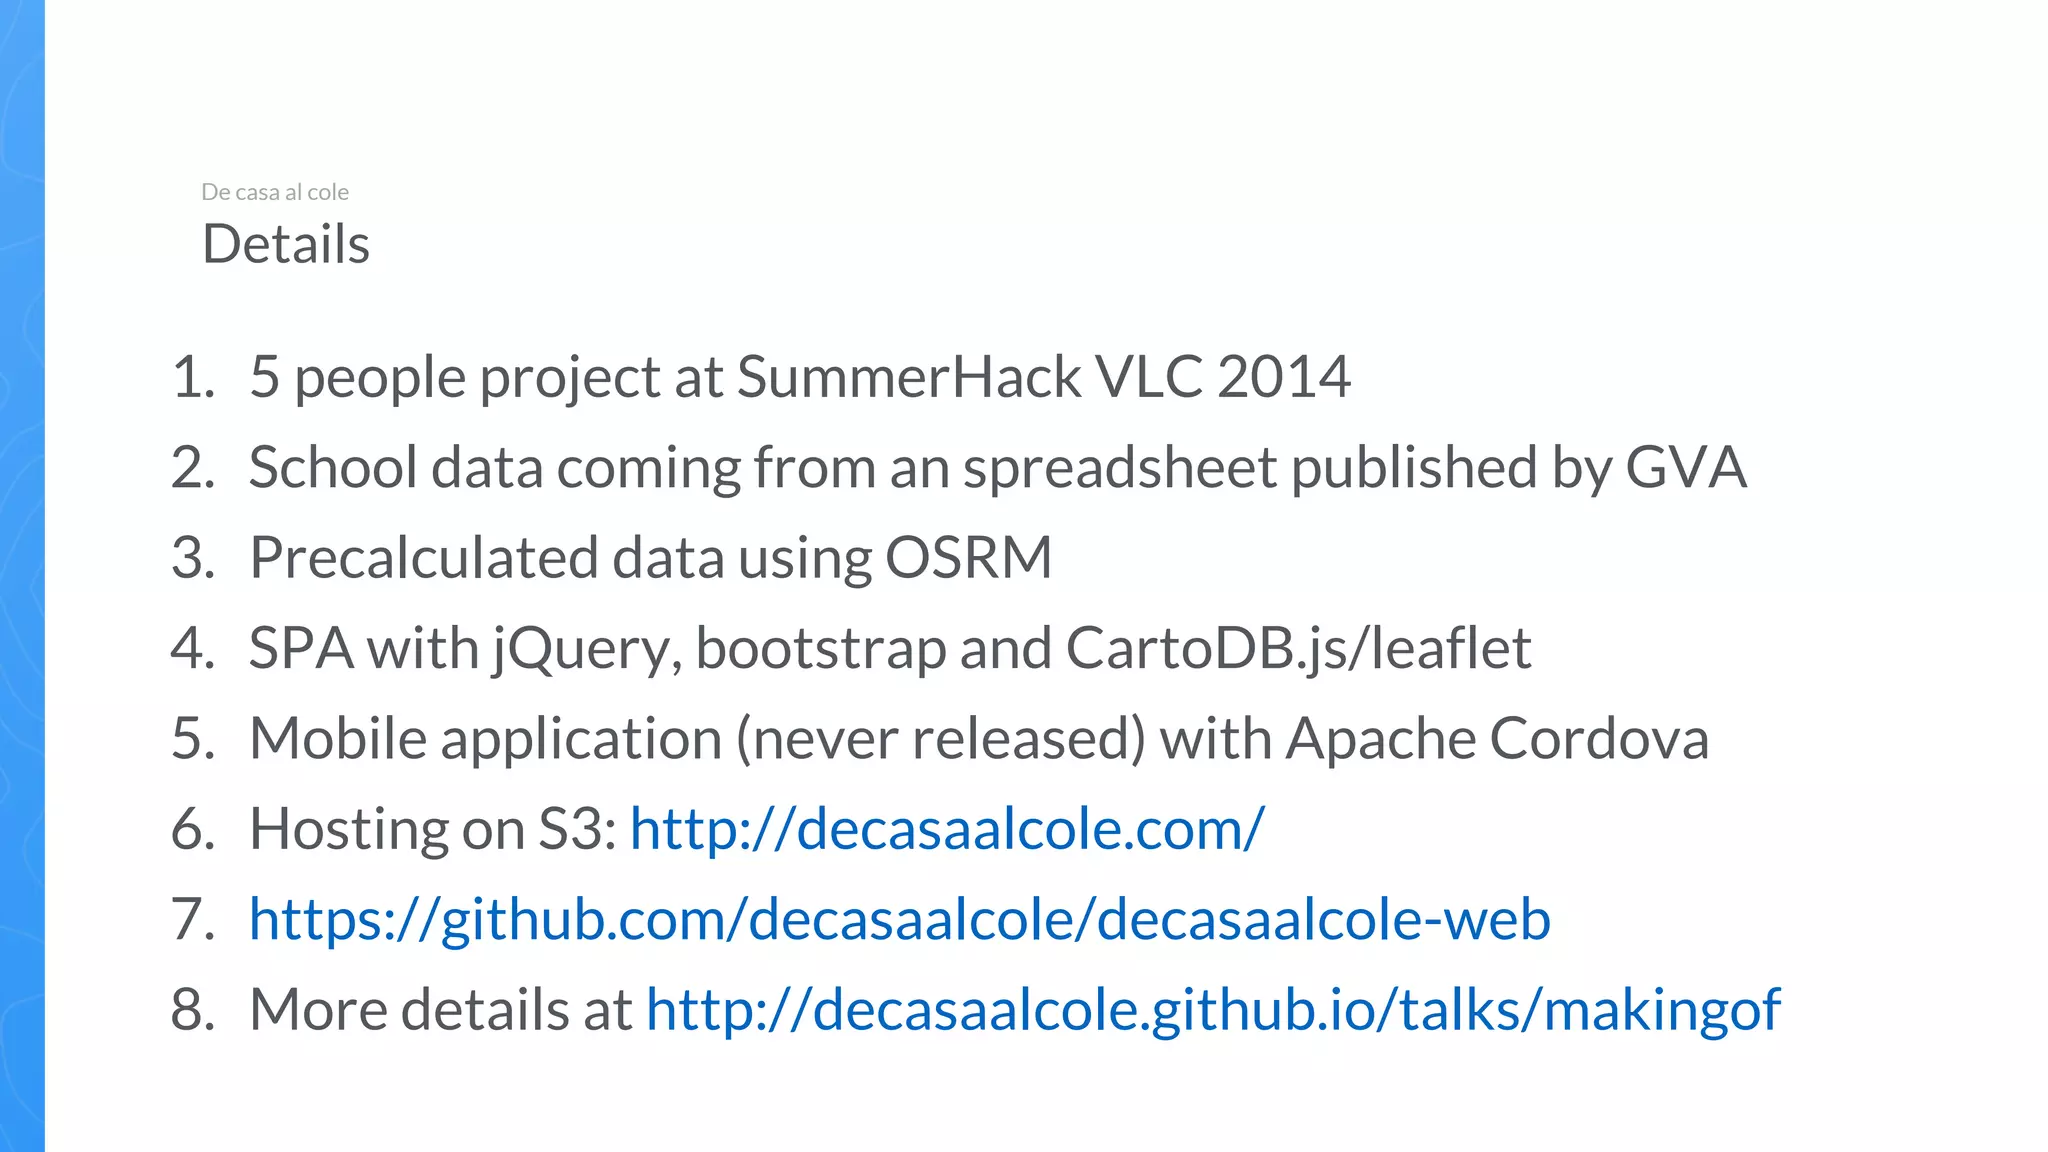
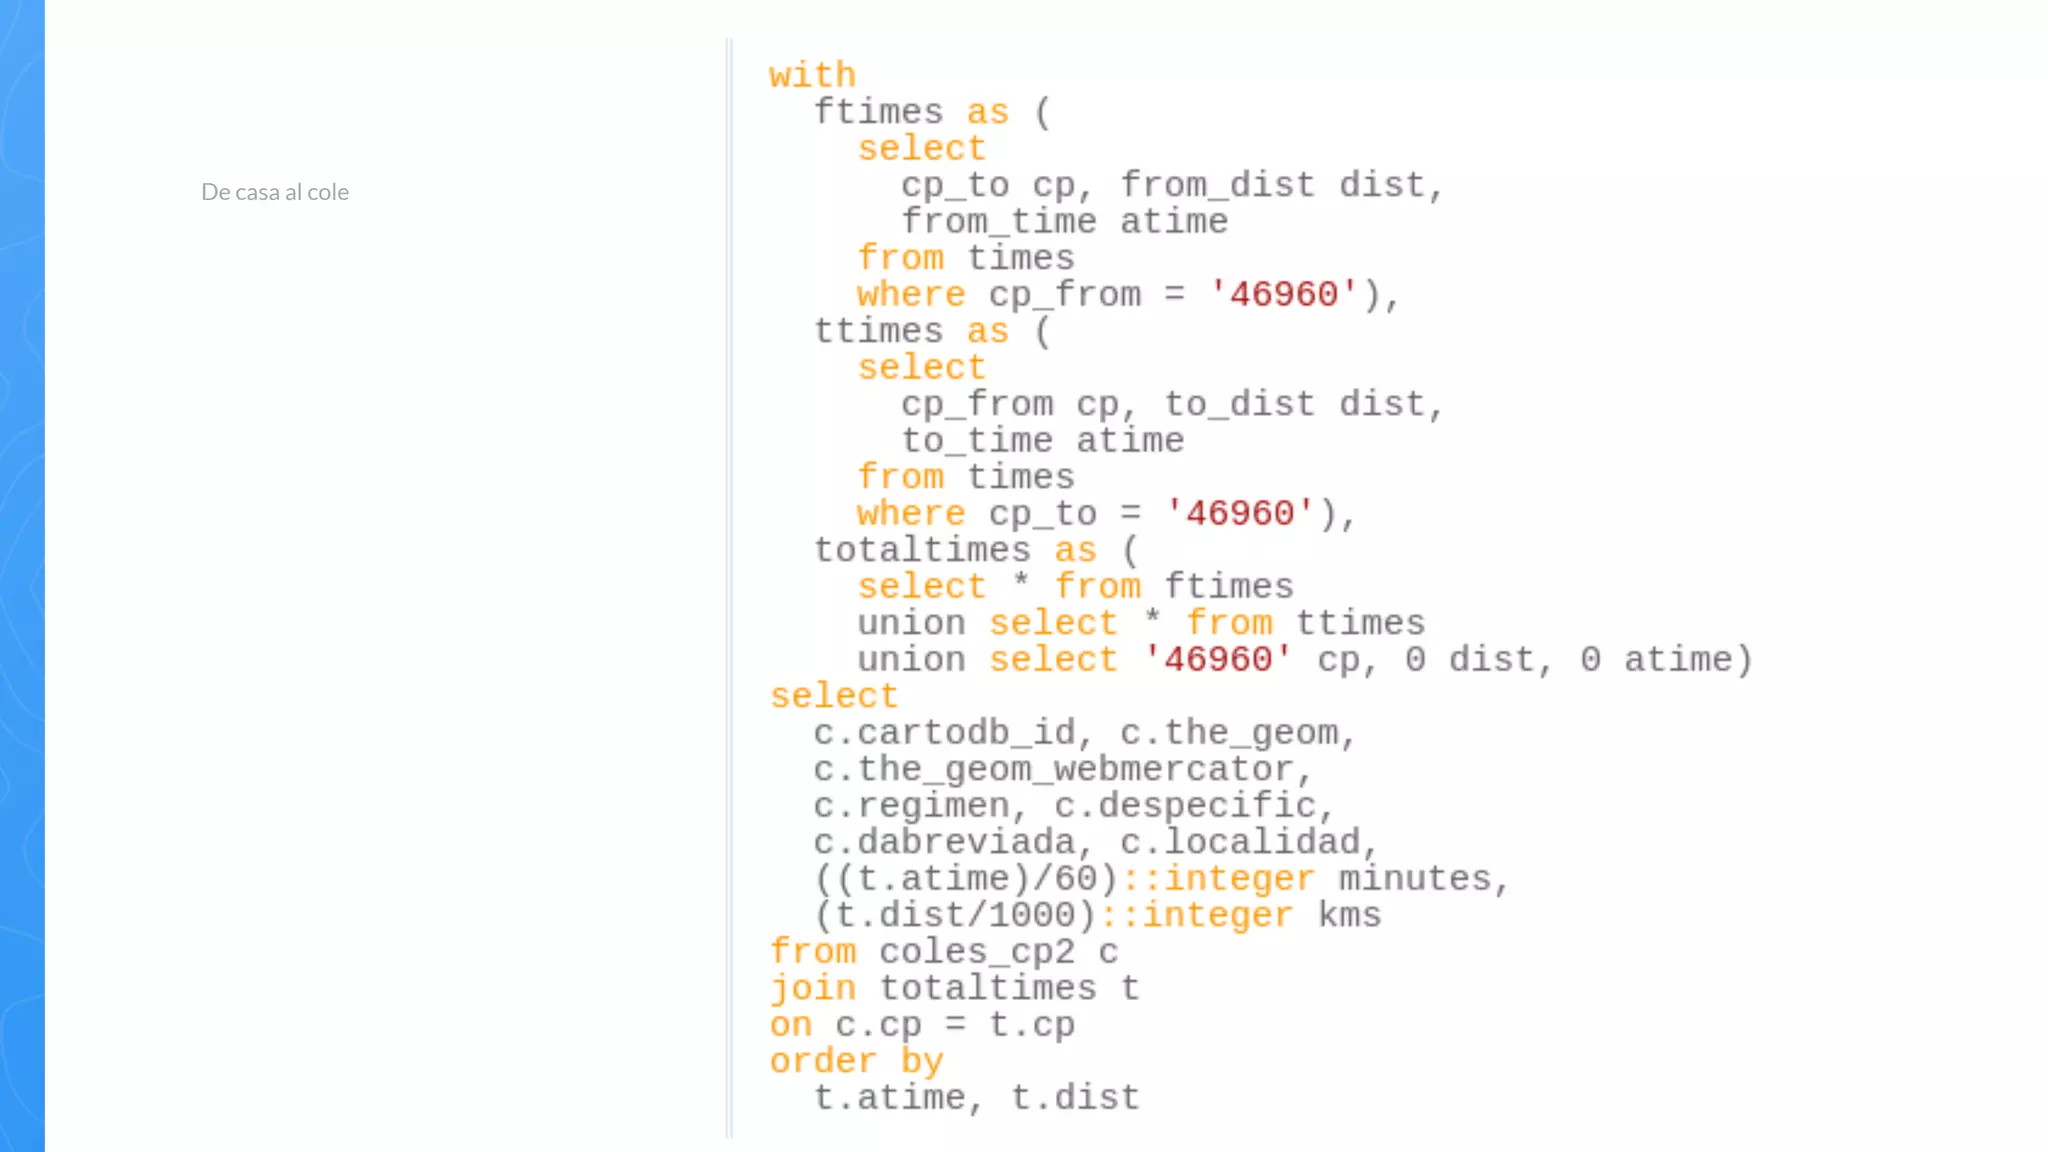
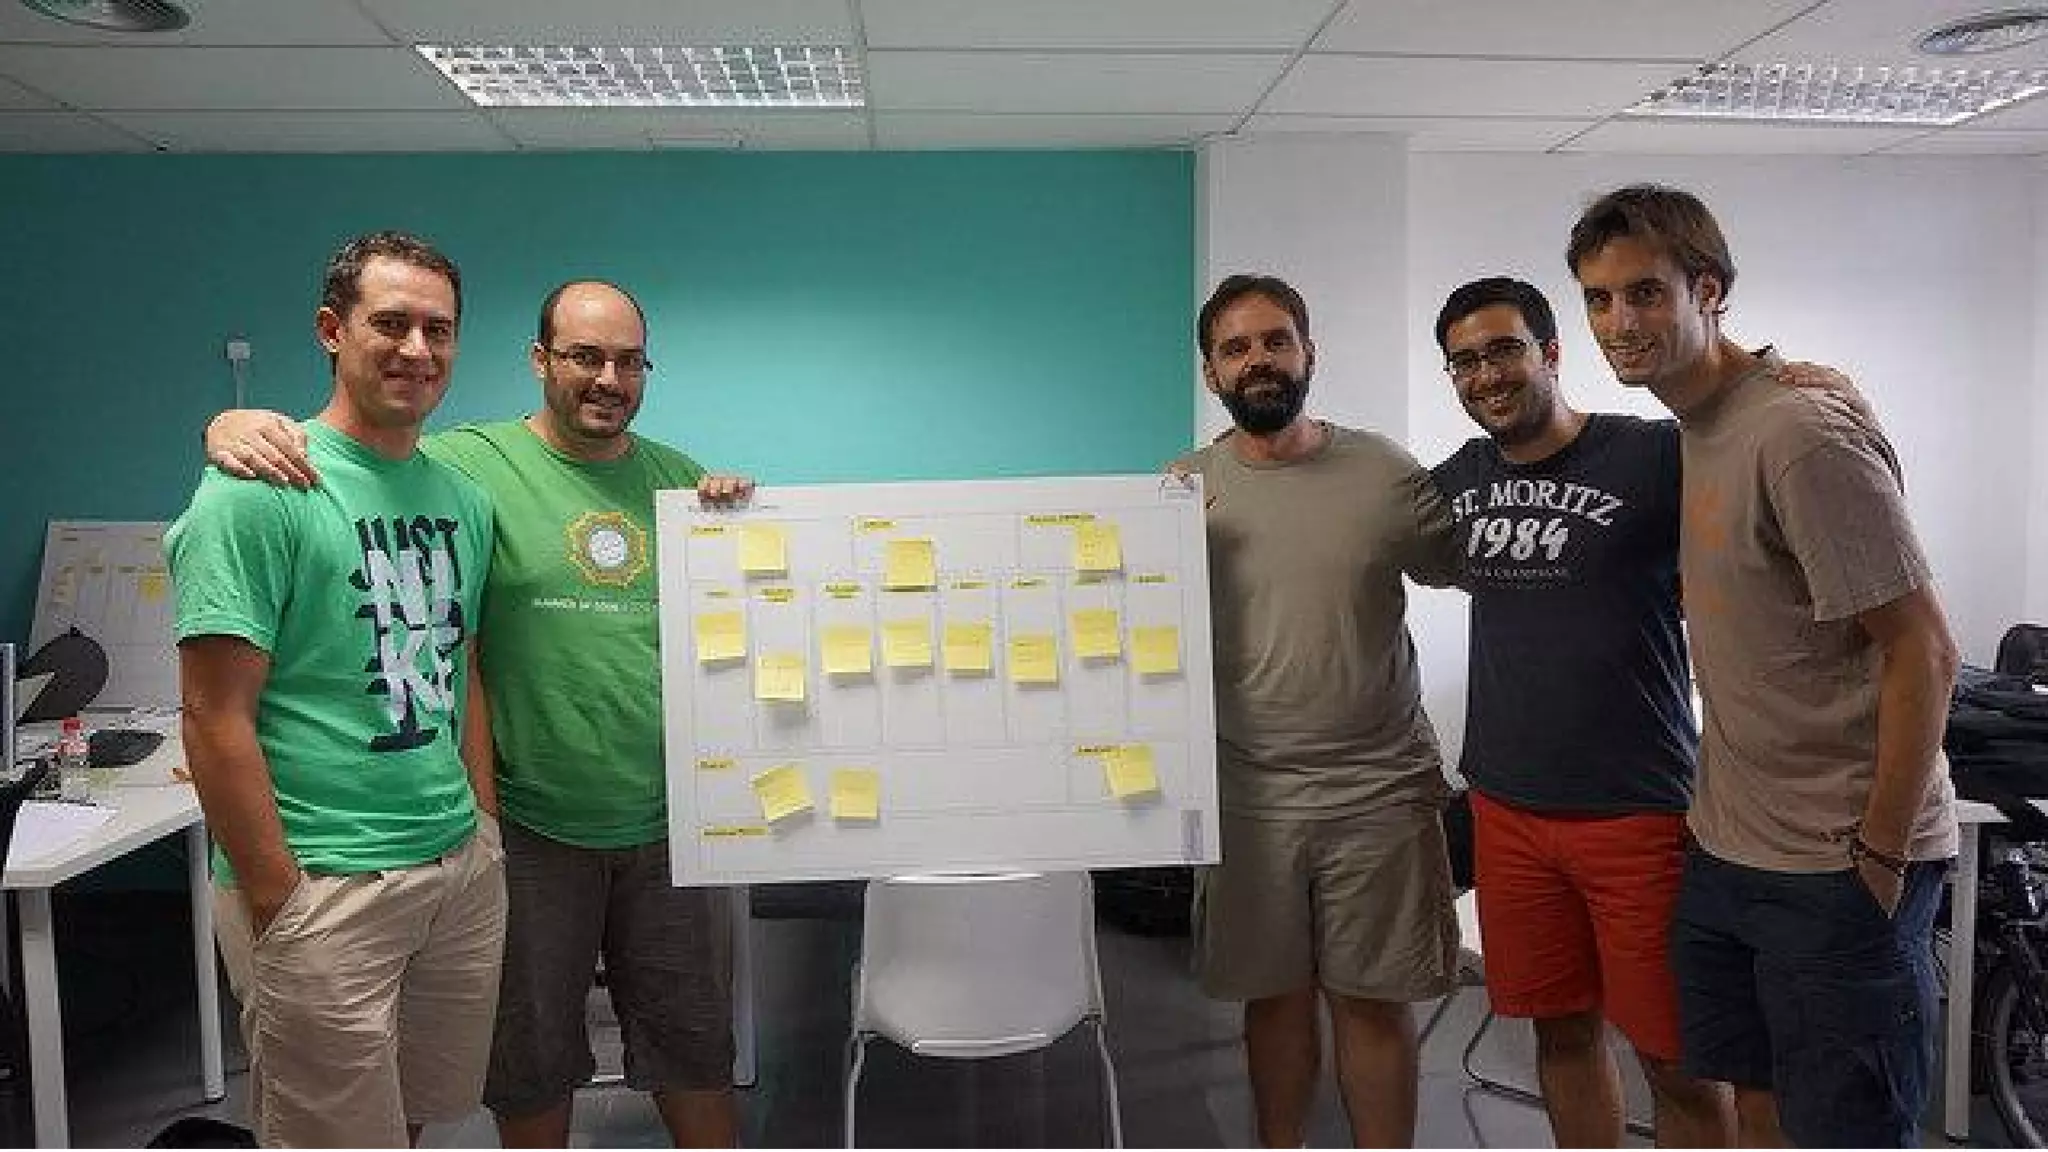
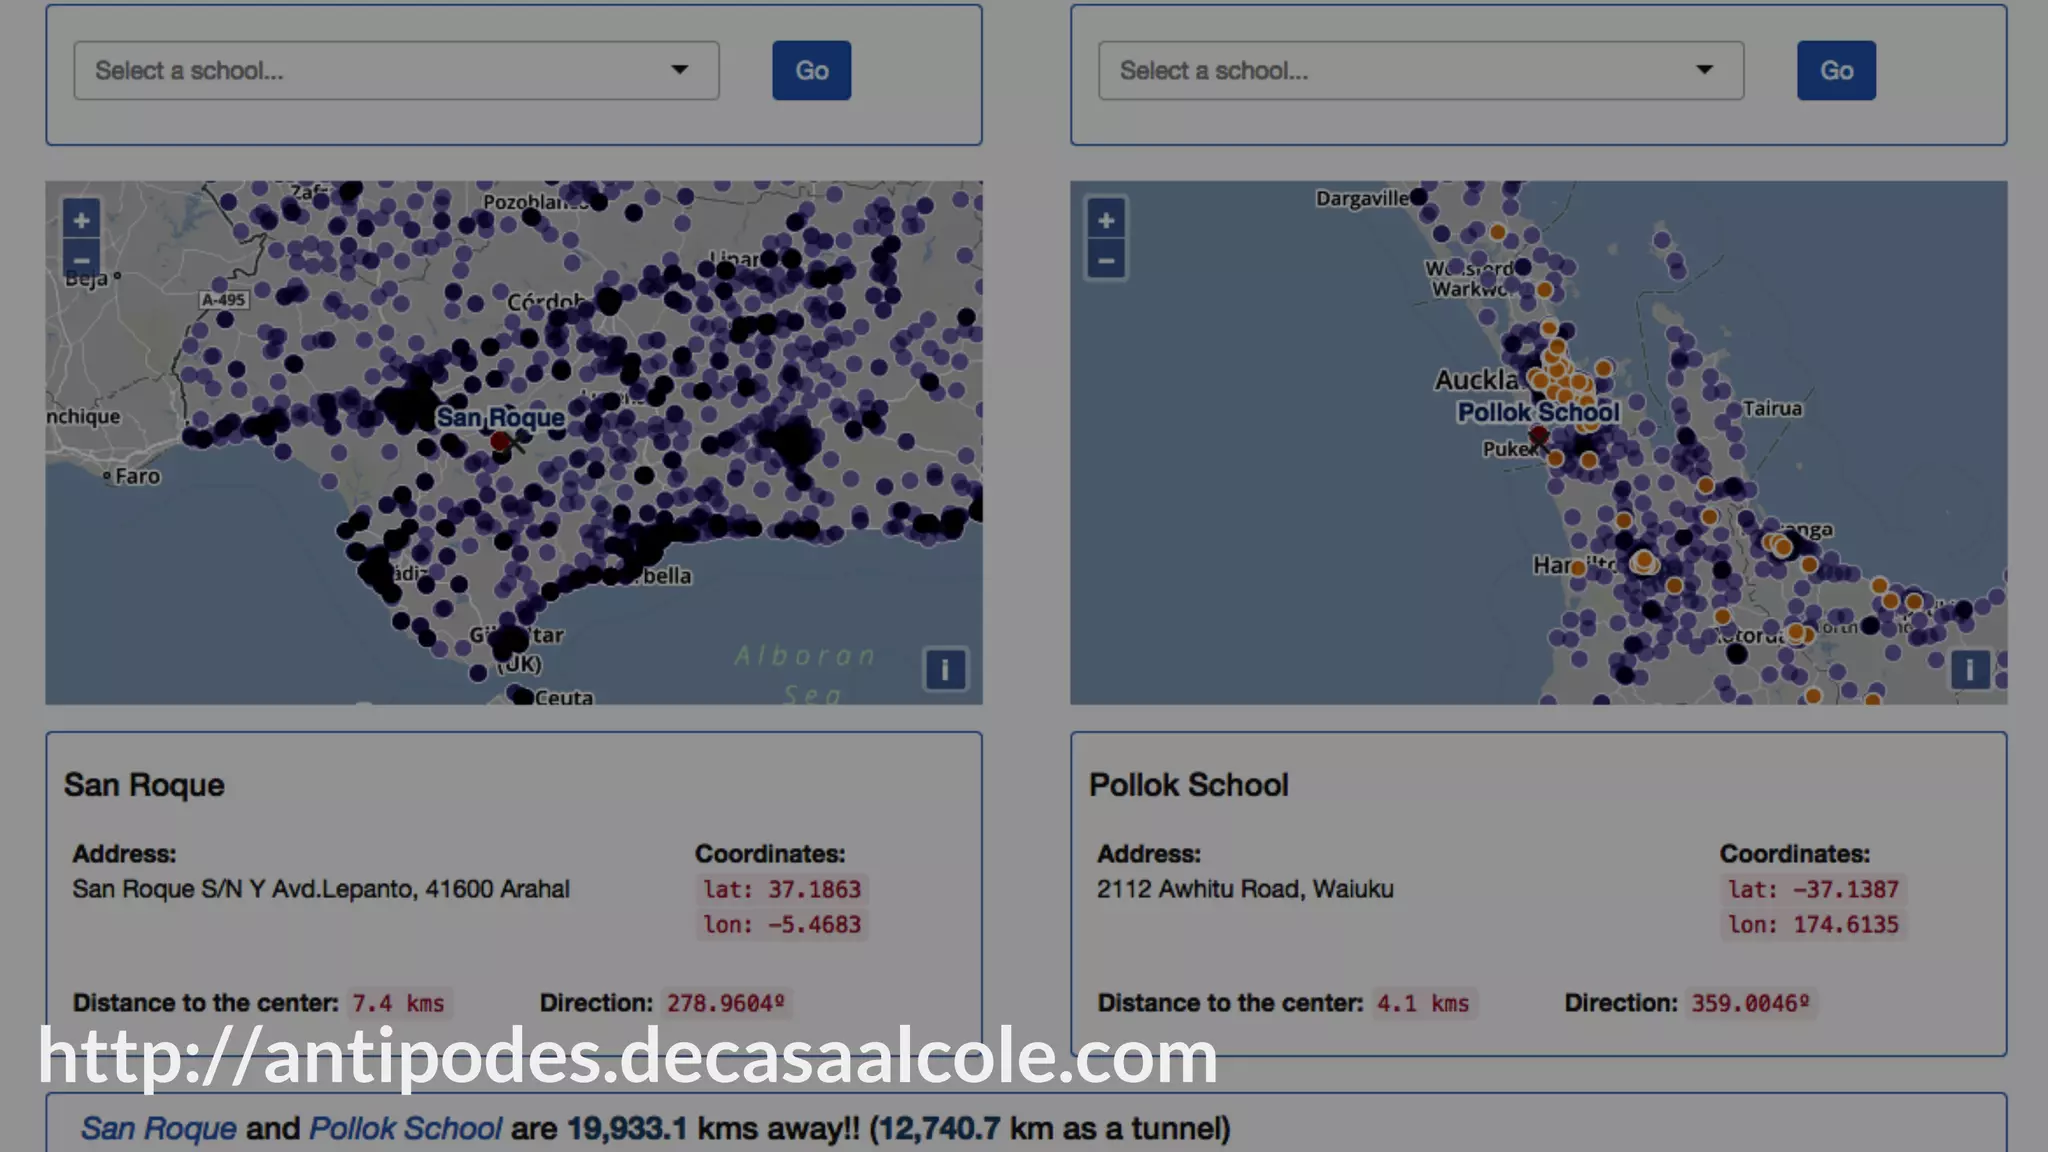
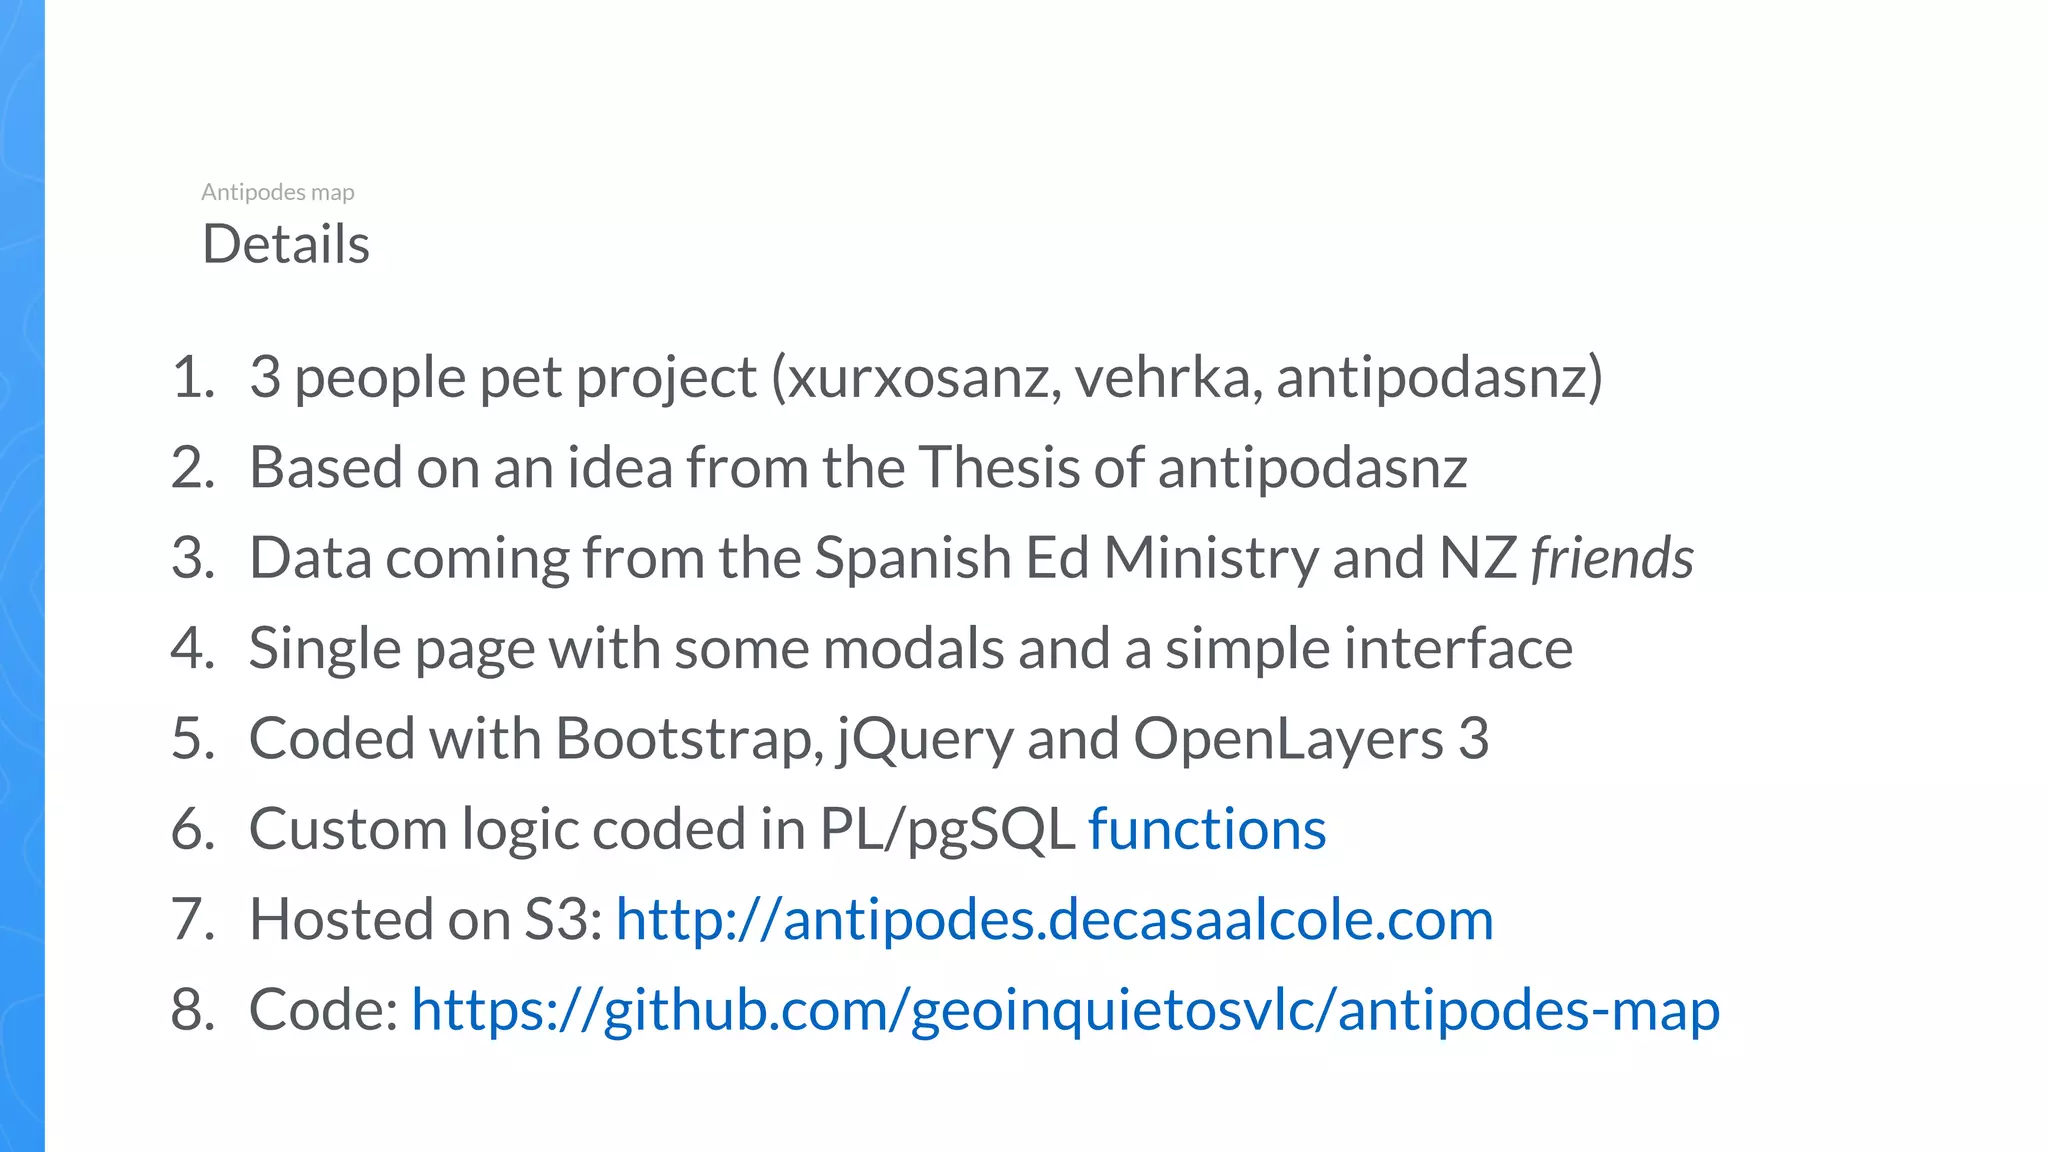


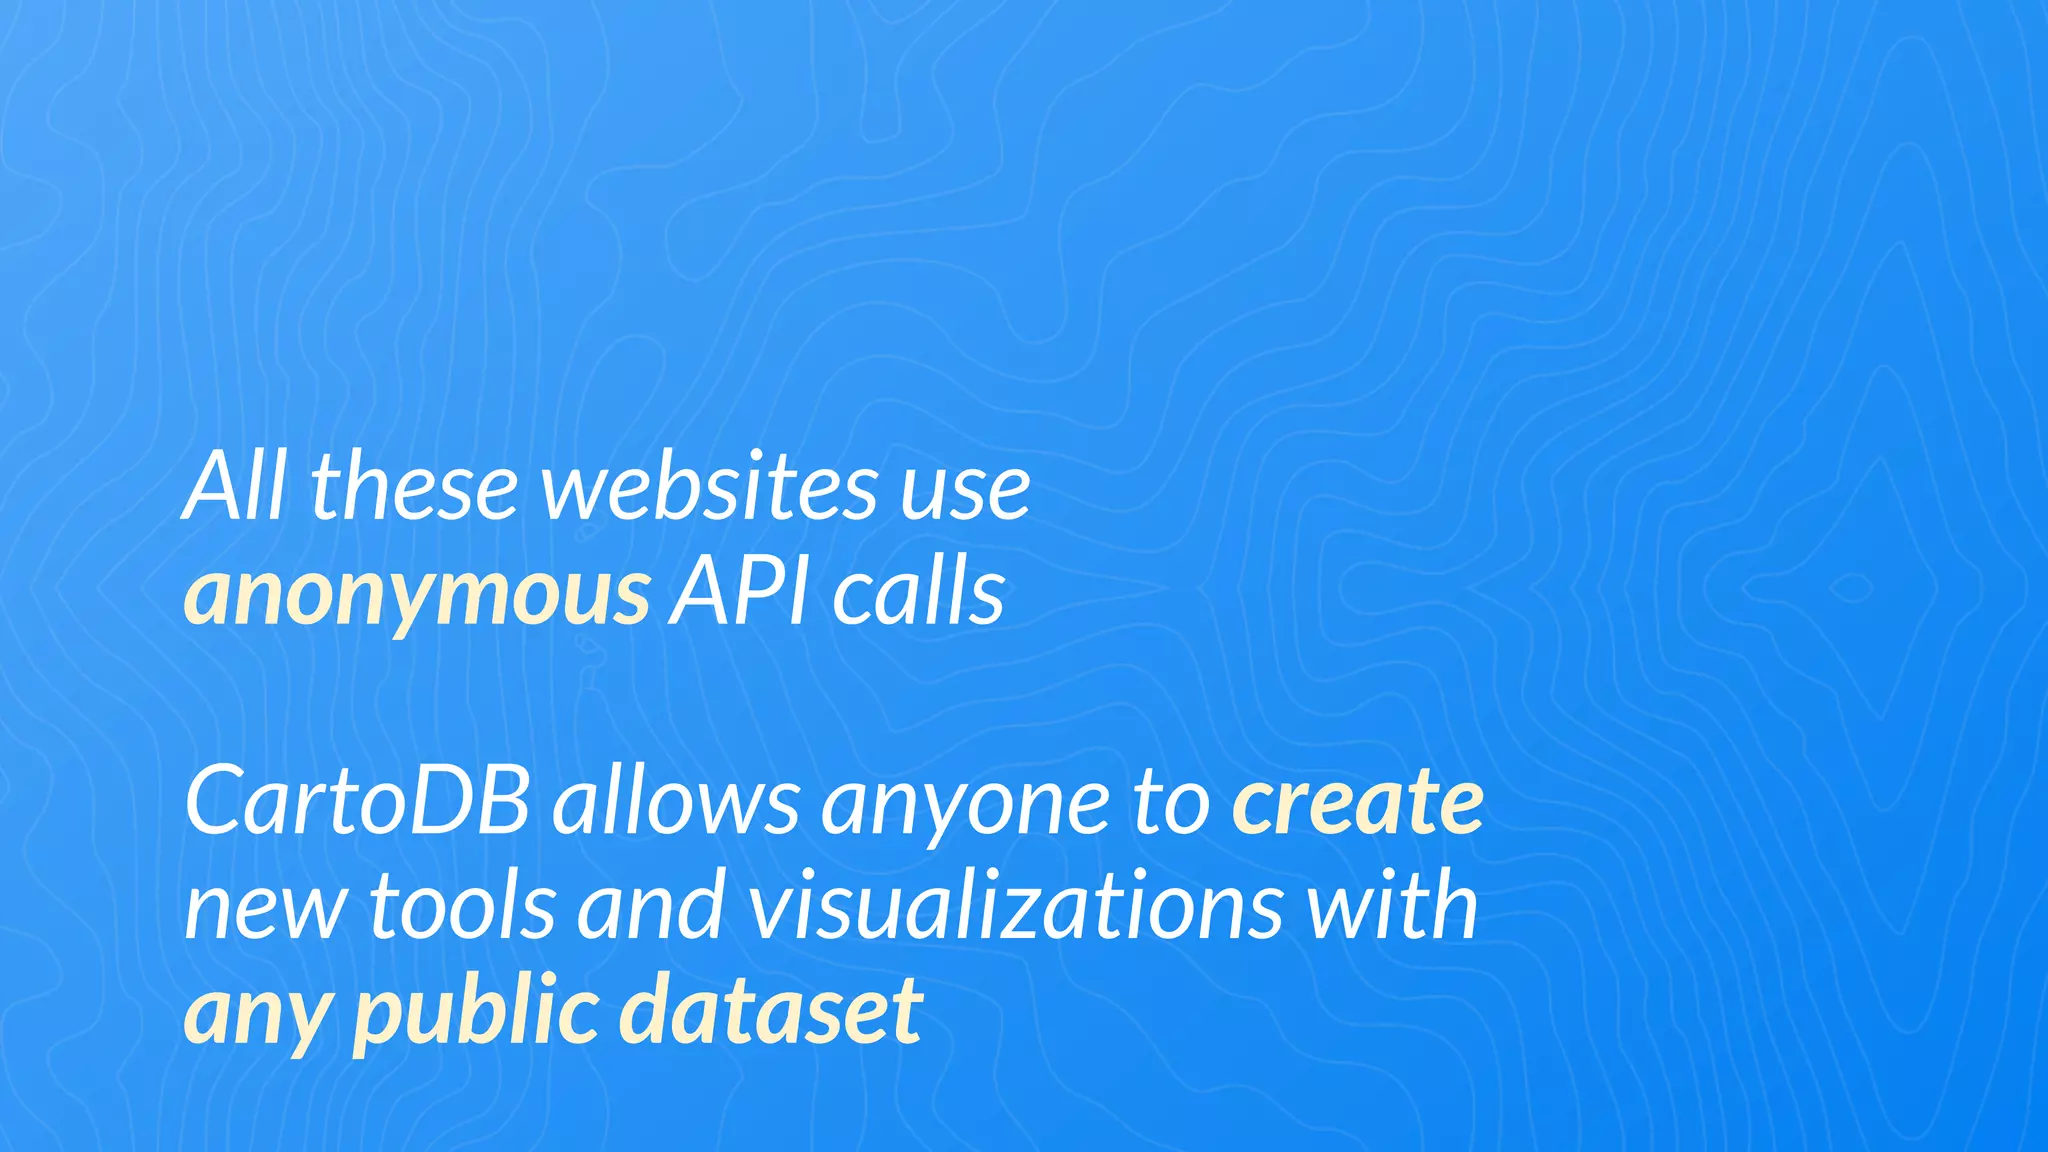
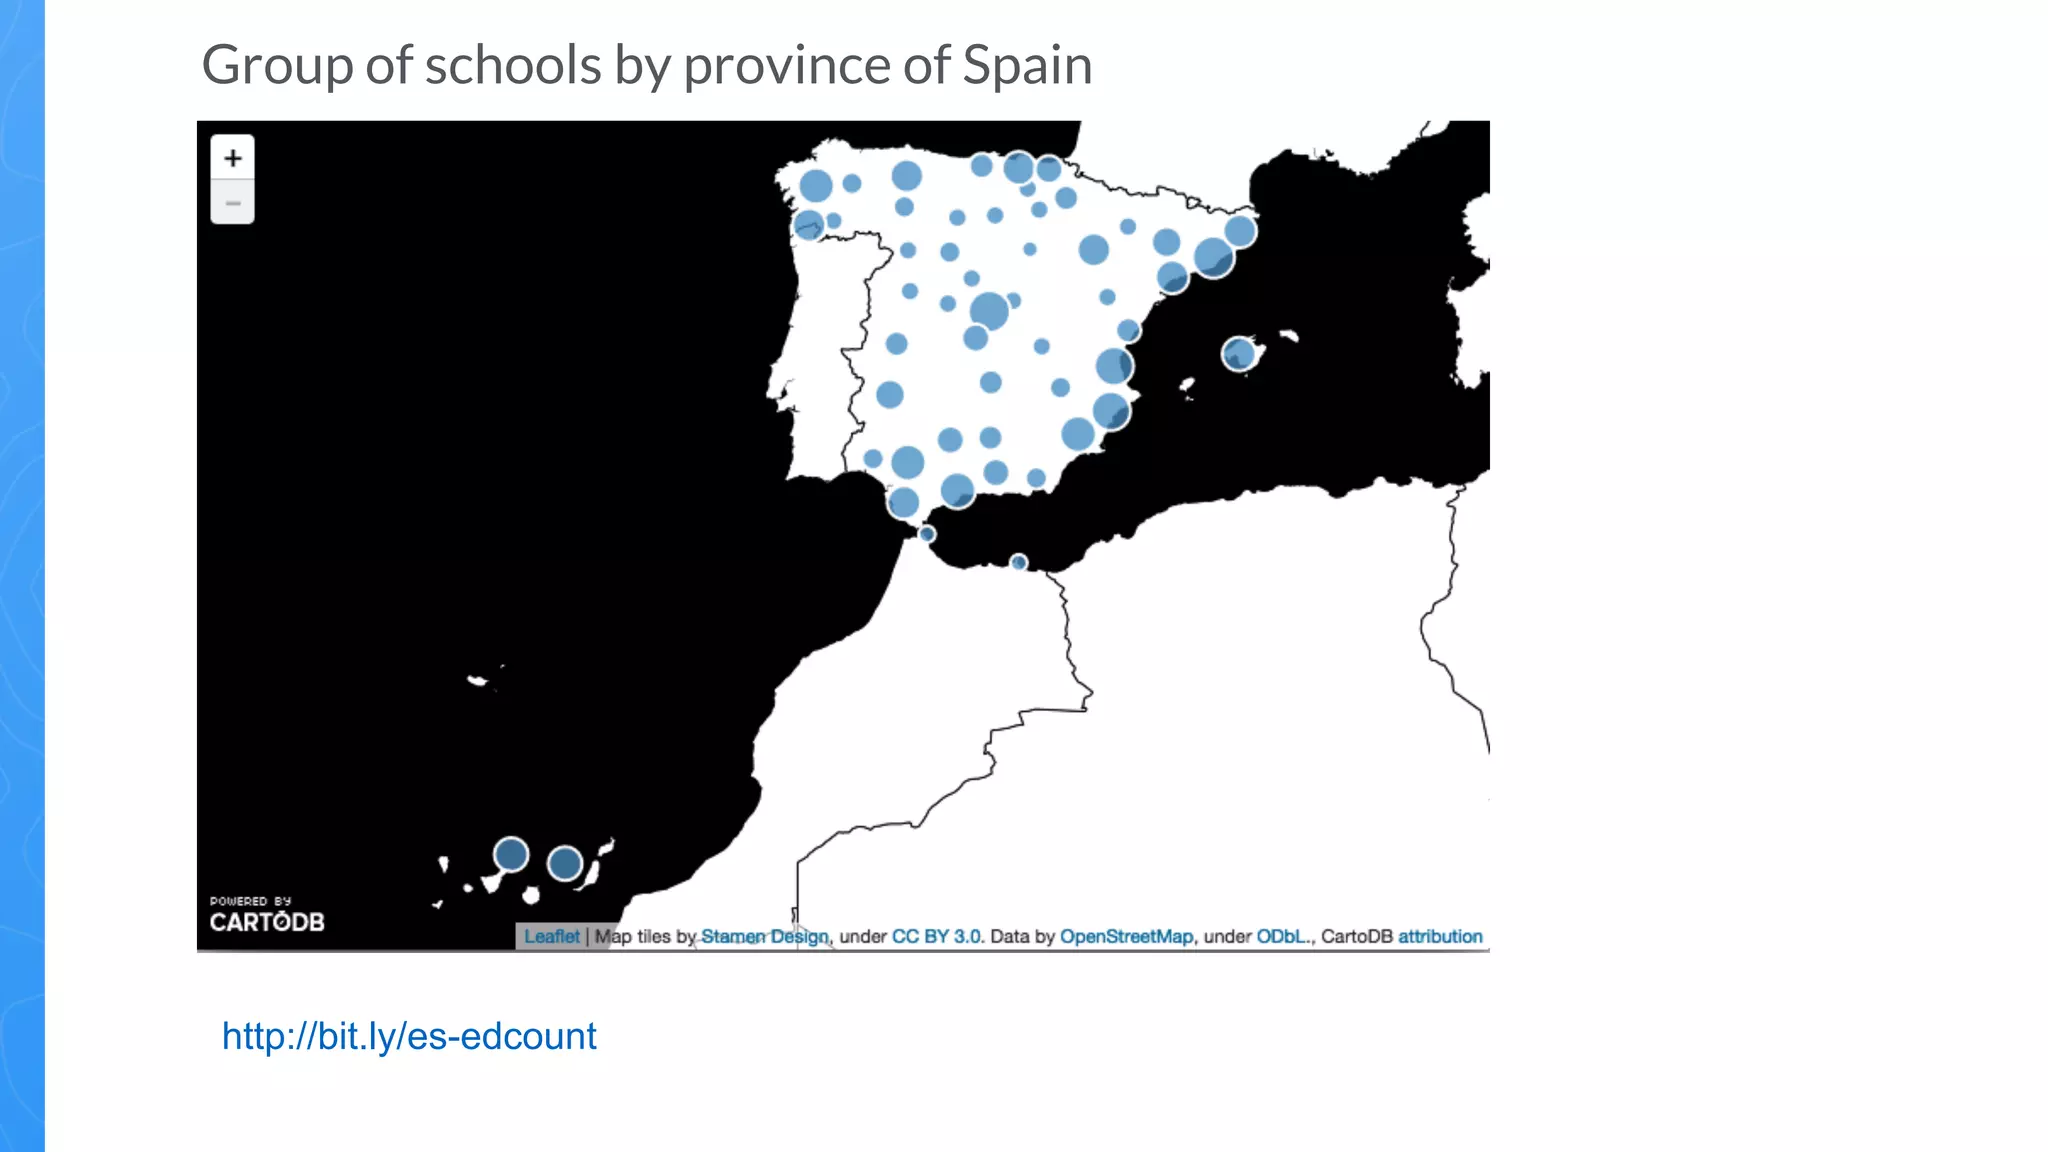
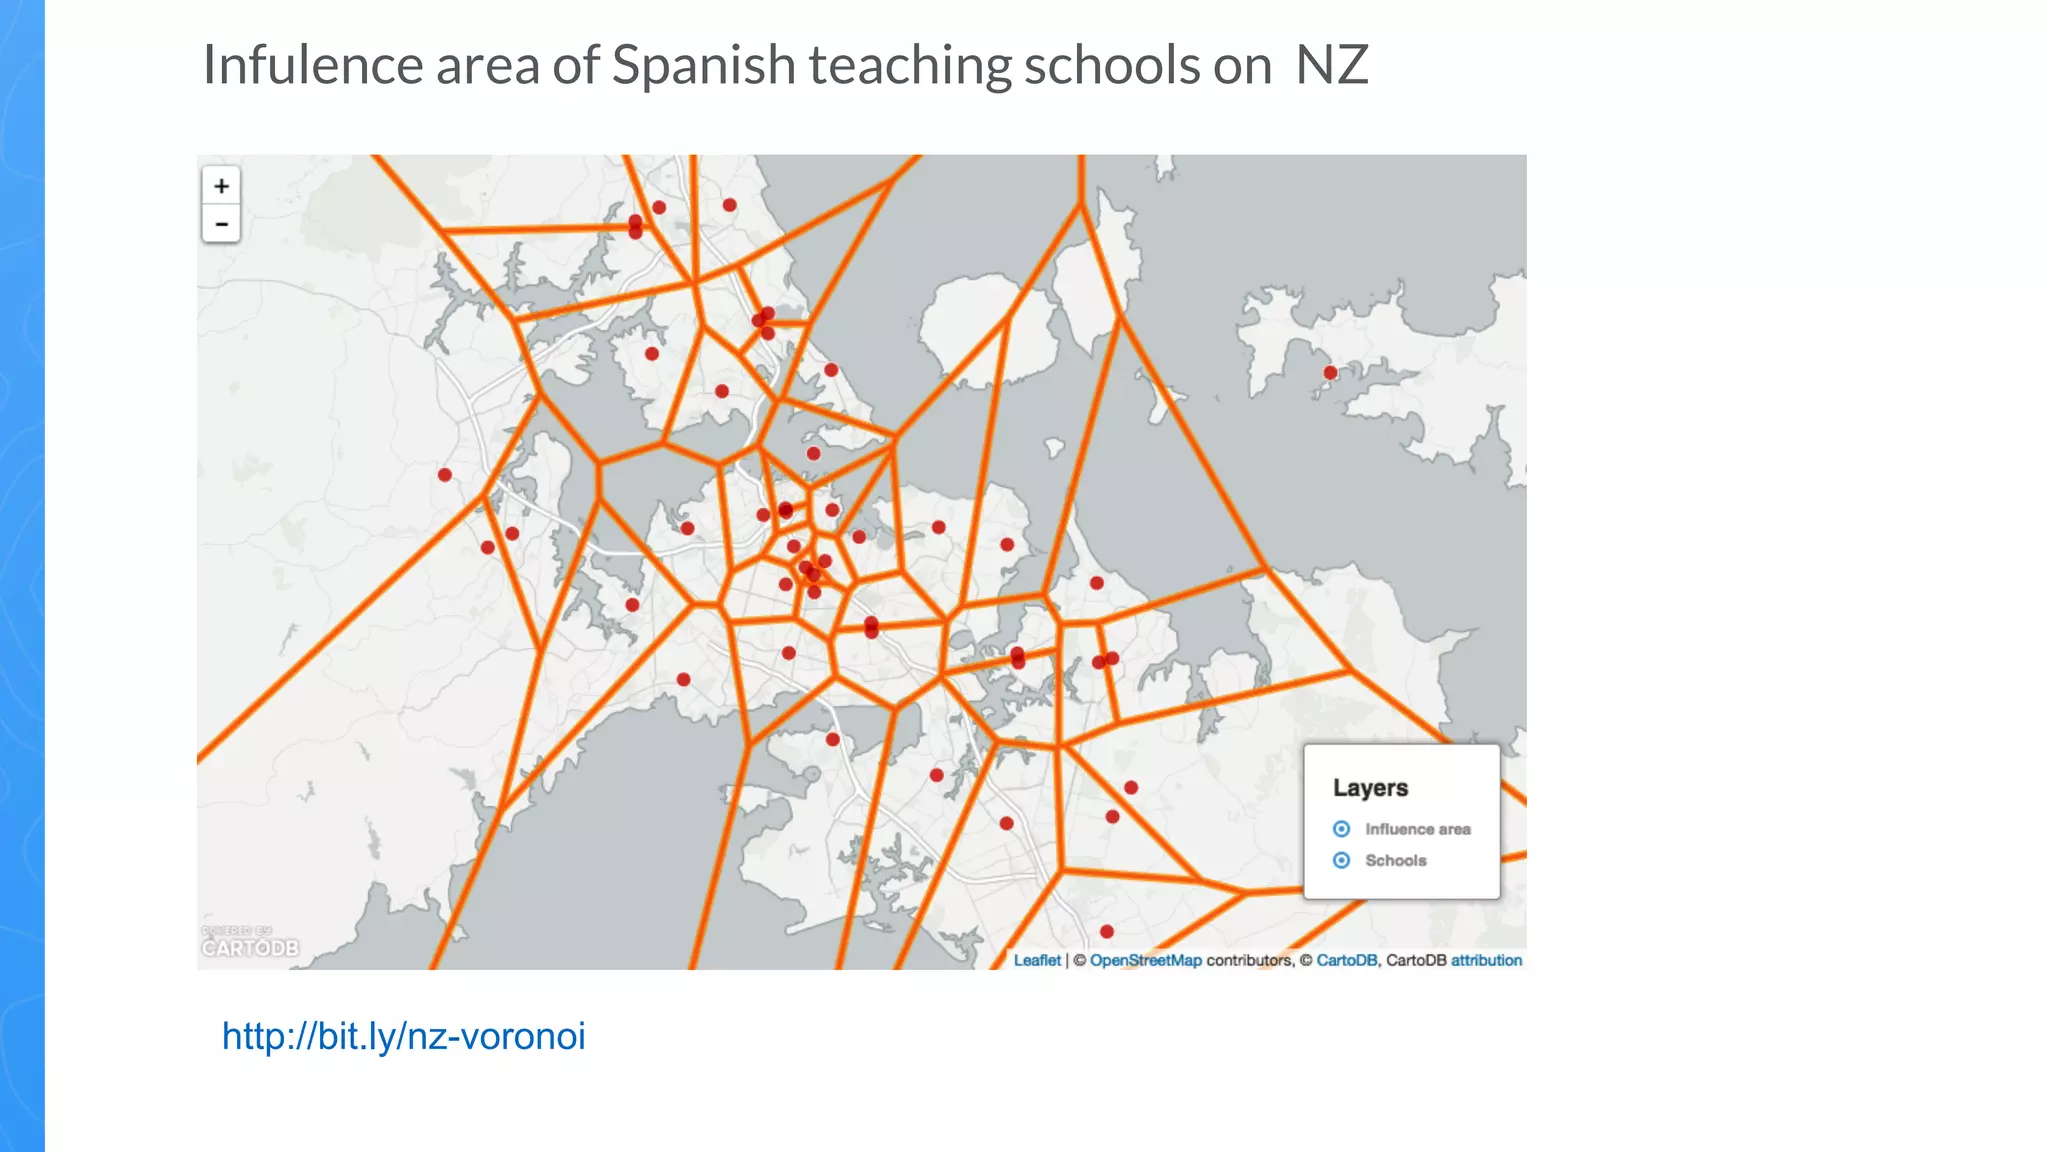


This document summarizes several projects that use open data and CartoDB. It describes a climate data visualization project that extracts and visualizes data from Amazon EBS. It also summarizes a project called "De casa al cole" that calculates school routes in Spain using OSRM. Additionally, it outlines an "Antipodes map" project that maps locations to their antipodes using data from Spain and New Zealand. It encourages reusing and building on top of open data and examples on CartoDB.


![Unlock the power of spatial analysis using CARTO and python [CARTOframes]](https://cdn.slidesharecdn.com/ss_thumbnails/unlockthepowerofspatialanalysisusingcartoandpython-190927095046-thumbnail.jpg?width=640&height=640&fit=bounds)


![CARTO en 5 Pasos: del Dato a la Toma de Decisiones [CARTO]](https://cdn.slidesharecdn.com/ss_thumbnails/cartoen5pasosdeldatoalatomadedecisionesrecordedwebinar-190508103941-thumbnail.jpg?width=640&height=640&fit=bounds)


![Vibe Coding vs. Spec-Driven Development [Free Meetup]](https://cdn.slidesharecdn.com/ss_thumbnails/vibecodingvsspecdrivendevelopment-251209105622-43f455e7-thumbnail.jpg?width=640&height=640&fit=bounds)


