Download to read offline


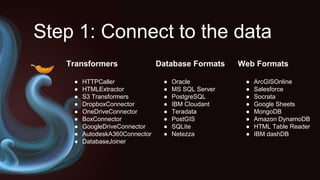
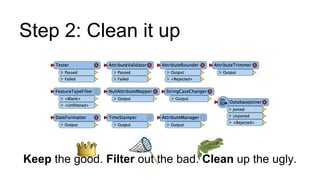
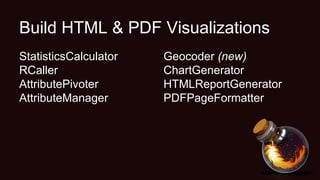
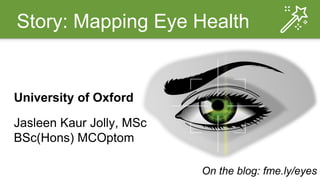
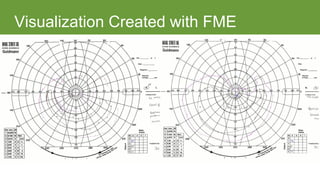
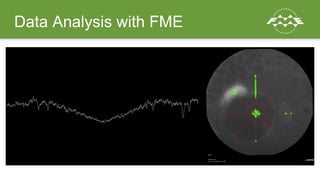
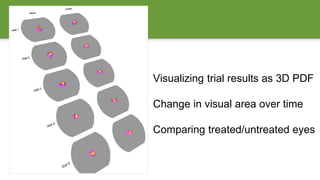

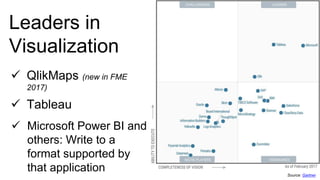
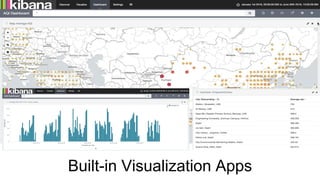

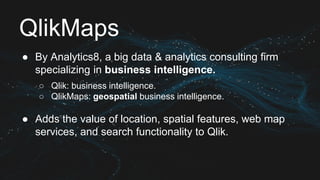

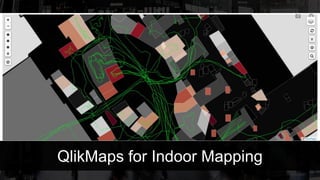
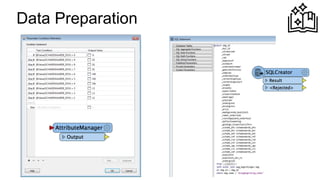
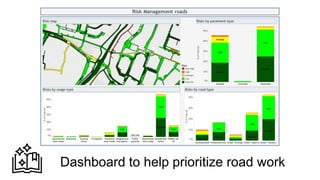


This document discusses how data can be collected from various sources and transformed into useful information using FME. It outlines a three step process: 1) Connect to data from different formats and sources, 2) Clean the data by keeping useful information and filtering out bad data, and 3) Make the data presentable through visualizations, statistics, and reports. Examples of using FME to visualize trial results in PDFs and create dashboards for infrastructure asset management are provided. QlikMaps, Tableau, and other tools for business intelligence and creating visualizations are also mentioned.