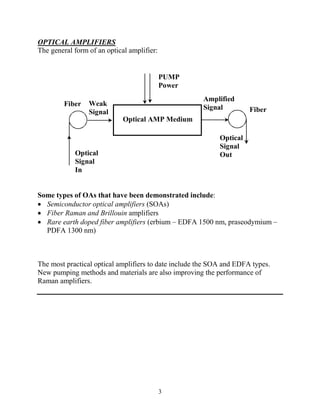
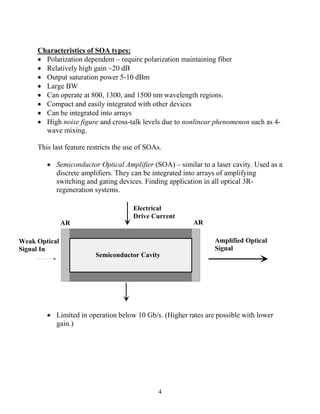
SlideShare a Scribd company logo
SECTION 5: OPTICAL AMPLIFIERS


              1
OPTICAL AMPLIFIERS

  · In order to transmit signals over long distances (>100 km) it is necessary to
    compensate for attenuation losses within the fiber.

  · Initially this was accomplished with an optoelectronic module consisting of an
    optical receiver, a regeneration and equalization system, and an optical
    transmitter to send the data.

  · Although functional this arrangement is limited by the optical to electrical and
    electrical to optical conversions.


Fiber                                                                               Fiber
                   OE                                          OE
                   Rx                                          Tx
                                    Electronic Amp                          Optical
                                    Equalization                            Signal
   Optical                          Regeneration                            Out
   Signal
   In


  · Several types of optical amplifiers have since been demonstrated to replace the
    OE – electronic regeneration systems.
  · These systems eliminate the need for E-O and O-E conversions.
  · This is one of the main reasons for the success of today’s optical
    communications systems.


                                           2
OPTICAL AMPLIFIERS
The general form of an optical amplifier:


                                            PUMP
                                            Power
                                                      Amplified
         Fiber   Weak
                                                      Signal          Fiber
                 Signal
                             Optical AMP Medium

                                                            Optical
                                                            Signal
            Optical                                         Out
            Signal
            In


Some types of OAs that have been demonstrated include:
· Semiconductor optical amplifiers (SOAs)
· Fiber Raman and Brillouin amplifiers
· Rare earth doped fiber amplifiers (erbium – EDFA 1500 nm, praseodymium –
  PDFA 1300 nm)


The most practical optical amplifiers to date include the SOA and EDFA types.
New pumping methods and materials are also improving the performance of
Raman amplifiers.


                                            3
Characteristics of SOA types:
     · Polarization dependent – require polarization maintaining fiber
     · Relatively high gain ~20 dB
     · Output saturation power 5-10 dBm
     · Large BW
     · Can operate at 800, 1300, and 1500 nm wavelength regions.
     · Compact and easily integrated with other devices
     · Can be integrated into arrays
     · High noise figure and cross-talk levels due to nonlinear phenomenon such as 4-
       wave mixing.

     This last feature restricts the use of SOAs.

        · Semiconductor Optical Amplifier (SOA) – similar to a laser cavity. Used as a
          discrete amplifiers. They can be integrated into arrays of amplifying
          switching and gating devices. Finding application in all optical 3R-
          regeneration systems.

                                       Electrical
                                       Drive Current
               AR                                       AR

Weak Optical                                                   Amplified Optical
Signal In                                                      Signal
                         Semiconductor Cavity


        · Limited in operation below 10 Gb/s. (Higher rates are possible with lower
          gain.)


                                               4
Rare Earth Doped Fiber Amplifier Characteristics:
Rare earth doped fiber amplifiers are finding increasing importance in optical
communications systems. Perhaps the most important version is erbium doped
fiber amplifiers (EDFAs) due to their ability to amplify signals at the low loss 1.55
mm wavelength range.


Characteristics of EDFAs (advantages):

· High power transfer efficiency from pump to signal power (> 50%).
· Wide spectral band amplification with relative flat gain (>20 dB) – useful for
  WDM applications.
· Saturation output > 1 mW (10 to 25 dBm).
· Gain-time constant long (>100 msec) to overcome patterning effects and inter-
  modulation distortions ( low noise).
· Large dynamic range.
· Low noise figure.
· Polarization independent.
· Suitable for long-haul applications.


Disadvantages of EDFAs:

· Relatively large devices (km lengths of fiber) – not easily integrated with other
  devices.
· ASE – amplified spontaneous emission. There is always some output even with
  no signal input due to some excitation of ions in the fiber – spontaneous noise.
· Cross-talk effects.
· Gain saturation effects.


                                          5
· An energy level diagram for Er doped silica is shown below.


           4I (11/2)                                0.98 um


           4I (13/2)                                1.53 um

                 Pump           1.48 um
                 Bands
                                           Emission
                                           Wavelengths
            4I (15/2)


· Pumping is primarily done optically with the primary pump wavelengths at 1.48
  mm and 0.98 mm. As indicated atoms pumped to the 4I (11/2) 0.98 mm band
  decays to the primary emission transition band. Pumping with 1.48 mm light is
  directly to the upper transition levels of the emission band.

· Semiconductor lasers have been developed for both pump wavelengths.

· 10-20 mW of absorbed pump power at these wavelengths can produce 30-40
  dB of amplifier gain.

· Pump Efficiencies of 11 dB/mW achieved at 980 nm.

· Pumping can also be performed at 820 and 670 nm with GaAlAs laser diodes.
  Pump efficiencies are lower but these lasers can be made with high output
  power.


                                       6
Typical Absorption/Gain Spectrum for Erbium Doped Fiber:

             10


                                                               6


                                                                   (X 10^(-25)m^2)
                                                                   Cross Section
 Loss/Gain
 (dB/m)


                   Absorption                                  4
             5


                                                              2
                                         Gain


             0
                               1.51         1.53       1.55
                                   Wavelength (um)


· Since the gain spectrum of erbium resembles a 3-level atom it is possible to
  model the gain properties using this approach.


· Several different wavelength bands have been designated for wavelength
  division multiplexing and EDFAs have been designed to operate in these bands.

· The divisions have been designated as*:

                                  S-Band 1480-1520 nm
                                  C-Band 1521-1560 nm
                                  L-Band 1561-1620 nm
(* Note some variability in these values is common.)


                                               7
General EDFA Amplifier Configuration:


980 or 1480 pump laser
                                                                          Amplified Output
                  Isolator                                                Signal
                                                EDFA

 Weak Input
 Signal                      Coupler                           Narrow Band
                                                               Filter


   Basic Amplifier Characteristics

   Optical Gain
   · Rare earth doped optical amplifiers work much like a laser.

   · The primary difference is that they do not have a resonator.

   · Amplification occurs primarily through the stimulated emission process.

   · The medium is pumped until a population inversion state is achieved. Pump
     powers are typically several 20-250 mW. An isolator is used to reduce
     reflections at the input to the amplifier. A narrow band optical filter is used to
     reduce transmission of amplified spontaneous emission frequency components.

   · The resultant optical gain depends both on the optical frequency and the local
     beam intensity within the amplifier section.

   · For basic discussion consider a two-level homogeneously broadened medium.


                                            8
· The gain coefficient can be expressed as:

                                            go
                     g (w ) =
                                1 + (w - w o ) 2 T22 + P / Ps       ,


go is the peak gain, w is the optical frequency of the incident signal,

wo is the transition frequency, P is the optical power of the incident signal,

T2 is the dipole relaxation time, and Ps is the saturation power.

· Typically T2 is small < 1 ps, and the saturation power Ps depends on gain
  medium parameters such as the fluorescence time and the transition cross
  section.


                                           9
_____________________________________________________________

Gain Spectrum and BW:
· When not saturated (i.e. P/Ps <<1) the gain coefficient g(w) becomes:

                                              go
                            g (w ) =                        .
                                       1 + (w - w o ) 2 T22

· Gain is maximum when w = wo (i.e. the gain coefficient is at resonance).

· At non-resonant frequencies the gain follows the homogeneously broadened
  characteristics of a two level atom (i.e. Lorentzian profile).

· The gain BW for this spectrum is typically expressed as the (Full Width at Half
  Maximum) FWHM
                                 Dw g = 2 T2 .

                                                Dw g
                                  Dn g =
                                                2p

with T2 ; 0.1 ps
                                  Dn g ; 3THz
· Large Spectral BW amplifiers are preferred for fiber optic systems to make
  them less sensitive to dispersed transmitted signals and useful for WDM
  systems.

EDFA Gain Spectrum:

· The gain spectrum of erbium ions alone is homogeneously broadened and the
  BW is determined by the dipole relaxation time T2.

· However when placed in a glass host the spectrum is influenced both by the
  silica and any other dopants. This can result in inhomogeneous broadening
  contributions.
· The combined homogeneous and inhomogeneous BW of EDFAs: ~ 30 nm.


                                           10
Amplification factor:

· Define as:
                                    G = Pout/Pin

Pout is the amplifier output power and Pin the input power of a CW input signal.


                                              Pump


        P                         N2                             P
          in                              Gain                    out
                                          Medium
                                  N1

                    z=0                                   z=L


· From the previous discussion of the laser the gain in optical power per length of
  gain medium (z) with gain g is

                                    dP
                                       = gP .
                                    dz


· Integrating over a length z of amplifier medium gives the resultant optical
  power

                              P( z ) = P(0) exp( gz ) .


                                         11
The amplification factor after a length L of OAM (optical amplifier medium) is


                              G (w ) = exp[g (w ) L]

Both g(w) and G(w) are a maximum when the frequency is at resonance w = w o
and decrease when the frequency is detuned from resonance.

However the amplifier factor(G) decreases much faster than the gain coefficient(g).


· The amplifier BW DnA is defined as the FWHM of G(w)

                                                       0.5
                                       æ ln 2 ö
                                       ç ln(G / 2) ÷
                           Dn A = Dn g ç           ÷
                                       è     o     ø


where Dng is the gain BW, and Go = exp(goL).


· The amplifier BW is smaller than the gain BW. The difference depends on the
  amplifier gain characteristics.

                          If Go = 10, Dn A = 0.656 Dn g


                                        12
Gain Saturation:

· Since g(w) depends on the incident optical power when P » PS, G will start to
  decrease with an increase in optical power P.

· Assume that the incident frequency is tuned for peak gain (w = wo)

                                 dP    go P
                                    =          .
                                 dz 1 + P / Ps


· With the conditions P(0) = Pinc and P(L) = Pout = GPinc the large signal
  amplifier gain becomes

                                   æ G - 1 Pout         ö
                         G = Go expç -
                                   ç                    ÷.
                                                        ÷
                                   è   G PS             ø

· This expression shows how the amplifier gain decreases when Pout » Ps.


Output saturation power º the optical power at which G is reduced to Go/2 (3 dB)


                                  out    Go ln 2
                                Psat =           Ps .
                                         Go - 2

· Typically Go =1000 (30 dB),


                             s
                          Pout » (ln 2) Ps » 0.69 Ps .


                                         13
Amplifier Noise:
· Spontaneous emission in the amplifier will degrade the SNR by adding to the
  noise during the amplification process.

· SNR degradation is quantified through the amplifier noise figure Fn

                                               (SNR )in
                                     Fn =
                                              (SNR )out
where the SNR is based on the electrical power after converting the optical signal
to an electrical current. Therefore Fn is referenced to the detection process and
depends on parameters such as detector bandwidth (Be) and thermal and shot noise.

· Consider a simple case with an ideal detector with performance limited by shot
  noise.

· The amplifier has an amplification factor G (Pout = G Pin).

· SNR of the input signal:

                                             (RPin )2
                                     2
                                 I                             Pin
                      SNRin =            =                =         ,
                                s s2       2q( RPin )Be       2hnBe

                                s s2 = 2q (RPin )Be .

· The spontaneous emission contribution is amplified along with the signal. The
  Spectral density of the spontaneous emission induced noise is nearly constant
  (white noise) and can be expressed as:
                              S sp (n ) = (G - 1)n sp hn

· Spontaneous emission population inversion factor nsp is given by:

                                            N2
                                     n sp =       .
                                         N 2 - N1
N2 and N1 are the population densities for the excited and ground states of the
amplifying medium.


                                              14
· Alternatively can express the spontaneous emission power within the receiver
  bandwidth Be as:
                                    Psp = 2 S sp Be

· Spontaneous emission adds fluctuations to the amplified power and is converted
  to current fluctuations at the detector output.

· Major contribution to receiver noise results from coherent interference (beating)
  between the spontaneous emission with the signal. This results in a noise
  current given by
                            DI = 2 R(GPin Psp )1/ 2 cos q

· The variance in the photocurrent after the signal is passed through the amplifier
  is
                           s 2 » 4( RGPin ) × (RS sp )Be

where cos2 q is replaced with its average value of ½. (Note that this relation
assumes several idealizations on the detection process i.e. other noise sources are
negligible.)

· The SNR of the amplified signal becomes

                                     (RGPin )2         GPin
                          SNRout =               »
                                         s2           4 S sp Be

and the amplifier noise figure is

                           Fn = 2n sp (G - 1) / G » 2n sp .

· For most amplifiers Fn > 3 dB and can be 6-8 dB.


                                          15
· Characteristic plot of gain and noise figure for an erbium doped fiber
  amplifier pumped ~30 mW at 980 nm.


                40                                                         40


                30                                                         30
 Noise Figure


                                                                                Gain (dB)
                20                                                         20


                10                                                         10


                 0                                                          0
                     1510     1520                1530          1540

                             Wavelength (nm)


                                     16
EDFA Gain Equalization


             10

                                            Unflattened
                                            EDFA Gain
 Loss/Gain
 (dB/m)


             5
                                        Flattened
                                        EDFA Gain


             0
                         1.51      1.53        1.55        1.56
                            Wavelength (um)


· Gain equalization can be accomplished in several ways:
        a. Thin film filters
        b. Long period fiber gratings
        c. Chirped fiber Bragg gratings


                                   17
Raman Scattering, Stimulated Raman Scattering, and Raman Amplifiers:

  · Raman scattering is an elastic scattering mechanism. Does not require a
    population inversion.

  · A photon with energy hn1 traveling through a material can excite a
    vibrational transition of the material forming an optical phonon with energy
    hnp and a photon with slightly reduced energy hn2 given by

                                 n 2 = n1 -n p
                 Energy


                                                   hn
                                                     2
                                hn1


                                                   hnp


     · Molecule is raised to a new vibrational state and the energy of the photon
       is reduced.

     · There is a large difference between the photon and phonon energies.

     · Raman scattering is weak effect. It occurs through a slight modulation of
       the refractive index through molecular vibrations of the material.

     · Can derive the effect through a discussion of polarizability of a material.


                                       18
· The electric field induces a dipole moment of the molecule


                                          p = qx
or
                                         p =aE
        where a is the complex polarizability of the molecule.


                                           x
                                               o

                      +q                                        -q

                                            E

     · The bulk polarizability of a material is expressed as

                                         P = eo c ( ) E
                                                    1


     with c (1) the linear susceptibility of the material.


     · Response of a to an incident harmonic electric field:

                                                    ¶a
                                  a ( x ) = ao +               dx
                                                    ¶x    xo
        dx is the displacement from the equilibrium molecular length xo


                                   d x ( t ) = d xo e
                                                         ± jw p t


                                               19
p(t ) = a (t ) E (t )
                                           æ     ¶a                             ± jw p t   ö     jw t
                                         = çao +                 d xo e                    ÷ Eo e 1
                                          ç
                                           è     ¶x         xo
                                                                                           ÷
                                                                                           ø
                                                                 ¶a                             (        )
                                                                                               j w1 ±w p t
                                         = a o Eo e jw1t +                      d xo Eo e
                                                                 ¶x        xo


         · There are two frequency components: a) w1 ; b) w1 ± w p

         · The second component is nonlinear ® the output frequency is different
           from the input frequency.

                      Stokes                                                                        Anti-Stokes
Energy


                                                                  Energy


                                   hn2
                hn1                                                                                     hn1       hn
                                                                                                                   2


                                   hnp                                                                  hnp


         · Scattered light with lower energy (n 2 < n 1 ) ® Stokes Scattering.

         · Scattered light with higher energy (n 2 > n 1 ) ® Anti-Stokes Scattering.

         · Stokes scattering typically dominates due to greater population of the ground
           state relative to the vibrational state when the system is in thermal
           equilibrium.

         · At low illumination levels the Raman process results in low scattering levels.

         · The molecules contributing to the process are vibrating independently and
           the scattered light is non-directional. Spontaneous Raman Scattering.


                                                       20
· At higher intensity levels the generated photons begin to act in phase or
  coherently – i.e. the molecules oscillate as an array of vibrating oscillators.
  This gives rise to Stimulated Raman Scattering (SRS).

· SRS can be can be a problem but it can also be used as a signal amplification
  process.

· On the negative side it contributes to dispersion and places an operational
  limit on the amount of power that can be transmitted through a fiber.

· The Stokes wave is amplified as it propagates through the medium


                                      dI 2
                                           = Gr I 2 I1
                                      dz

I2 is the intensity of the Stokes shifted light (w s = w1 - wvib ) ; I1 is the intensity
of the pump beam (w1); and Gr is the Raman gain term that includes material
factors such as ¶a / ¶x and varies as 1/l2.

   · For I2 <<I1 and cases where the pump beam is not significantly depleted:

                             I 2 ( z ) = I 2 ( 0 ) eGr ×I1× z


                                           21
Properties of Raman Amplifiers:

     · The peak resonance in silica fibers occurs about 13 THz from the pump
       wavelength. At 1550 nm this corresponds to a shift of about 100 nm.
           Raman Gain Coefficient


                                                     l p = 1550 nm


                                    0   13                  24
                                         Frequency Shift (THz)

     · As indicated power is transferred from shorter wavelengths to longer
       wavelengths.

     · Coupling with the pump wavelength can be accomplished either in the
       forward or counter propagating direction.

     · Power is coupled from the pump only if the signal channel is sending a 1
       bit.


                                              22
Pump Arrangement to Extend the Range for Stimulated Raman Amplification:

  · An array of laser diodes can be used to provide the Raman pump. The beams
    are combined and then coupled to the transmission fiber. The pump beams
    can counter propagate to the direction of the signal beams.


                                    14xx/1550 nm
 Transmission Fiber                 WDM Coupler


    Raman Pump
    Block                     1430 nm
                              1450 nm
          Laser                                        14xx nm
          Diode               1470 nm
          Array               1490 nm              Combiner


                                     23
Difficulties with Raman Amplifiers:

      · The Pump and amplified signals are at different wavelengths. Therefore
        the signal and the pump pulses will separate due to dispersion
        (waveguide dispersion) after a certain propagation distance. The
        difference in propagation time is given by:

                         d t = ( L / c ) l 2 d 2 n / d l 2 (d n / n )
                                   L is the fiber length.

      · A 1 psec pump pulse at 600 nm separates from a 1 psec Stokes pulse in ~
        30 cm.
      · A second problem is that the pump power decreases along the fiber
        length due to linear absorption and scattering – Raman gain is greater at
        the input end.
      · A final problem results from amplifying spontaneous Raman photons.
        This occurs when the pump power is increased to offset attenuation
        losses and spontaneous Raman photons are coupled into the guided mode
        all along the length of the fiber. This increases noise.
      · Upper limit on the power into a communications signal from SRS
        amplification can be defined as the point at which the Stokes power Pr
        equals the signal power Psig.

                                                 2
                                          16p wo
                                       P=
                                          Gr Leff
                                             1 - e -a L
                                    Leff   =
                                                a
      Example:
         l p = 1.55m m
         wo » 5m m ® Amod e » 80 m m2
      a linear » 0.2dB / km ® Leff » 20km ® 700 mW
         Gr = 9 ´10-12 m / W

QUITE LARGE compared to normal optical signal powers (~1 mW).


                                           24

More Related Content

What's hot

OPTICAL COMMUNICATION Unit 4
OPTICAL COMMUNICATION Unit 4OPTICAL COMMUNICATION Unit 4
OPTICAL COMMUNICATION Unit 4
Asif Iqbal
 
Gain and noise figure analysis of erbium doped fiber amplifiers
Gain and noise figure analysis of erbium doped fiber amplifiersGain and noise figure analysis of erbium doped fiber amplifiers
Gain and noise figure analysis of erbium doped fiber amplifiers
eSAT Journals
 
50W single-mode linearly polarized high peak power pulsed fiber laser
50W single-mode linearly polarized high peak power pulsed fiber laser50W single-mode linearly polarized high peak power pulsed fiber laser
50W single-mode linearly polarized high peak power pulsed fiber laser
nufchas
 
Fiber optic receiver
Fiber optic receiverFiber optic receiver
Fiber optic receiver
Gunasekara Reddy
 
170007
170007170007
170007
adithya401
 
Digital transmission systems
Digital transmission systemsDigital transmission systems
Digital transmission systems
CKSunith1
 
PhoXtal APOC 2008 Presentation 081029
PhoXtal APOC 2008 Presentation 081029PhoXtal APOC 2008 Presentation 081029
PhoXtal APOC 2008 Presentation 081029
CSilfvenius
 
Wcdma p&amp;o-c-en-antenna model selection-4-60
Wcdma p&amp;o-c-en-antenna model selection-4-60Wcdma p&amp;o-c-en-antenna model selection-4-60
Wcdma p&amp;o-c-en-antenna model selection-4-60
Jose Asuncion Silva Vasquez
 
IRJET- The Jupiter Receiver
IRJET- The Jupiter ReceiverIRJET- The Jupiter Receiver
IRJET- The Jupiter Receiver
IRJET Journal
 
EASA PART-66 MODULE 5.11 : ELECTRONIC DISPLAYS
EASA PART-66 MODULE 5.11 : ELECTRONIC DISPLAYSEASA PART-66 MODULE 5.11 : ELECTRONIC DISPLAYS
EASA PART-66 MODULE 5.11 : ELECTRONIC DISPLAYS
soulstalker
 
Light sources based on optical-scale accelerators
Light sources based on optical-scale acceleratorsLight sources based on optical-scale accelerators
Light sources based on optical-scale accelerators
Gil Travish
 
Project 10
Project 10Project 10
Mk2420552059
Mk2420552059Mk2420552059
Mk2420552059
IJERA Editor
 
Kr3419301933
Kr3419301933Kr3419301933
Kr3419301933
IJERA Editor
 
Photodetection and photodetectors
Photodetection and photodetectorsPhotodetection and photodetectors
Photodetection and photodetectorswtyru1989
 
Research Inventy : International Journal of Engineering and Science
Research Inventy : International Journal of Engineering and ScienceResearch Inventy : International Journal of Engineering and Science
Research Inventy : International Journal of Engineering and Scienceresearchinventy
 
F05712333
F05712333F05712333
F05712333
IOSR-JEN
 

What's hot (20)

OPTICAL COMMUNICATION Unit 4
OPTICAL COMMUNICATION Unit 4OPTICAL COMMUNICATION Unit 4
OPTICAL COMMUNICATION Unit 4
 
Gain and noise figure analysis of erbium doped fiber amplifiers
Gain and noise figure analysis of erbium doped fiber amplifiersGain and noise figure analysis of erbium doped fiber amplifiers
Gain and noise figure analysis of erbium doped fiber amplifiers
 
Antennas
AntennasAntennas
Antennas
 
Caballero
CaballeroCaballero
Caballero
 
50W single-mode linearly polarized high peak power pulsed fiber laser
50W single-mode linearly polarized high peak power pulsed fiber laser50W single-mode linearly polarized high peak power pulsed fiber laser
50W single-mode linearly polarized high peak power pulsed fiber laser
 
Fiber optic receiver
Fiber optic receiverFiber optic receiver
Fiber optic receiver
 
170007
170007170007
170007
 
Digital transmission systems
Digital transmission systemsDigital transmission systems
Digital transmission systems
 
PhoXtal APOC 2008 Presentation 081029
PhoXtal APOC 2008 Presentation 081029PhoXtal APOC 2008 Presentation 081029
PhoXtal APOC 2008 Presentation 081029
 
Ijetcas14 425
Ijetcas14 425Ijetcas14 425
Ijetcas14 425
 
Wcdma p&amp;o-c-en-antenna model selection-4-60
Wcdma p&amp;o-c-en-antenna model selection-4-60Wcdma p&amp;o-c-en-antenna model selection-4-60
Wcdma p&amp;o-c-en-antenna model selection-4-60
 
IRJET- The Jupiter Receiver
IRJET- The Jupiter ReceiverIRJET- The Jupiter Receiver
IRJET- The Jupiter Receiver
 
EASA PART-66 MODULE 5.11 : ELECTRONIC DISPLAYS
EASA PART-66 MODULE 5.11 : ELECTRONIC DISPLAYSEASA PART-66 MODULE 5.11 : ELECTRONIC DISPLAYS
EASA PART-66 MODULE 5.11 : ELECTRONIC DISPLAYS
 
Light sources based on optical-scale accelerators
Light sources based on optical-scale acceleratorsLight sources based on optical-scale accelerators
Light sources based on optical-scale accelerators
 
Project 10
Project 10Project 10
Project 10
 
Mk2420552059
Mk2420552059Mk2420552059
Mk2420552059
 
Kr3419301933
Kr3419301933Kr3419301933
Kr3419301933
 
Photodetection and photodetectors
Photodetection and photodetectorsPhotodetection and photodetectors
Photodetection and photodetectors
 
Research Inventy : International Journal of Engineering and Science
Research Inventy : International Journal of Engineering and ScienceResearch Inventy : International Journal of Engineering and Science
Research Inventy : International Journal of Engineering and Science
 
F05712333
F05712333F05712333
F05712333
 

Similar to Opamp1

Comparison among fiber amplifiers
Comparison among fiber amplifiersComparison among fiber amplifiers
Comparison among fiber amplifiersSaimunur Rahman
 
Optical amplifiers- review
Optical amplifiers- reviewOptical amplifiers- review
Optical amplifiers- review
Sham Arsenal
 
EDFA amplifier ppt
EDFA amplifier pptEDFA amplifier ppt
EDFA amplifier ppt
SachinMaithani1
 
Optical amplifier
Optical amplifierOptical amplifier
Optical amplifierchnru
 
Optical amplifiers
Optical amplifiersOptical amplifiers
Optical amplifiers
Minh Tiệp HP
 
Erbium doped fiber amplifiers
Erbium doped fiber amplifiersErbium doped fiber amplifiers
Erbium doped fiber amplifiers
CKSunith1
 
Optical amplifiers
Optical amplifiersOptical amplifiers
Optical amplifiers
Tafhim Bin Nasir
 
Optical amplification
Optical amplificationOptical amplification
Optical amplification
CKSunith1
 
Mj2420512054
Mj2420512054Mj2420512054
Mj2420512054
IJERA Editor
 
Introduction to optical amplifiers
Introduction to optical amplifiersIntroduction to optical amplifiers
Introduction to optical amplifiers
Vanessa Shen
 
EDFA OPTIMIZING THE EDFA GAIN FOR WDM
EDFA OPTIMIZING THE EDFA GAIN FOR WDMEDFA OPTIMIZING THE EDFA GAIN FOR WDM
EDFA OPTIMIZING THE EDFA GAIN FOR WDM
ADITYA KHATOKAR J
 
IRJET- Regeneration Analysis using Erbium Doped Fiber Amplifier
IRJET- Regeneration Analysis using Erbium Doped Fiber AmplifierIRJET- Regeneration Analysis using Erbium Doped Fiber Amplifier
IRJET- Regeneration Analysis using Erbium Doped Fiber Amplifier
IRJET Journal
 
Optical Amplifier and Networks
Optical Amplifier and NetworksOptical Amplifier and Networks
Optical Amplifier and Networks
Jagadish M
 
lec 5 Master.pptx
lec 5 Master.pptxlec 5 Master.pptx
lec 5 Master.pptx
mohanadalmothafar
 
In-Depth Understanding of EDFA
In-Depth Understanding of EDFAIn-Depth Understanding of EDFA
In-Depth Understanding of EDFA
Sun Telecom
 
performance analysis of hg edfa and ln eycdfa
performance analysis of hg edfa and ln eycdfa performance analysis of hg edfa and ln eycdfa
performance analysis of hg edfa and ln eycdfa
INFOGAIN PUBLICATION
 
optical transmitter
optical transmitteroptical transmitter
optical transmitter
@zenafaris91
 
Experimental study on a broadband erbium
Experimental study on a broadband erbiumExperimental study on a broadband erbium
Experimental study on a broadband erbium
Naku Technology Co,. Ltd
 
Opticl CoM 6.pptx
Opticl CoM 6.pptxOpticl CoM 6.pptx
Opticl CoM 6.pptx
ChinnuJose3
 
Fibre amplifiers
Fibre amplifiersFibre amplifiers
Fibre amplifiers
ShenbagarajanG
 

Similar to Opamp1 (20)

Comparison among fiber amplifiers
Comparison among fiber amplifiersComparison among fiber amplifiers
Comparison among fiber amplifiers
 
Optical amplifiers- review
Optical amplifiers- reviewOptical amplifiers- review
Optical amplifiers- review
 
EDFA amplifier ppt
EDFA amplifier pptEDFA amplifier ppt
EDFA amplifier ppt
 
Optical amplifier
Optical amplifierOptical amplifier
Optical amplifier
 
Optical amplifiers
Optical amplifiersOptical amplifiers
Optical amplifiers
 
Erbium doped fiber amplifiers
Erbium doped fiber amplifiersErbium doped fiber amplifiers
Erbium doped fiber amplifiers
 
Optical amplifiers
Optical amplifiersOptical amplifiers
Optical amplifiers
 
Optical amplification
Optical amplificationOptical amplification
Optical amplification
 
Mj2420512054
Mj2420512054Mj2420512054
Mj2420512054
 
Introduction to optical amplifiers
Introduction to optical amplifiersIntroduction to optical amplifiers
Introduction to optical amplifiers
 
EDFA OPTIMIZING THE EDFA GAIN FOR WDM
EDFA OPTIMIZING THE EDFA GAIN FOR WDMEDFA OPTIMIZING THE EDFA GAIN FOR WDM
EDFA OPTIMIZING THE EDFA GAIN FOR WDM
 
IRJET- Regeneration Analysis using Erbium Doped Fiber Amplifier
IRJET- Regeneration Analysis using Erbium Doped Fiber AmplifierIRJET- Regeneration Analysis using Erbium Doped Fiber Amplifier
IRJET- Regeneration Analysis using Erbium Doped Fiber Amplifier
 
Optical Amplifier and Networks
Optical Amplifier and NetworksOptical Amplifier and Networks
Optical Amplifier and Networks
 
lec 5 Master.pptx
lec 5 Master.pptxlec 5 Master.pptx
lec 5 Master.pptx
 
In-Depth Understanding of EDFA
In-Depth Understanding of EDFAIn-Depth Understanding of EDFA
In-Depth Understanding of EDFA
 
performance analysis of hg edfa and ln eycdfa
performance analysis of hg edfa and ln eycdfa performance analysis of hg edfa and ln eycdfa
performance analysis of hg edfa and ln eycdfa
 
optical transmitter
optical transmitteroptical transmitter
optical transmitter
 
Experimental study on a broadband erbium
Experimental study on a broadband erbiumExperimental study on a broadband erbium
Experimental study on a broadband erbium
 
Opticl CoM 6.pptx
Opticl CoM 6.pptxOpticl CoM 6.pptx
Opticl CoM 6.pptx
 
Fibre amplifiers
Fibre amplifiersFibre amplifiers
Fibre amplifiers
 

Recently uploaded

CLASS 11 CBSE B.St Project AIDS TO TRADE - INSURANCE
CLASS 11 CBSE B.St Project AIDS TO TRADE - INSURANCECLASS 11 CBSE B.St Project AIDS TO TRADE - INSURANCE
CLASS 11 CBSE B.St Project AIDS TO TRADE - INSURANCE
BhavyaRajput3
 
Model Attribute Check Company Auto Property
Model Attribute  Check Company Auto PropertyModel Attribute  Check Company Auto Property
Model Attribute Check Company Auto Property
Celine George
 
Acetabularia Information For Class 9 .docx
Acetabularia Information For Class 9  .docxAcetabularia Information For Class 9  .docx
Acetabularia Information For Class 9 .docx
vaibhavrinwa19
 
Unit 2- Research Aptitude (UGC NET Paper I).pdf
Unit 2- Research Aptitude (UGC NET Paper I).pdfUnit 2- Research Aptitude (UGC NET Paper I).pdf
Unit 2- Research Aptitude (UGC NET Paper I).pdf
Thiyagu K
 
June 3, 2024 Anti-Semitism Letter Sent to MIT President Kornbluth and MIT Cor...
June 3, 2024 Anti-Semitism Letter Sent to MIT President Kornbluth and MIT Cor...June 3, 2024 Anti-Semitism Letter Sent to MIT President Kornbluth and MIT Cor...
June 3, 2024 Anti-Semitism Letter Sent to MIT President Kornbluth and MIT Cor...
Levi Shapiro
 
Unit 8 - Information and Communication Technology (Paper I).pdf
Unit 8 - Information and Communication Technology (Paper I).pdfUnit 8 - Information and Communication Technology (Paper I).pdf
Unit 8 - Information and Communication Technology (Paper I).pdf
Thiyagu K
 
Sha'Carri Richardson Presentation 202345
Sha'Carri Richardson Presentation 202345Sha'Carri Richardson Presentation 202345
Sha'Carri Richardson Presentation 202345
beazzy04
 
1.4 modern child centered education - mahatma gandhi-2.pptx
1.4 modern child centered education - mahatma gandhi-2.pptx1.4 modern child centered education - mahatma gandhi-2.pptx
1.4 modern child centered education - mahatma gandhi-2.pptx
JosvitaDsouza2
 
Instructions for Submissions thorugh G- Classroom.pptx
Instructions for Submissions thorugh G- Classroom.pptxInstructions for Submissions thorugh G- Classroom.pptx
Instructions for Submissions thorugh G- Classroom.pptx
Jheel Barad
 
The Challenger.pdf DNHS Official Publication
The Challenger.pdf DNHS Official PublicationThe Challenger.pdf DNHS Official Publication
The Challenger.pdf DNHS Official Publication
Delapenabediema
 
The Accursed House by Émile Gaboriau.pptx
The Accursed House by Émile Gaboriau.pptxThe Accursed House by Émile Gaboriau.pptx
The Accursed House by Émile Gaboriau.pptx
DhatriParmar
 
Guidance_and_Counselling.pdf B.Ed. 4th Semester
Guidance_and_Counselling.pdf B.Ed. 4th SemesterGuidance_and_Counselling.pdf B.Ed. 4th Semester
Guidance_and_Counselling.pdf B.Ed. 4th Semester
Atul Kumar Singh
 
Additional Benefits for Employee Website.pdf
Additional Benefits for Employee Website.pdfAdditional Benefits for Employee Website.pdf
Additional Benefits for Employee Website.pdf
joachimlavalley1
 
Honest Reviews of Tim Han LMA Course Program.pptx
Honest Reviews of Tim Han LMA Course Program.pptxHonest Reviews of Tim Han LMA Course Program.pptx
Honest Reviews of Tim Han LMA Course Program.pptx
timhan337
 
678020731-Sumas-y-Restas-Para-Colorear.pdf
678020731-Sumas-y-Restas-Para-Colorear.pdf678020731-Sumas-y-Restas-Para-Colorear.pdf
678020731-Sumas-y-Restas-Para-Colorear.pdf
CarlosHernanMontoyab2
 
CACJapan - GROUP Presentation 1- Wk 4.pdf
CACJapan - GROUP Presentation 1- Wk 4.pdfCACJapan - GROUP Presentation 1- Wk 4.pdf
CACJapan - GROUP Presentation 1- Wk 4.pdf
camakaiclarkmusic
 
Lapbook sobre os Regimes Totalitários.pdf
Lapbook sobre os Regimes Totalitários.pdfLapbook sobre os Regimes Totalitários.pdf
Lapbook sobre os Regimes Totalitários.pdf
Jean Carlos Nunes Paixão
 
2024.06.01 Introducing a competency framework for languag learning materials ...
2024.06.01 Introducing a competency framework for languag learning materials ...2024.06.01 Introducing a competency framework for languag learning materials ...
2024.06.01 Introducing a competency framework for languag learning materials ...
Sandy Millin
 
Language Across the Curriculm LAC B.Ed.
Language Across the  Curriculm LAC B.Ed.Language Across the  Curriculm LAC B.Ed.
Language Across the Curriculm LAC B.Ed.
Atul Kumar Singh
 
The basics of sentences session 5pptx.pptx
The basics of sentences session 5pptx.pptxThe basics of sentences session 5pptx.pptx
The basics of sentences session 5pptx.pptx
heathfieldcps1
 

Recently uploaded (20)

CLASS 11 CBSE B.St Project AIDS TO TRADE - INSURANCE
CLASS 11 CBSE B.St Project AIDS TO TRADE - INSURANCECLASS 11 CBSE B.St Project AIDS TO TRADE - INSURANCE
CLASS 11 CBSE B.St Project AIDS TO TRADE - INSURANCE
 
Model Attribute Check Company Auto Property
Model Attribute  Check Company Auto PropertyModel Attribute  Check Company Auto Property
Model Attribute Check Company Auto Property
 
Acetabularia Information For Class 9 .docx
Acetabularia Information For Class 9  .docxAcetabularia Information For Class 9  .docx
Acetabularia Information For Class 9 .docx
 
Unit 2- Research Aptitude (UGC NET Paper I).pdf
Unit 2- Research Aptitude (UGC NET Paper I).pdfUnit 2- Research Aptitude (UGC NET Paper I).pdf
Unit 2- Research Aptitude (UGC NET Paper I).pdf
 
June 3, 2024 Anti-Semitism Letter Sent to MIT President Kornbluth and MIT Cor...
June 3, 2024 Anti-Semitism Letter Sent to MIT President Kornbluth and MIT Cor...June 3, 2024 Anti-Semitism Letter Sent to MIT President Kornbluth and MIT Cor...
June 3, 2024 Anti-Semitism Letter Sent to MIT President Kornbluth and MIT Cor...
 
Unit 8 - Information and Communication Technology (Paper I).pdf
Unit 8 - Information and Communication Technology (Paper I).pdfUnit 8 - Information and Communication Technology (Paper I).pdf
Unit 8 - Information and Communication Technology (Paper I).pdf
 
Sha'Carri Richardson Presentation 202345
Sha'Carri Richardson Presentation 202345Sha'Carri Richardson Presentation 202345
Sha'Carri Richardson Presentation 202345
 
1.4 modern child centered education - mahatma gandhi-2.pptx
1.4 modern child centered education - mahatma gandhi-2.pptx1.4 modern child centered education - mahatma gandhi-2.pptx
1.4 modern child centered education - mahatma gandhi-2.pptx
 
Instructions for Submissions thorugh G- Classroom.pptx
Instructions for Submissions thorugh G- Classroom.pptxInstructions for Submissions thorugh G- Classroom.pptx
Instructions for Submissions thorugh G- Classroom.pptx
 
The Challenger.pdf DNHS Official Publication
The Challenger.pdf DNHS Official PublicationThe Challenger.pdf DNHS Official Publication
The Challenger.pdf DNHS Official Publication
 
The Accursed House by Émile Gaboriau.pptx
The Accursed House by Émile Gaboriau.pptxThe Accursed House by Émile Gaboriau.pptx
The Accursed House by Émile Gaboriau.pptx
 
Guidance_and_Counselling.pdf B.Ed. 4th Semester
Guidance_and_Counselling.pdf B.Ed. 4th SemesterGuidance_and_Counselling.pdf B.Ed. 4th Semester
Guidance_and_Counselling.pdf B.Ed. 4th Semester
 
Additional Benefits for Employee Website.pdf
Additional Benefits for Employee Website.pdfAdditional Benefits for Employee Website.pdf
Additional Benefits for Employee Website.pdf
 
Honest Reviews of Tim Han LMA Course Program.pptx
Honest Reviews of Tim Han LMA Course Program.pptxHonest Reviews of Tim Han LMA Course Program.pptx
Honest Reviews of Tim Han LMA Course Program.pptx
 
678020731-Sumas-y-Restas-Para-Colorear.pdf
678020731-Sumas-y-Restas-Para-Colorear.pdf678020731-Sumas-y-Restas-Para-Colorear.pdf
678020731-Sumas-y-Restas-Para-Colorear.pdf
 
CACJapan - GROUP Presentation 1- Wk 4.pdf
CACJapan - GROUP Presentation 1- Wk 4.pdfCACJapan - GROUP Presentation 1- Wk 4.pdf
CACJapan - GROUP Presentation 1- Wk 4.pdf
 
Lapbook sobre os Regimes Totalitários.pdf
Lapbook sobre os Regimes Totalitários.pdfLapbook sobre os Regimes Totalitários.pdf
Lapbook sobre os Regimes Totalitários.pdf
 
2024.06.01 Introducing a competency framework for languag learning materials ...
2024.06.01 Introducing a competency framework for languag learning materials ...2024.06.01 Introducing a competency framework for languag learning materials ...
2024.06.01 Introducing a competency framework for languag learning materials ...
 
Language Across the Curriculm LAC B.Ed.
Language Across the  Curriculm LAC B.Ed.Language Across the  Curriculm LAC B.Ed.
Language Across the Curriculm LAC B.Ed.
 
The basics of sentences session 5pptx.pptx
The basics of sentences session 5pptx.pptxThe basics of sentences session 5pptx.pptx
The basics of sentences session 5pptx.pptx
 

Opamp1

  • 1. SECTION 5: OPTICAL AMPLIFIERS 1
  • 2. OPTICAL AMPLIFIERS · In order to transmit signals over long distances (>100 km) it is necessary to compensate for attenuation losses within the fiber. · Initially this was accomplished with an optoelectronic module consisting of an optical receiver, a regeneration and equalization system, and an optical transmitter to send the data. · Although functional this arrangement is limited by the optical to electrical and electrical to optical conversions. Fiber Fiber OE OE Rx Tx Electronic Amp Optical Equalization Signal Optical Regeneration Out Signal In · Several types of optical amplifiers have since been demonstrated to replace the OE – electronic regeneration systems. · These systems eliminate the need for E-O and O-E conversions. · This is one of the main reasons for the success of today’s optical communications systems. 2
  • 3. OPTICAL AMPLIFIERS The general form of an optical amplifier: PUMP Power Amplified Fiber Weak Signal Fiber Signal Optical AMP Medium Optical Signal Optical Out Signal In Some types of OAs that have been demonstrated include: · Semiconductor optical amplifiers (SOAs) · Fiber Raman and Brillouin amplifiers · Rare earth doped fiber amplifiers (erbium – EDFA 1500 nm, praseodymium – PDFA 1300 nm) The most practical optical amplifiers to date include the SOA and EDFA types. New pumping methods and materials are also improving the performance of Raman amplifiers. 3
  • 4. Characteristics of SOA types: · Polarization dependent – require polarization maintaining fiber · Relatively high gain ~20 dB · Output saturation power 5-10 dBm · Large BW · Can operate at 800, 1300, and 1500 nm wavelength regions. · Compact and easily integrated with other devices · Can be integrated into arrays · High noise figure and cross-talk levels due to nonlinear phenomenon such as 4- wave mixing. This last feature restricts the use of SOAs. · Semiconductor Optical Amplifier (SOA) – similar to a laser cavity. Used as a discrete amplifiers. They can be integrated into arrays of amplifying switching and gating devices. Finding application in all optical 3R- regeneration systems. Electrical Drive Current AR AR Weak Optical Amplified Optical Signal In Signal Semiconductor Cavity · Limited in operation below 10 Gb/s. (Higher rates are possible with lower gain.) 4
  • 5. Rare Earth Doped Fiber Amplifier Characteristics: Rare earth doped fiber amplifiers are finding increasing importance in optical communications systems. Perhaps the most important version is erbium doped fiber amplifiers (EDFAs) due to their ability to amplify signals at the low loss 1.55 mm wavelength range. Characteristics of EDFAs (advantages): · High power transfer efficiency from pump to signal power (> 50%). · Wide spectral band amplification with relative flat gain (>20 dB) – useful for WDM applications. · Saturation output > 1 mW (10 to 25 dBm). · Gain-time constant long (>100 msec) to overcome patterning effects and inter- modulation distortions ( low noise). · Large dynamic range. · Low noise figure. · Polarization independent. · Suitable for long-haul applications. Disadvantages of EDFAs: · Relatively large devices (km lengths of fiber) – not easily integrated with other devices. · ASE – amplified spontaneous emission. There is always some output even with no signal input due to some excitation of ions in the fiber – spontaneous noise. · Cross-talk effects. · Gain saturation effects. 5
  • 6. · An energy level diagram for Er doped silica is shown below. 4I (11/2) 0.98 um 4I (13/2) 1.53 um Pump 1.48 um Bands Emission Wavelengths 4I (15/2) · Pumping is primarily done optically with the primary pump wavelengths at 1.48 mm and 0.98 mm. As indicated atoms pumped to the 4I (11/2) 0.98 mm band decays to the primary emission transition band. Pumping with 1.48 mm light is directly to the upper transition levels of the emission band. · Semiconductor lasers have been developed for both pump wavelengths. · 10-20 mW of absorbed pump power at these wavelengths can produce 30-40 dB of amplifier gain. · Pump Efficiencies of 11 dB/mW achieved at 980 nm. · Pumping can also be performed at 820 and 670 nm with GaAlAs laser diodes. Pump efficiencies are lower but these lasers can be made with high output power. 6
  • 7. Typical Absorption/Gain Spectrum for Erbium Doped Fiber: 10 6 (X 10^(-25)m^2) Cross Section Loss/Gain (dB/m) Absorption 4 5 2 Gain 0 1.51 1.53 1.55 Wavelength (um) · Since the gain spectrum of erbium resembles a 3-level atom it is possible to model the gain properties using this approach. · Several different wavelength bands have been designated for wavelength division multiplexing and EDFAs have been designed to operate in these bands. · The divisions have been designated as*: S-Band 1480-1520 nm C-Band 1521-1560 nm L-Band 1561-1620 nm (* Note some variability in these values is common.) 7
  • 8. General EDFA Amplifier Configuration: 980 or 1480 pump laser Amplified Output Isolator Signal EDFA Weak Input Signal Coupler Narrow Band Filter Basic Amplifier Characteristics Optical Gain · Rare earth doped optical amplifiers work much like a laser. · The primary difference is that they do not have a resonator. · Amplification occurs primarily through the stimulated emission process. · The medium is pumped until a population inversion state is achieved. Pump powers are typically several 20-250 mW. An isolator is used to reduce reflections at the input to the amplifier. A narrow band optical filter is used to reduce transmission of amplified spontaneous emission frequency components. · The resultant optical gain depends both on the optical frequency and the local beam intensity within the amplifier section. · For basic discussion consider a two-level homogeneously broadened medium. 8
  • 9. · The gain coefficient can be expressed as: go g (w ) = 1 + (w - w o ) 2 T22 + P / Ps , go is the peak gain, w is the optical frequency of the incident signal, wo is the transition frequency, P is the optical power of the incident signal, T2 is the dipole relaxation time, and Ps is the saturation power. · Typically T2 is small < 1 ps, and the saturation power Ps depends on gain medium parameters such as the fluorescence time and the transition cross section. 9
  • 10. _____________________________________________________________ Gain Spectrum and BW: · When not saturated (i.e. P/Ps <<1) the gain coefficient g(w) becomes: go g (w ) = . 1 + (w - w o ) 2 T22 · Gain is maximum when w = wo (i.e. the gain coefficient is at resonance). · At non-resonant frequencies the gain follows the homogeneously broadened characteristics of a two level atom (i.e. Lorentzian profile). · The gain BW for this spectrum is typically expressed as the (Full Width at Half Maximum) FWHM Dw g = 2 T2 . Dw g Dn g = 2p with T2 ; 0.1 ps Dn g ; 3THz · Large Spectral BW amplifiers are preferred for fiber optic systems to make them less sensitive to dispersed transmitted signals and useful for WDM systems. EDFA Gain Spectrum: · The gain spectrum of erbium ions alone is homogeneously broadened and the BW is determined by the dipole relaxation time T2. · However when placed in a glass host the spectrum is influenced both by the silica and any other dopants. This can result in inhomogeneous broadening contributions. · The combined homogeneous and inhomogeneous BW of EDFAs: ~ 30 nm. 10
  • 11. Amplification factor: · Define as: G = Pout/Pin Pout is the amplifier output power and Pin the input power of a CW input signal. Pump P N2 P in Gain out Medium N1 z=0 z=L · From the previous discussion of the laser the gain in optical power per length of gain medium (z) with gain g is dP = gP . dz · Integrating over a length z of amplifier medium gives the resultant optical power P( z ) = P(0) exp( gz ) . 11
  • 12. The amplification factor after a length L of OAM (optical amplifier medium) is G (w ) = exp[g (w ) L] Both g(w) and G(w) are a maximum when the frequency is at resonance w = w o and decrease when the frequency is detuned from resonance. However the amplifier factor(G) decreases much faster than the gain coefficient(g). · The amplifier BW DnA is defined as the FWHM of G(w) 0.5 æ ln 2 ö ç ln(G / 2) ÷ Dn A = Dn g ç ÷ è o ø where Dng is the gain BW, and Go = exp(goL). · The amplifier BW is smaller than the gain BW. The difference depends on the amplifier gain characteristics. If Go = 10, Dn A = 0.656 Dn g 12
  • 13. Gain Saturation: · Since g(w) depends on the incident optical power when P » PS, G will start to decrease with an increase in optical power P. · Assume that the incident frequency is tuned for peak gain (w = wo) dP go P = . dz 1 + P / Ps · With the conditions P(0) = Pinc and P(L) = Pout = GPinc the large signal amplifier gain becomes æ G - 1 Pout ö G = Go expç - ç ÷. ÷ è G PS ø · This expression shows how the amplifier gain decreases when Pout » Ps. Output saturation power º the optical power at which G is reduced to Go/2 (3 dB) out Go ln 2 Psat = Ps . Go - 2 · Typically Go =1000 (30 dB), s Pout » (ln 2) Ps » 0.69 Ps . 13
  • 14. Amplifier Noise: · Spontaneous emission in the amplifier will degrade the SNR by adding to the noise during the amplification process. · SNR degradation is quantified through the amplifier noise figure Fn (SNR )in Fn = (SNR )out where the SNR is based on the electrical power after converting the optical signal to an electrical current. Therefore Fn is referenced to the detection process and depends on parameters such as detector bandwidth (Be) and thermal and shot noise. · Consider a simple case with an ideal detector with performance limited by shot noise. · The amplifier has an amplification factor G (Pout = G Pin). · SNR of the input signal: (RPin )2 2 I Pin SNRin = = = , s s2 2q( RPin )Be 2hnBe s s2 = 2q (RPin )Be . · The spontaneous emission contribution is amplified along with the signal. The Spectral density of the spontaneous emission induced noise is nearly constant (white noise) and can be expressed as: S sp (n ) = (G - 1)n sp hn · Spontaneous emission population inversion factor nsp is given by: N2 n sp = . N 2 - N1 N2 and N1 are the population densities for the excited and ground states of the amplifying medium. 14
  • 15. · Alternatively can express the spontaneous emission power within the receiver bandwidth Be as: Psp = 2 S sp Be · Spontaneous emission adds fluctuations to the amplified power and is converted to current fluctuations at the detector output. · Major contribution to receiver noise results from coherent interference (beating) between the spontaneous emission with the signal. This results in a noise current given by DI = 2 R(GPin Psp )1/ 2 cos q · The variance in the photocurrent after the signal is passed through the amplifier is s 2 » 4( RGPin ) × (RS sp )Be where cos2 q is replaced with its average value of ½. (Note that this relation assumes several idealizations on the detection process i.e. other noise sources are negligible.) · The SNR of the amplified signal becomes (RGPin )2 GPin SNRout = » s2 4 S sp Be and the amplifier noise figure is Fn = 2n sp (G - 1) / G » 2n sp . · For most amplifiers Fn > 3 dB and can be 6-8 dB. 15
  • 16. · Characteristic plot of gain and noise figure for an erbium doped fiber amplifier pumped ~30 mW at 980 nm. 40 40 30 30 Noise Figure Gain (dB) 20 20 10 10 0 0 1510 1520 1530 1540 Wavelength (nm) 16
  • 17. EDFA Gain Equalization 10 Unflattened EDFA Gain Loss/Gain (dB/m) 5 Flattened EDFA Gain 0 1.51 1.53 1.55 1.56 Wavelength (um) · Gain equalization can be accomplished in several ways: a. Thin film filters b. Long period fiber gratings c. Chirped fiber Bragg gratings 17
  • 18. Raman Scattering, Stimulated Raman Scattering, and Raman Amplifiers: · Raman scattering is an elastic scattering mechanism. Does not require a population inversion. · A photon with energy hn1 traveling through a material can excite a vibrational transition of the material forming an optical phonon with energy hnp and a photon with slightly reduced energy hn2 given by n 2 = n1 -n p Energy hn 2 hn1 hnp · Molecule is raised to a new vibrational state and the energy of the photon is reduced. · There is a large difference between the photon and phonon energies. · Raman scattering is weak effect. It occurs through a slight modulation of the refractive index through molecular vibrations of the material. · Can derive the effect through a discussion of polarizability of a material. 18
  • 19. · The electric field induces a dipole moment of the molecule p = qx or p =aE where a is the complex polarizability of the molecule. x o +q -q E · The bulk polarizability of a material is expressed as P = eo c ( ) E 1 with c (1) the linear susceptibility of the material. · Response of a to an incident harmonic electric field: ¶a a ( x ) = ao + dx ¶x xo dx is the displacement from the equilibrium molecular length xo d x ( t ) = d xo e ± jw p t 19
  • 20. p(t ) = a (t ) E (t ) æ ¶a ± jw p t ö jw t = çao + d xo e ÷ Eo e 1 ç è ¶x xo ÷ ø ¶a ( ) j w1 ±w p t = a o Eo e jw1t + d xo Eo e ¶x xo · There are two frequency components: a) w1 ; b) w1 ± w p · The second component is nonlinear ® the output frequency is different from the input frequency. Stokes Anti-Stokes Energy Energy hn2 hn1 hn1 hn 2 hnp hnp · Scattered light with lower energy (n 2 < n 1 ) ® Stokes Scattering. · Scattered light with higher energy (n 2 > n 1 ) ® Anti-Stokes Scattering. · Stokes scattering typically dominates due to greater population of the ground state relative to the vibrational state when the system is in thermal equilibrium. · At low illumination levels the Raman process results in low scattering levels. · The molecules contributing to the process are vibrating independently and the scattered light is non-directional. Spontaneous Raman Scattering. 20
  • 21. · At higher intensity levels the generated photons begin to act in phase or coherently – i.e. the molecules oscillate as an array of vibrating oscillators. This gives rise to Stimulated Raman Scattering (SRS). · SRS can be can be a problem but it can also be used as a signal amplification process. · On the negative side it contributes to dispersion and places an operational limit on the amount of power that can be transmitted through a fiber. · The Stokes wave is amplified as it propagates through the medium dI 2 = Gr I 2 I1 dz I2 is the intensity of the Stokes shifted light (w s = w1 - wvib ) ; I1 is the intensity of the pump beam (w1); and Gr is the Raman gain term that includes material factors such as ¶a / ¶x and varies as 1/l2. · For I2 <<I1 and cases where the pump beam is not significantly depleted: I 2 ( z ) = I 2 ( 0 ) eGr ×I1× z 21
  • 22. Properties of Raman Amplifiers: · The peak resonance in silica fibers occurs about 13 THz from the pump wavelength. At 1550 nm this corresponds to a shift of about 100 nm. Raman Gain Coefficient l p = 1550 nm 0 13 24 Frequency Shift (THz) · As indicated power is transferred from shorter wavelengths to longer wavelengths. · Coupling with the pump wavelength can be accomplished either in the forward or counter propagating direction. · Power is coupled from the pump only if the signal channel is sending a 1 bit. 22
  • 23. Pump Arrangement to Extend the Range for Stimulated Raman Amplification: · An array of laser diodes can be used to provide the Raman pump. The beams are combined and then coupled to the transmission fiber. The pump beams can counter propagate to the direction of the signal beams. 14xx/1550 nm Transmission Fiber WDM Coupler Raman Pump Block 1430 nm 1450 nm Laser 14xx nm Diode 1470 nm Array 1490 nm Combiner 23
  • 24. Difficulties with Raman Amplifiers: · The Pump and amplified signals are at different wavelengths. Therefore the signal and the pump pulses will separate due to dispersion (waveguide dispersion) after a certain propagation distance. The difference in propagation time is given by: d t = ( L / c ) l 2 d 2 n / d l 2 (d n / n ) L is the fiber length. · A 1 psec pump pulse at 600 nm separates from a 1 psec Stokes pulse in ~ 30 cm. · A second problem is that the pump power decreases along the fiber length due to linear absorption and scattering – Raman gain is greater at the input end. · A final problem results from amplifying spontaneous Raman photons. This occurs when the pump power is increased to offset attenuation losses and spontaneous Raman photons are coupled into the guided mode all along the length of the fiber. This increases noise. · Upper limit on the power into a communications signal from SRS amplification can be defined as the point at which the Stokes power Pr equals the signal power Psig. 2 16p wo P= Gr Leff 1 - e -a L Leff = a Example: l p = 1.55m m wo » 5m m ® Amod e » 80 m m2 a linear » 0.2dB / km ® Leff » 20km ® 700 mW Gr = 9 ´10-12 m / W QUITE LARGE compared to normal optical signal powers (~1 mW). 24