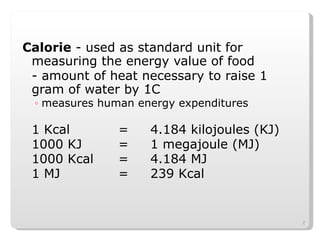
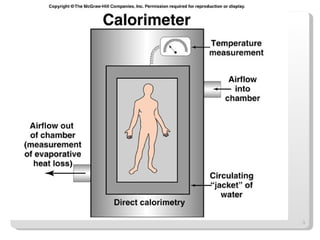
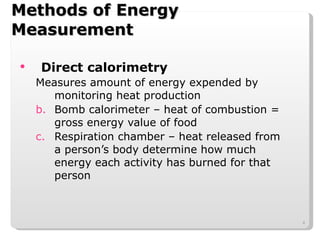
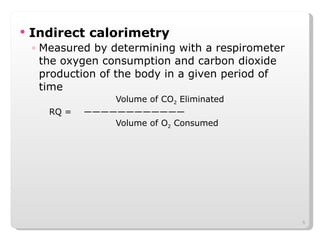
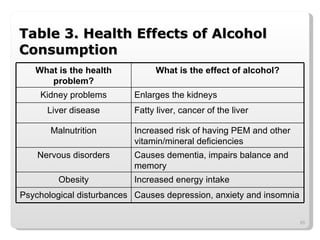
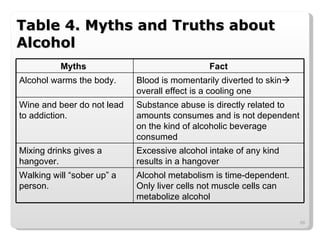
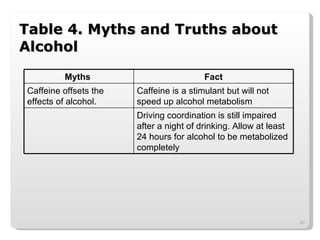
- Calorie is the standard unit used to measure the energy value of food and human energy expenditure. Various methods can be used to measure energy including direct calorimetry, indirect calorimetry, and determining respiratory exchange ratio.
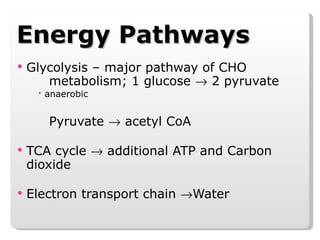
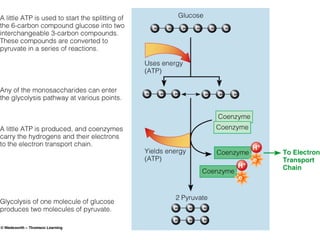
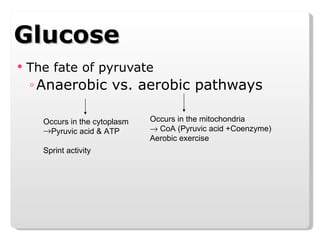
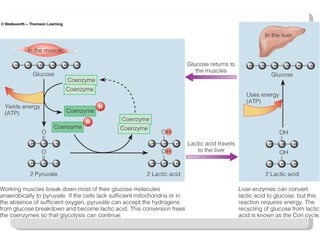
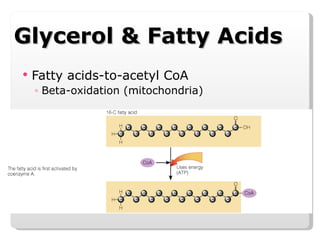
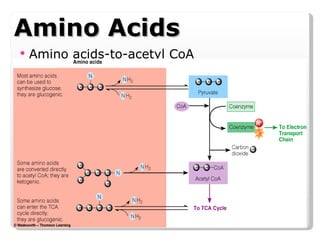
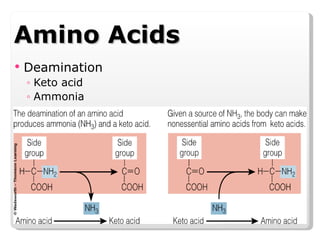
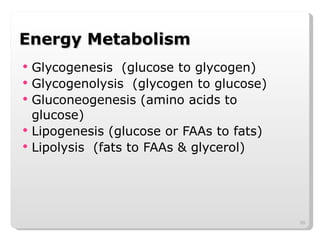
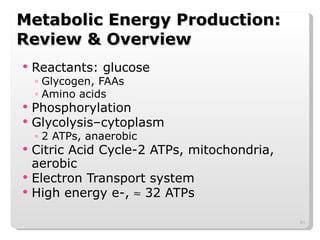
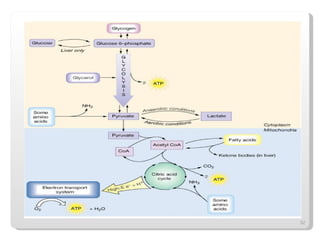
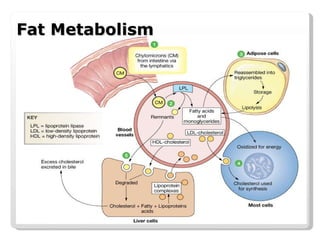
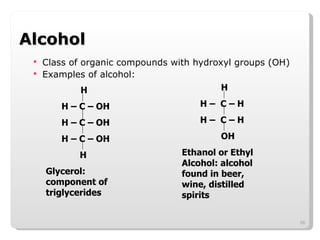
- The human body derives energy through several pathways including glycolysis, the citric acid cycle, and the electron transport chain. Carbohydrates, fats, proteins, and alcohols can all be broken down to produce energy.
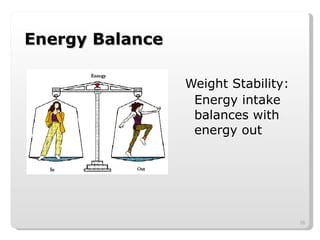
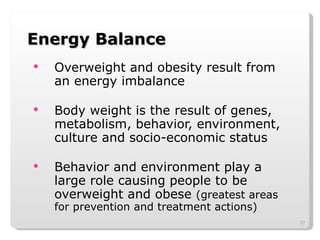
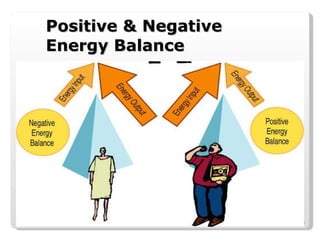
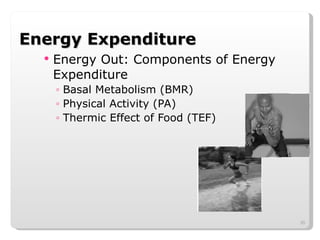
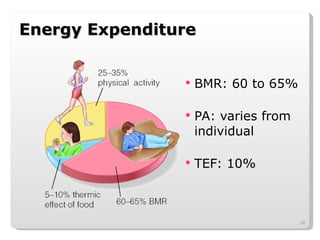
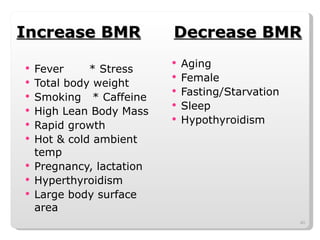
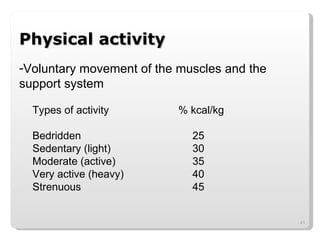
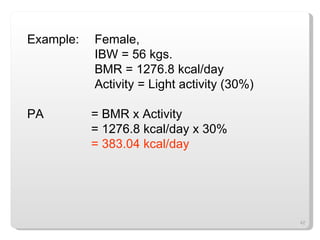
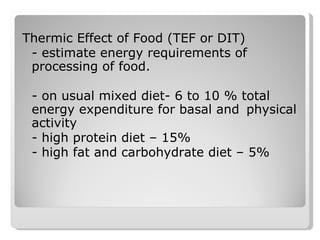
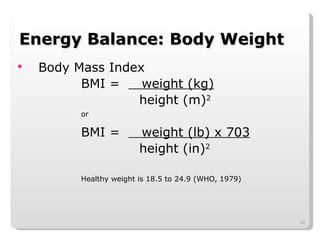
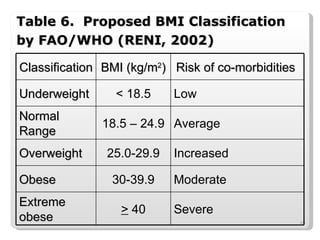
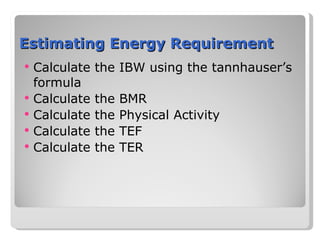
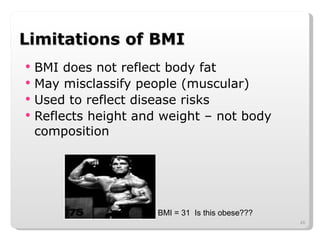
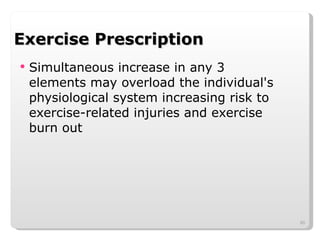
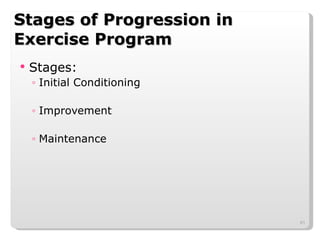
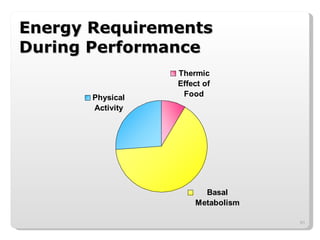
- Factors like basal metabolic rate, physical activity, and the thermic effect of food determine total energy expenditure, while energy intake and energy balance impact body weight and health. Regular physical activity provides numerous health benefits.