Download to read offline

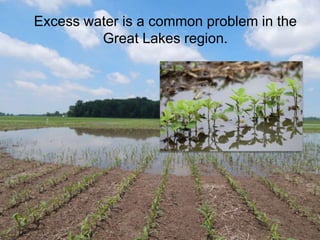
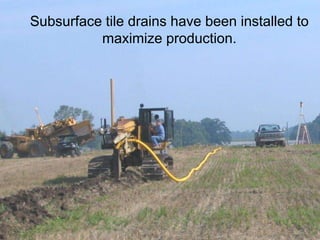
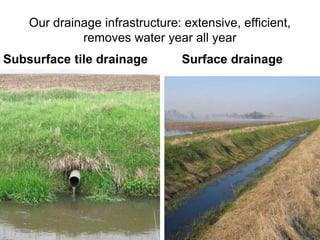
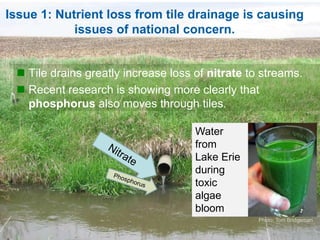
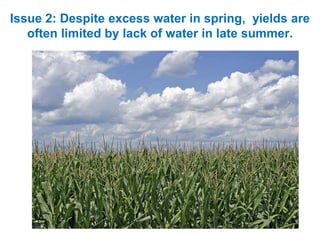
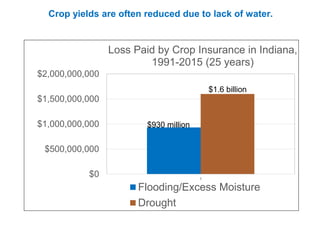
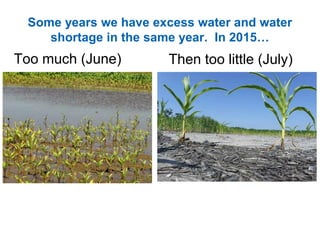
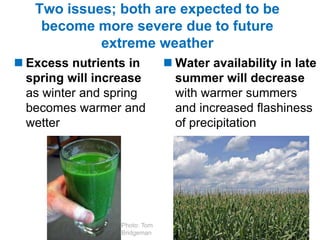
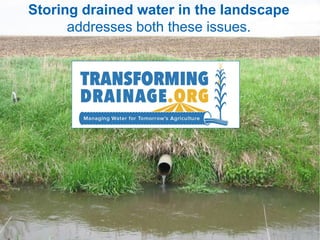
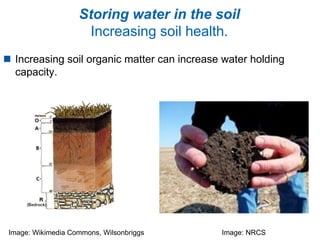
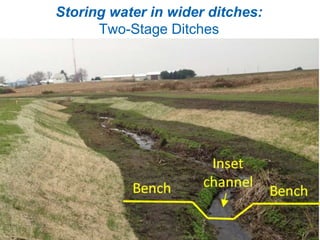
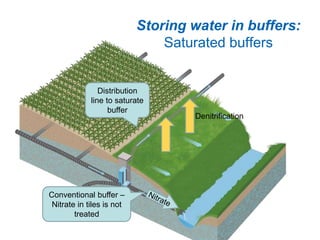
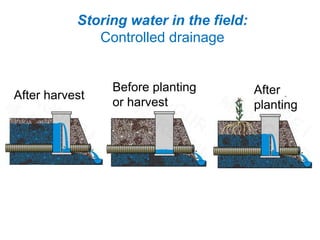
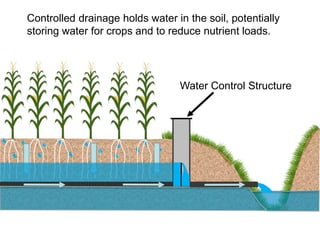
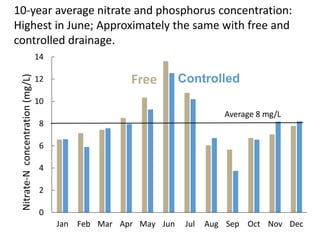
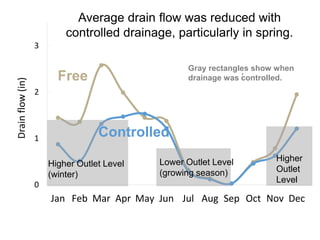
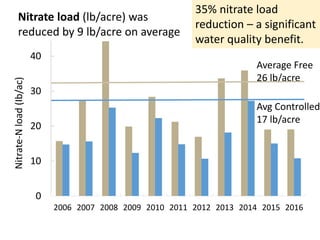
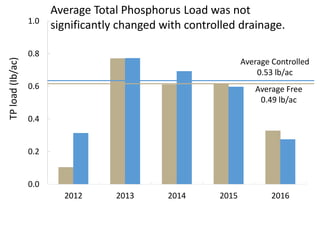
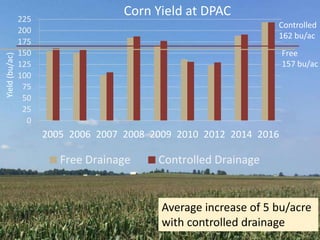
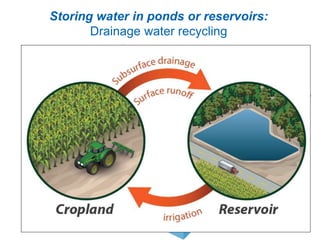
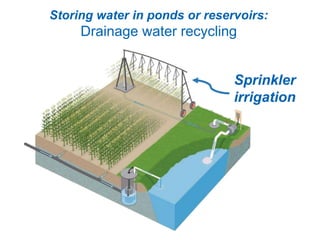
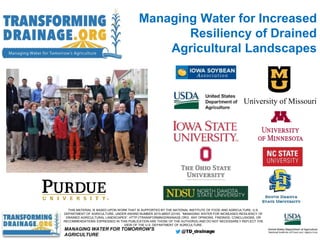
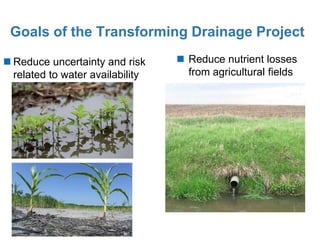
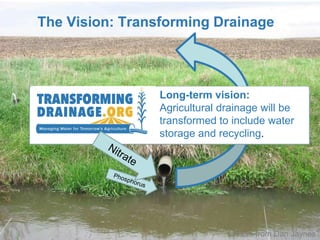

The document discusses managing water for increased resiliency in drained agricultural landscapes in the Great Lakes region, highlighting issues of nutrient loss from tile drainage and water scarcity in late summer. It emphasizes the potential of storing excess water in drained landscapes to address these challenges while enhancing crop yields and reducing nutrient runoff. Research findings illustrate that controlled drainage can effectively reduce nitrate loads and slightly increase corn yields, contributing to improved water quality and agricultural sustainability.