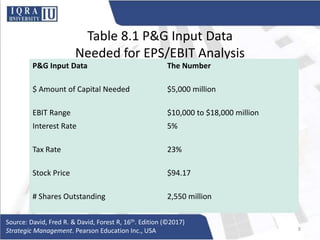
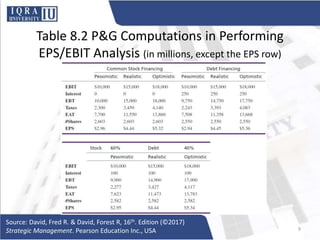
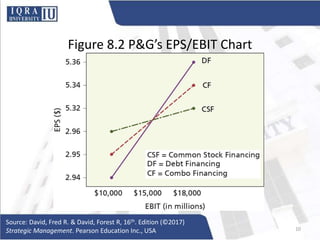
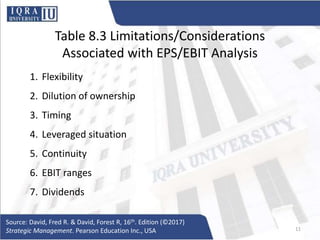
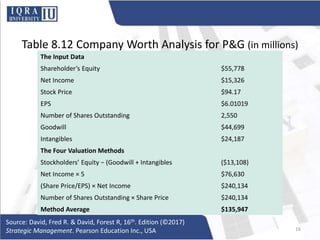
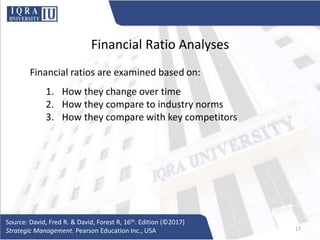
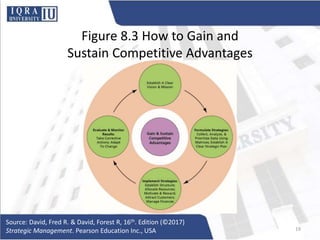
Unit 8
Implementing Strategies:
Finance and Accounting Issues
Source: David, Fred R. & David, Forest R, 16th. Edition (©2017)
Strategic Management. Pearson Education Inc., USA
Learning Objectives
8.1 Determine an appropriate capital structure for the firm
by performing EPS/EBIT analysis to compare the relative
attractiveness of debt versus stock as a source of capital to
implement strategies.
8.2 Develop projected financial statements to reveal the
impact of recommendations with associated costs.
8.3 Determine the cash value of the firm, or a division of the
firm, using four corporate evaluation methods.
8.4 Discuss financial ratios, initial public offerings (IPOs), and
issuing bonds as strategic decisions.
Source: David, Fred R. & David, Forest R, 16th. Edition (©2017)
Strategic Management. Pearson Education Inc., USA 2
Figure 8.1 The Comprehensive, Integrative
Strategic-Management Model
Source: Fred R. David, “How Companies Define Their Mission,”
Long Range Planning 22, no. 3 (June 1988): 40. 3
Finance/Accounting Issues
• Determine capital structure
• acquire needed capital to implement strategies
• Perform EPS/EBIT analysis
• Develop projected financial statements
• Show expected impact of recommendations
• Perform corporate valuation
• In the event an offer is received or a rival firm is to be
acquired
• Analyze financial ratios
• Manage initial public offerings (IPOs), cash levels, and
corporate bonds
Source: David, Fred R. & David, Forest R, 16th. Edition (©2017)
Strategic Management. Pearson Education Inc., USA 4
Capital Structure
• The proportion of debt to equity on a balance sheet is
often referred to as a firm’s capital structure.
• Performing an EPS/EBIT analysis is a common way to
determine the appropriate capital structure needed.
Source: David, Fred R. & David, Forest R, 16th. Edition (©2017)
Strategic Management. Pearson Education Inc., USA 5
Accounting Terms Explained
• EPS is earnings per share, which is net income divided by
number of shares outstanding.
• EBIT is earnings before interest and taxes, also called
operating income.
• Shares outstanding is similar to shares issued (shares
issued also include treasury stock).
• Shares authorized are the number of shares a firm has
approval to issue in total.
• EBT is earnings before tax.
• EAT is earnings after tax.
Source: David, Fred R. & David, Forest R, 16th. Edition (©2017)
Strategic Management. Pearson Education Inc., USA 6
EPS/EBIT Analysis
• A widely used technique for determining whether debt,
stock, or a combination of the two is the best alternative
for raising capital to implement strategies.
• Involves an examination of the impact that debt versus
stock financing has on EPS under various expectations for
EBIT, given specific recommendations (strategies to be
implemented).
• The analysis involves a 4-step process.
Source: David, Fred R. & David, Forest R, 16th. Edition (©2017)
Strategic Management. Pearson Education Inc., USA 7
Table 8.1 P&G Input Data
Needed for EPS/EBIT Analysis
Source: David, Fred R. & David, Forest R, 16th. Edition (©2017)
Strategic Management. Pearson Education Inc., USA 8
P&G Input Data The Number
$ Amount of Capital Needed $5,000 million
EBIT Range $10,000 to $18,000 million
Interest Rate 5%
Tax Rate 23%
Stock Price $94.17
# Shares Outstanding 2,550 million
Table 8.2 P&G Computations in Performing
EPS/EBIT Analysis (in millions, except the EPS row)
Source: David, Fred R. & David, Forest R, 16th. Edition (©2017)
Strategic Management. Pearson Education Inc., USA 9
Figure 8.2 P&G’s EPS/EBIT Chart
Source: David, Fred R. & David, Forest R, 16th. Edition (©2017)
Strategic Management. Pearson Education Inc., USA 10
Table 8.3 Limitations/Considerations
Associated with EPS/EBIT Analysis
1. Flexibility
2. Dilution of ownership
3. Timing
4. Leveraged situation
5. Continuity
6. EBIT ranges
7. Dividends
Source: David, Fred R. & David, Forest R, 16th. Edition (©2017)
Strategic Management. Pearson Education Inc., USA 11
Projected Financial Statements
• Projected Financial Statements
• allow an organization to examine the expected results
of various actions and approaches
• allow an organization to compute projected financial
ratios under various strategy-implementation
decisions
Source: David, Fred R. & David, Forest R, 16th. Edition (©2017)
Strategic Management. Pearson Education Inc., USA 12
Performing Projected Financial Analysis
1. Prepare the projected income statement before the balance
sheet.
2. Use the percentage-of-sales method to project cost of goods
sold (CO G S) and the expense items in the income statement.
3. Calculate the projected net income.
4. Subtract from the net income any dividends to be paid for that
year.
5. Project the balance sheet items, beginning with retained
earnings and then forecasting stockholders' equity, long-term
liabilities, current liabilities, total liabilities, total assets, fixed
assets, and current assets (in that order).
6. Use the cash account as the plug figure.
7. List commentary (remarks) on the projected statements.
Source: David, Fred R. & David, Forest R, 16th. Edition (©2017)
Strategic Management. Pearson Education Inc., USA 13
Corporate Valuation
• Corporate valuation is not an exact science; value is
sometimes in the eye of the beholder.
• The valuation of a firm’s worth is based on financial facts,
but common sense and good judgment enter into the
process.
• Different valuation methods will yield different totals for
a firm’s worth.
(Continued)
Source: David, Fred R. & David, Forest R, 16th. Edition (©2017)
Strategic Management. Pearson Education Inc., USA 14
Corporate Valuation
Methods:
• The Net Worth Method
• Total Shareholders’ Equity (SE) minus (Goodwill +
Intangibles)
• The Net Income Method
• Net Income × Five
• Price-Earnings Ratio Method
• (Stock Price ÷ EPS) × NI
• Outstanding Shares Method
• Number of Shares Outstanding × Stock Price
Source: David, Fred R. & David, Forest R, 16th. Edition (©2017)
Strategic Management. Pearson Education Inc., USA 15
Table 8.12 Company Worth Analysis for P&G (in millions)
Source: David, Fred R. & David, Forest R, 16th. Edition (©2017)
Strategic Management. Pearson Education Inc., USA 16
The Input Data
Shareholder’s Equity $55,778
Net Income $15,326
Stock Price $94.17
EPS $6.01019
Number of Shares Outstanding 2,550
Goodwill $44,699
Intangibles $24,187
The Four Valuation Methods
Stockholders’ Equity − (Goodwill + Intangibles ($13,108)
Net Income × 5 $76,630
(Share Price/EPS) × Net Income $240,134
Number of Shares Outstanding × Share Price $240,134
Method Average $135,947
Financial Ratio Analyses
Financial ratios are examined based on:
1. How they change over time
2. How they compare to industry norms
3. How they compare with key competitors
Source: David, Fred R. & David, Forest R, 16th. Edition (©2017)
Strategic Management. Pearson Education Inc., USA 17
IPOs and Corporate Bonds
• Go public with an IPO
• “Going public” means selling off a percentage of a
company to others to raise capital; this action dilutes
the owners’ control of the firm.
• Issue corporate bonds
• This is analogous to going to the bank and borrowing
money, except that with bonds, the company obtains
funds from investors rather than banks.
Source: David, Fred R. & David, Forest R, 16th. Edition (©2017)
Strategic Management. Pearson Education Inc., USA 18
Figure 8.3 How to Gain and
Sustain Competitive Advantages
Source: David, Fred R. & David, Forest R, 16th. Edition (©2017)
Strategic Management. Pearson Education Inc., USA 19
Session Ends
Disclaimer
The information provided in this module is derived from Pearson
Education Inc., USA, and other sources. All information is provided in
good faith for educational purposes only. Iqra University claims no
ownership of this information, and will not be liable for any claims
arising thereof, now or in the future.

not imp Implementing Strategies-Finance _ Actg. Issues.pptx

  • 1.
    Unit 8 Implementing Strategies: Financeand Accounting Issues Source: David, Fred R. & David, Forest R, 16th. Edition (©2017) Strategic Management. Pearson Education Inc., USA
  • 2.
    Learning Objectives 8.1 Determinean appropriate capital structure for the firm by performing EPS/EBIT analysis to compare the relative attractiveness of debt versus stock as a source of capital to implement strategies. 8.2 Develop projected financial statements to reveal the impact of recommendations with associated costs. 8.3 Determine the cash value of the firm, or a division of the firm, using four corporate evaluation methods. 8.4 Discuss financial ratios, initial public offerings (IPOs), and issuing bonds as strategic decisions. Source: David, Fred R. & David, Forest R, 16th. Edition (©2017) Strategic Management. Pearson Education Inc., USA 2
  • 3.
    Figure 8.1 TheComprehensive, Integrative Strategic-Management Model Source: Fred R. David, “How Companies Define Their Mission,” Long Range Planning 22, no. 3 (June 1988): 40. 3
  • 4.
    Finance/Accounting Issues • Determinecapital structure • acquire needed capital to implement strategies • Perform EPS/EBIT analysis • Develop projected financial statements • Show expected impact of recommendations • Perform corporate valuation • In the event an offer is received or a rival firm is to be acquired • Analyze financial ratios • Manage initial public offerings (IPOs), cash levels, and corporate bonds Source: David, Fred R. & David, Forest R, 16th. Edition (©2017) Strategic Management. Pearson Education Inc., USA 4
  • 5.
    Capital Structure • Theproportion of debt to equity on a balance sheet is often referred to as a firm’s capital structure. • Performing an EPS/EBIT analysis is a common way to determine the appropriate capital structure needed. Source: David, Fred R. & David, Forest R, 16th. Edition (©2017) Strategic Management. Pearson Education Inc., USA 5
  • 6.
    Accounting Terms Explained •EPS is earnings per share, which is net income divided by number of shares outstanding. • EBIT is earnings before interest and taxes, also called operating income. • Shares outstanding is similar to shares issued (shares issued also include treasury stock). • Shares authorized are the number of shares a firm has approval to issue in total. • EBT is earnings before tax. • EAT is earnings after tax. Source: David, Fred R. & David, Forest R, 16th. Edition (©2017) Strategic Management. Pearson Education Inc., USA 6
  • 7.
    EPS/EBIT Analysis • Awidely used technique for determining whether debt, stock, or a combination of the two is the best alternative for raising capital to implement strategies. • Involves an examination of the impact that debt versus stock financing has on EPS under various expectations for EBIT, given specific recommendations (strategies to be implemented). • The analysis involves a 4-step process. Source: David, Fred R. & David, Forest R, 16th. Edition (©2017) Strategic Management. Pearson Education Inc., USA 7
  • 8.
    Table 8.1 P&GInput Data Needed for EPS/EBIT Analysis Source: David, Fred R. & David, Forest R, 16th. Edition (©2017) Strategic Management. Pearson Education Inc., USA 8 P&G Input Data The Number $ Amount of Capital Needed $5,000 million EBIT Range $10,000 to $18,000 million Interest Rate 5% Tax Rate 23% Stock Price $94.17 # Shares Outstanding 2,550 million
  • 9.
    Table 8.2 P&GComputations in Performing EPS/EBIT Analysis (in millions, except the EPS row) Source: David, Fred R. & David, Forest R, 16th. Edition (©2017) Strategic Management. Pearson Education Inc., USA 9
  • 10.
    Figure 8.2 P&G’sEPS/EBIT Chart Source: David, Fred R. & David, Forest R, 16th. Edition (©2017) Strategic Management. Pearson Education Inc., USA 10
  • 11.
    Table 8.3 Limitations/Considerations Associatedwith EPS/EBIT Analysis 1. Flexibility 2. Dilution of ownership 3. Timing 4. Leveraged situation 5. Continuity 6. EBIT ranges 7. Dividends Source: David, Fred R. & David, Forest R, 16th. Edition (©2017) Strategic Management. Pearson Education Inc., USA 11
  • 12.
    Projected Financial Statements •Projected Financial Statements • allow an organization to examine the expected results of various actions and approaches • allow an organization to compute projected financial ratios under various strategy-implementation decisions Source: David, Fred R. & David, Forest R, 16th. Edition (©2017) Strategic Management. Pearson Education Inc., USA 12
  • 13.
    Performing Projected FinancialAnalysis 1. Prepare the projected income statement before the balance sheet. 2. Use the percentage-of-sales method to project cost of goods sold (CO G S) and the expense items in the income statement. 3. Calculate the projected net income. 4. Subtract from the net income any dividends to be paid for that year. 5. Project the balance sheet items, beginning with retained earnings and then forecasting stockholders' equity, long-term liabilities, current liabilities, total liabilities, total assets, fixed assets, and current assets (in that order). 6. Use the cash account as the plug figure. 7. List commentary (remarks) on the projected statements. Source: David, Fred R. & David, Forest R, 16th. Edition (©2017) Strategic Management. Pearson Education Inc., USA 13
  • 14.
    Corporate Valuation • Corporatevaluation is not an exact science; value is sometimes in the eye of the beholder. • The valuation of a firm’s worth is based on financial facts, but common sense and good judgment enter into the process. • Different valuation methods will yield different totals for a firm’s worth. (Continued) Source: David, Fred R. & David, Forest R, 16th. Edition (©2017) Strategic Management. Pearson Education Inc., USA 14
  • 15.
    Corporate Valuation Methods: • TheNet Worth Method • Total Shareholders’ Equity (SE) minus (Goodwill + Intangibles) • The Net Income Method • Net Income × Five • Price-Earnings Ratio Method • (Stock Price ÷ EPS) × NI • Outstanding Shares Method • Number of Shares Outstanding × Stock Price Source: David, Fred R. & David, Forest R, 16th. Edition (©2017) Strategic Management. Pearson Education Inc., USA 15
  • 16.
    Table 8.12 CompanyWorth Analysis for P&G (in millions) Source: David, Fred R. & David, Forest R, 16th. Edition (©2017) Strategic Management. Pearson Education Inc., USA 16 The Input Data Shareholder’s Equity $55,778 Net Income $15,326 Stock Price $94.17 EPS $6.01019 Number of Shares Outstanding 2,550 Goodwill $44,699 Intangibles $24,187 The Four Valuation Methods Stockholders’ Equity − (Goodwill + Intangibles ($13,108) Net Income × 5 $76,630 (Share Price/EPS) × Net Income $240,134 Number of Shares Outstanding × Share Price $240,134 Method Average $135,947
  • 17.
    Financial Ratio Analyses Financialratios are examined based on: 1. How they change over time 2. How they compare to industry norms 3. How they compare with key competitors Source: David, Fred R. & David, Forest R, 16th. Edition (©2017) Strategic Management. Pearson Education Inc., USA 17
  • 18.
    IPOs and CorporateBonds • Go public with an IPO • “Going public” means selling off a percentage of a company to others to raise capital; this action dilutes the owners’ control of the firm. • Issue corporate bonds • This is analogous to going to the bank and borrowing money, except that with bonds, the company obtains funds from investors rather than banks. Source: David, Fred R. & David, Forest R, 16th. Edition (©2017) Strategic Management. Pearson Education Inc., USA 18
  • 19.
    Figure 8.3 Howto Gain and Sustain Competitive Advantages Source: David, Fred R. & David, Forest R, 16th. Edition (©2017) Strategic Management. Pearson Education Inc., USA 19
  • 20.
  • 21.
    Disclaimer The information providedin this module is derived from Pearson Education Inc., USA, and other sources. All information is provided in good faith for educational purposes only. Iqra University claims no ownership of this information, and will not be liable for any claims arising thereof, now or in the future.