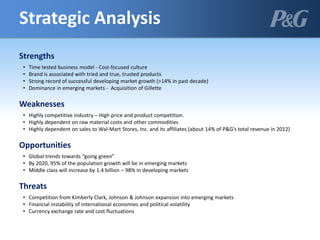
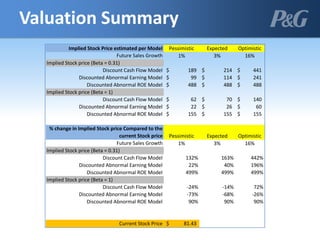
Team 2
Javier Azucena
Valere Mokubu
Chintankumar Patel
Jennifer Pradere
Elisa Reyes
Marcello Sobrinho
Financial Reporting and Analysis
Objective
• Perform a strategic, accounting, financial,
forecasting, and valuation analysis on Procter
& Gamble
• Make an investment recommendation
About P&G
• Founded 1837
• 300 brands in more than 180 countries
• 25 billion-dollar brands
• $83 billion in sales
• $10 billion in net earnings
• Commitment to ongoing innovation
• Global brand – generates 38% of sales and 44% of
unit volume from developing markets
Strategic Analysis
Strengths
• Time tested business model - Cost-focused culture
• Brand is associated with tried and true, trusted products
• Strong record of successful developing market growth (>14% in past decade)
• Dominance in emerging markets - Acquisition of Gillette
Weaknesses
• Highly competitive industry – High price and product competition.
• Highly dependent on raw material costs and other commodities
• Highly dependent on sales to Wal-Mart Stores, Inc. and its affiliates (about 14% of P&G’s total revenue in 2012)
Opportunities
• Global trends towards “going green”
• By 2020, 95% of the population growth will be in emerging markets
• Middle class will increase by 1.4 billion – 98% in developing markets
Threats
• Competition from Kimberly Clark, Johnson & Johnson expansion into emerging markets
• Financial instability of international economies and political volatility
• Currency exchange rate and cost fluctuations
• Sales are recognized when revenue is realized or realizable and has been
earned
• Goodwill and indefinite-lived brands are not amortized
• The cost of intangible assets with determinable useful lives is amortized on
a straight-line or accelerated basis.
• Financial statements of subsidiaries outside the U.S. are measured using
the local currency.
• U.S. dollar used as the functional currency for subsidiaries in highly
inflationary economies.
• During the 2nd quarter of fiscal 2012 P&G changed the annual goodwill
impairment testing date from July 1 to October 1 of each year.
Accounting Analysis
Financial Analysis
0
0.1
0.2
0.3
0.4
0.5
0.6
0.7
Gross Profit Margin
0
0.05
0.1
0.15
0.2
0.25
ROA
0
20,000
40,000
60,000
80,000
100,000
2003
2004
2005
2006
2007
2008
2009
2010
2011
2012
Sales
0.5
0.6
0.7
0.8
0.9
1
1.1
1.2
2003
2004
2005
2006
2007
2008
2009
2010
2011
2012
Asset Turnover Ratio
0
10000
20000
30000
40000
50000
60000
2003
2004
2005
2006
2007
2008
2009
2010
2011
2012
Gross Profit
0
5000
10000
15000
2003
2004
2005
2006
2007
2008
2009
2010
2011
2012
Net Income
Financial Analysis
Quick Ratio
0
0.5
1
1.5
2
2003
2004
2005
2006
2007
2008
2009
2010
2011
2012
0
1000
2000
3000
4000
5000
2003
2004
2005
2006
2007
2008
2009
2010
2011
2012
Common Stock
10
15
20
25
Price/Earnings
0
2
4
6
8
10
Mkt. Value of Equity
0
1
2
3
4
Leverage
0.02
0.04
0.06
Dep. & Amortization/Sales
• Pessimistic: assuming overall economy does not improve and company experiences sales growth similar to
last year of 1%.
• Optimistic: assuming there is a dramatic improvement in the economy and company experiences sales
growth similar to average growth before the economic crises in 2007 of 16%.
• Expected: assuming overall economy improves at slower pace which will grow P&G sales to 3%.
INCOME STATEMENT Actual Forecast Forecast Forecast Forecast Forecast
Fiscal Year: % 2012 2013 2014 2015 2016 2017
(FYR Ending): (30JUN2012 ) (30JUN2013 ) (30JUN2014 ) (30JUN2015 ) (30JUN2016 ) (30JUN2017 )
Sales (Net) 3% 83,680 86,190 88,776 91,439 94,183 97,008
Cost of Goods Sold 46% 38,881 40,047 41,249 42,486 43,761 45,074
Gross Profit 54% 44,799 46,143 47,527 48,953 50,422 51,934
Selling, General, & Admin Expenses 31% 25,675 26,445 27,239 28,056 28,897 29,764
Operating Income Before Depreciation 23% 19,124 19,698 20,289 20,897 21,524 22,170
Depreciation, Depletion, & Amortiz 4% 3,204 3,300 3,399 3,501 3,606 3,714
Operating Income After Depreciation 19% 15,920 16,398 16,890 17,396 17,918 18,456
Interest Expense 1% 769 792 816 840 866 891
Non-Operating Income/Expense 0% 262 270 278 286 295 304
Special Items -3% (2,628) (2,707) (2,788) (2,872) (2,958) (3,047)
Tax Rate 27%
Pretax Income 15% 12,785 13,169 13,564 13,971 14,390 14,821
Income Taxes - Total 4% 3,468 3,572 3,679 3,790 3,903 4,020
Minority Interest 0% 148 152 157 162 167 172
Income Before EI&DO 11% 9,169 9,444 9,727 10,019 10,320 10,629
Discontinued Operations 2% 1,587 1,635 1,684 1,734 1,786 1,840
Net Income (Loss) 13% 10,756 11,079 11,411 11,753 12,106 12,469
Forecasting
Implied Stock Price estimated per Model Pessimistic Expected Optimistic
Future Sales Growth 1% 3% 16%
Implied Stock price (Beta = 0.31)
Discount Cash Flow Model 189$ 214$ 441$
Discounted Abnormal Earning Model 99$ 114$ 241$
Discounted Abnormal ROE Model 488$ 488$ 488$
Implied Stock price (Beta = 1)
Discount Cash Flow Model 62$ 70$ 140$
Discounted Abnormal Earning Model 22$ 26$ 60$
Discounted Abnormal ROE Model 155$ 155$ 155$
% change in Implied Stock price Compared to the
current Stock price Pessimistic Expected Optimistic
Future Sales Growth 1% 3% 16%
Implied Stock price (Beta = 0.31)
Discount Cash Flow Model 132% 163% 442%
Discounted Abnormal Earning Model 22% 40% 196%
Discounted Abnormal ROE Model 499% 499% 499%
Implied Stock price (Beta = 1)
Discount Cash Flow Model -24% -14% 72%
Discounted Abnormal Earning Model -73% -68% -26%
Discounted Abnormal ROE Model 90% 90% 90%
Current Stock Price 81.43$
Valuation Summary
Projected Company Data Using Historical Earnings Growth Rate
Year EPS DPS
Current $4.41 2.05 5.35 Earnings after 10 years
Year 1 4.50 2.09 24.83 Sum of dividends paid over 10 years
Year 2 4.58 2.13
Year 3 4.67 2.17 $96.45 Projected price (Average P/E * EPS)
Year 4 4.76 2.21 $121.27 Total gain (Projected Price + Dividends)
Year 5 4.86 2.25
Year 6 4.95 2.30 4.1% Projected return using historical EPS growth rate
Year 7 5.05 2.34 [(Total Gain / Current Price) ^ (1/10)] - 1
Year 8 5.15 2.39
Year 9 5.25 2.43
Year 10 5.35 2.48
Projected Company Data Using Sustainable Growth Rate
Year BVPS EPS DPS
Current $23.99 3.77 1.75 8.46 Earnings after 10 years (BVPS * ROE)
Year 1 26.01 4.08 1.89 29.74 Sum of dividends paid over 10 years
Year 2 28.20 4.43 2.05
Year 3 30.58 4.80 2.23 $152.45 Projected price (Average P/E * EPS)
Year 4 33.15 5.21 2.41 $182.19 Total gain (Projected Price + Dividends)
Year 5 35.94 5.64 2.62
Year 6 38.97 6.12 2.84 8.4% Projected return using sustainable growth rate
Year 7 42.25 6.64 3.08 [(Total Gain / Current Price) ^ (1/10)] - 1
Year 8 45.81 7.19 3.34
Year 9 49.67 7.80 3.62
Year 10 53.85 8.46 3.92
Buffet Valuation
• Per distress prediction model it was concluded that P&G does not face bankruptcy or considered in gray
area as Z is greater than 1.81 and does not fall between the range of 1.81 and 2.67. Therefore it should be
considered a safe investment
• In addition to that our estimated bond rating was close to the rating given by the bong agencies of AA - to
the company.
Debt Ratings: Median Financial Ratios by Category
*Rating is performed at the expected sales growth rate of 3%
2012 Rating
Earnings before interest and taxes to net capital 25% AA
Pretax interest coverage (EBIT/Interest expense) 20.7 AAA
Cash flow from operations to total debt 63% AA
Net debt to net capital 33% BBB
Actual Bond rating AA -
Z 3.1823
2012
X1 (0.02) Net working capital/total assets
X2 0.499198 retained earnigs/total assets
X3 0.120384 EBIT/total assets
X4 2.467636 market value of equity/book value of total liabilities
X5 0.63277 sales/total assets
Assessment of Solvency
• Industry not favorable for rapid growth
• Opportunities to grow in the emerging markets
• Renewed focus on investing in product innovation
• Valuations and forecasting models predict positive market price growth
• Solvency – not expected to experience bankruptcy in near future
• Will continue to grow steadily
• In the event economy grows rapidly, P&G will realize optimistic growth
rate of 16% in which case it would be a significantly profitable
investment at present.
• Looking at the current view of the economy and growth it is likely that
the company will follow the expected or pessimistic sales growth in
which case P&B would be a fair investment *assuming Beta = .31
Conclusion
Recommendation
Invest.
QUESTIONS?

P&g presentation

  • 1.
    Team 2 Javier Azucena ValereMokubu Chintankumar Patel Jennifer Pradere Elisa Reyes Marcello Sobrinho Financial Reporting and Analysis
  • 2.
    Objective • Perform astrategic, accounting, financial, forecasting, and valuation analysis on Procter & Gamble • Make an investment recommendation
  • 3.
    About P&G • Founded1837 • 300 brands in more than 180 countries • 25 billion-dollar brands • $83 billion in sales • $10 billion in net earnings • Commitment to ongoing innovation • Global brand – generates 38% of sales and 44% of unit volume from developing markets
  • 4.
    Strategic Analysis Strengths • Timetested business model - Cost-focused culture • Brand is associated with tried and true, trusted products • Strong record of successful developing market growth (>14% in past decade) • Dominance in emerging markets - Acquisition of Gillette Weaknesses • Highly competitive industry – High price and product competition. • Highly dependent on raw material costs and other commodities • Highly dependent on sales to Wal-Mart Stores, Inc. and its affiliates (about 14% of P&G’s total revenue in 2012) Opportunities • Global trends towards “going green” • By 2020, 95% of the population growth will be in emerging markets • Middle class will increase by 1.4 billion – 98% in developing markets Threats • Competition from Kimberly Clark, Johnson & Johnson expansion into emerging markets • Financial instability of international economies and political volatility • Currency exchange rate and cost fluctuations
  • 5.
    • Sales arerecognized when revenue is realized or realizable and has been earned • Goodwill and indefinite-lived brands are not amortized • The cost of intangible assets with determinable useful lives is amortized on a straight-line or accelerated basis. • Financial statements of subsidiaries outside the U.S. are measured using the local currency. • U.S. dollar used as the functional currency for subsidiaries in highly inflationary economies. • During the 2nd quarter of fiscal 2012 P&G changed the annual goodwill impairment testing date from July 1 to October 1 of each year. Accounting Analysis
  • 6.
    Financial Analysis 0 0.1 0.2 0.3 0.4 0.5 0.6 0.7 Gross ProfitMargin 0 0.05 0.1 0.15 0.2 0.25 ROA 0 20,000 40,000 60,000 80,000 100,000 2003 2004 2005 2006 2007 2008 2009 2010 2011 2012 Sales 0.5 0.6 0.7 0.8 0.9 1 1.1 1.2 2003 2004 2005 2006 2007 2008 2009 2010 2011 2012 Asset Turnover Ratio 0 10000 20000 30000 40000 50000 60000 2003 2004 2005 2006 2007 2008 2009 2010 2011 2012 Gross Profit 0 5000 10000 15000 2003 2004 2005 2006 2007 2008 2009 2010 2011 2012 Net Income
  • 7.
    Financial Analysis Quick Ratio 0 0.5 1 1.5 2 2003 2004 2005 2006 2007 2008 2009 2010 2011 2012 0 1000 2000 3000 4000 5000 2003 2004 2005 2006 2007 2008 2009 2010 2011 2012 CommonStock 10 15 20 25 Price/Earnings 0 2 4 6 8 10 Mkt. Value of Equity 0 1 2 3 4 Leverage 0.02 0.04 0.06 Dep. & Amortization/Sales
  • 8.
    • Pessimistic: assumingoverall economy does not improve and company experiences sales growth similar to last year of 1%. • Optimistic: assuming there is a dramatic improvement in the economy and company experiences sales growth similar to average growth before the economic crises in 2007 of 16%. • Expected: assuming overall economy improves at slower pace which will grow P&G sales to 3%. INCOME STATEMENT Actual Forecast Forecast Forecast Forecast Forecast Fiscal Year: % 2012 2013 2014 2015 2016 2017 (FYR Ending): (30JUN2012 ) (30JUN2013 ) (30JUN2014 ) (30JUN2015 ) (30JUN2016 ) (30JUN2017 ) Sales (Net) 3% 83,680 86,190 88,776 91,439 94,183 97,008 Cost of Goods Sold 46% 38,881 40,047 41,249 42,486 43,761 45,074 Gross Profit 54% 44,799 46,143 47,527 48,953 50,422 51,934 Selling, General, & Admin Expenses 31% 25,675 26,445 27,239 28,056 28,897 29,764 Operating Income Before Depreciation 23% 19,124 19,698 20,289 20,897 21,524 22,170 Depreciation, Depletion, & Amortiz 4% 3,204 3,300 3,399 3,501 3,606 3,714 Operating Income After Depreciation 19% 15,920 16,398 16,890 17,396 17,918 18,456 Interest Expense 1% 769 792 816 840 866 891 Non-Operating Income/Expense 0% 262 270 278 286 295 304 Special Items -3% (2,628) (2,707) (2,788) (2,872) (2,958) (3,047) Tax Rate 27% Pretax Income 15% 12,785 13,169 13,564 13,971 14,390 14,821 Income Taxes - Total 4% 3,468 3,572 3,679 3,790 3,903 4,020 Minority Interest 0% 148 152 157 162 167 172 Income Before EI&DO 11% 9,169 9,444 9,727 10,019 10,320 10,629 Discontinued Operations 2% 1,587 1,635 1,684 1,734 1,786 1,840 Net Income (Loss) 13% 10,756 11,079 11,411 11,753 12,106 12,469 Forecasting
  • 9.
    Implied Stock Priceestimated per Model Pessimistic Expected Optimistic Future Sales Growth 1% 3% 16% Implied Stock price (Beta = 0.31) Discount Cash Flow Model 189$ 214$ 441$ Discounted Abnormal Earning Model 99$ 114$ 241$ Discounted Abnormal ROE Model 488$ 488$ 488$ Implied Stock price (Beta = 1) Discount Cash Flow Model 62$ 70$ 140$ Discounted Abnormal Earning Model 22$ 26$ 60$ Discounted Abnormal ROE Model 155$ 155$ 155$ % change in Implied Stock price Compared to the current Stock price Pessimistic Expected Optimistic Future Sales Growth 1% 3% 16% Implied Stock price (Beta = 0.31) Discount Cash Flow Model 132% 163% 442% Discounted Abnormal Earning Model 22% 40% 196% Discounted Abnormal ROE Model 499% 499% 499% Implied Stock price (Beta = 1) Discount Cash Flow Model -24% -14% 72% Discounted Abnormal Earning Model -73% -68% -26% Discounted Abnormal ROE Model 90% 90% 90% Current Stock Price 81.43$ Valuation Summary
  • 10.
    Projected Company DataUsing Historical Earnings Growth Rate Year EPS DPS Current $4.41 2.05 5.35 Earnings after 10 years Year 1 4.50 2.09 24.83 Sum of dividends paid over 10 years Year 2 4.58 2.13 Year 3 4.67 2.17 $96.45 Projected price (Average P/E * EPS) Year 4 4.76 2.21 $121.27 Total gain (Projected Price + Dividends) Year 5 4.86 2.25 Year 6 4.95 2.30 4.1% Projected return using historical EPS growth rate Year 7 5.05 2.34 [(Total Gain / Current Price) ^ (1/10)] - 1 Year 8 5.15 2.39 Year 9 5.25 2.43 Year 10 5.35 2.48 Projected Company Data Using Sustainable Growth Rate Year BVPS EPS DPS Current $23.99 3.77 1.75 8.46 Earnings after 10 years (BVPS * ROE) Year 1 26.01 4.08 1.89 29.74 Sum of dividends paid over 10 years Year 2 28.20 4.43 2.05 Year 3 30.58 4.80 2.23 $152.45 Projected price (Average P/E * EPS) Year 4 33.15 5.21 2.41 $182.19 Total gain (Projected Price + Dividends) Year 5 35.94 5.64 2.62 Year 6 38.97 6.12 2.84 8.4% Projected return using sustainable growth rate Year 7 42.25 6.64 3.08 [(Total Gain / Current Price) ^ (1/10)] - 1 Year 8 45.81 7.19 3.34 Year 9 49.67 7.80 3.62 Year 10 53.85 8.46 3.92 Buffet Valuation
  • 11.
    • Per distressprediction model it was concluded that P&G does not face bankruptcy or considered in gray area as Z is greater than 1.81 and does not fall between the range of 1.81 and 2.67. Therefore it should be considered a safe investment • In addition to that our estimated bond rating was close to the rating given by the bong agencies of AA - to the company. Debt Ratings: Median Financial Ratios by Category *Rating is performed at the expected sales growth rate of 3% 2012 Rating Earnings before interest and taxes to net capital 25% AA Pretax interest coverage (EBIT/Interest expense) 20.7 AAA Cash flow from operations to total debt 63% AA Net debt to net capital 33% BBB Actual Bond rating AA - Z 3.1823 2012 X1 (0.02) Net working capital/total assets X2 0.499198 retained earnigs/total assets X3 0.120384 EBIT/total assets X4 2.467636 market value of equity/book value of total liabilities X5 0.63277 sales/total assets Assessment of Solvency
  • 12.
    • Industry notfavorable for rapid growth • Opportunities to grow in the emerging markets • Renewed focus on investing in product innovation • Valuations and forecasting models predict positive market price growth • Solvency – not expected to experience bankruptcy in near future • Will continue to grow steadily • In the event economy grows rapidly, P&G will realize optimistic growth rate of 16% in which case it would be a significantly profitable investment at present. • Looking at the current view of the economy and growth it is likely that the company will follow the expected or pessimistic sales growth in which case P&B would be a fair investment *assuming Beta = .31 Conclusion
  • 13.
  • 14.
  • 15.