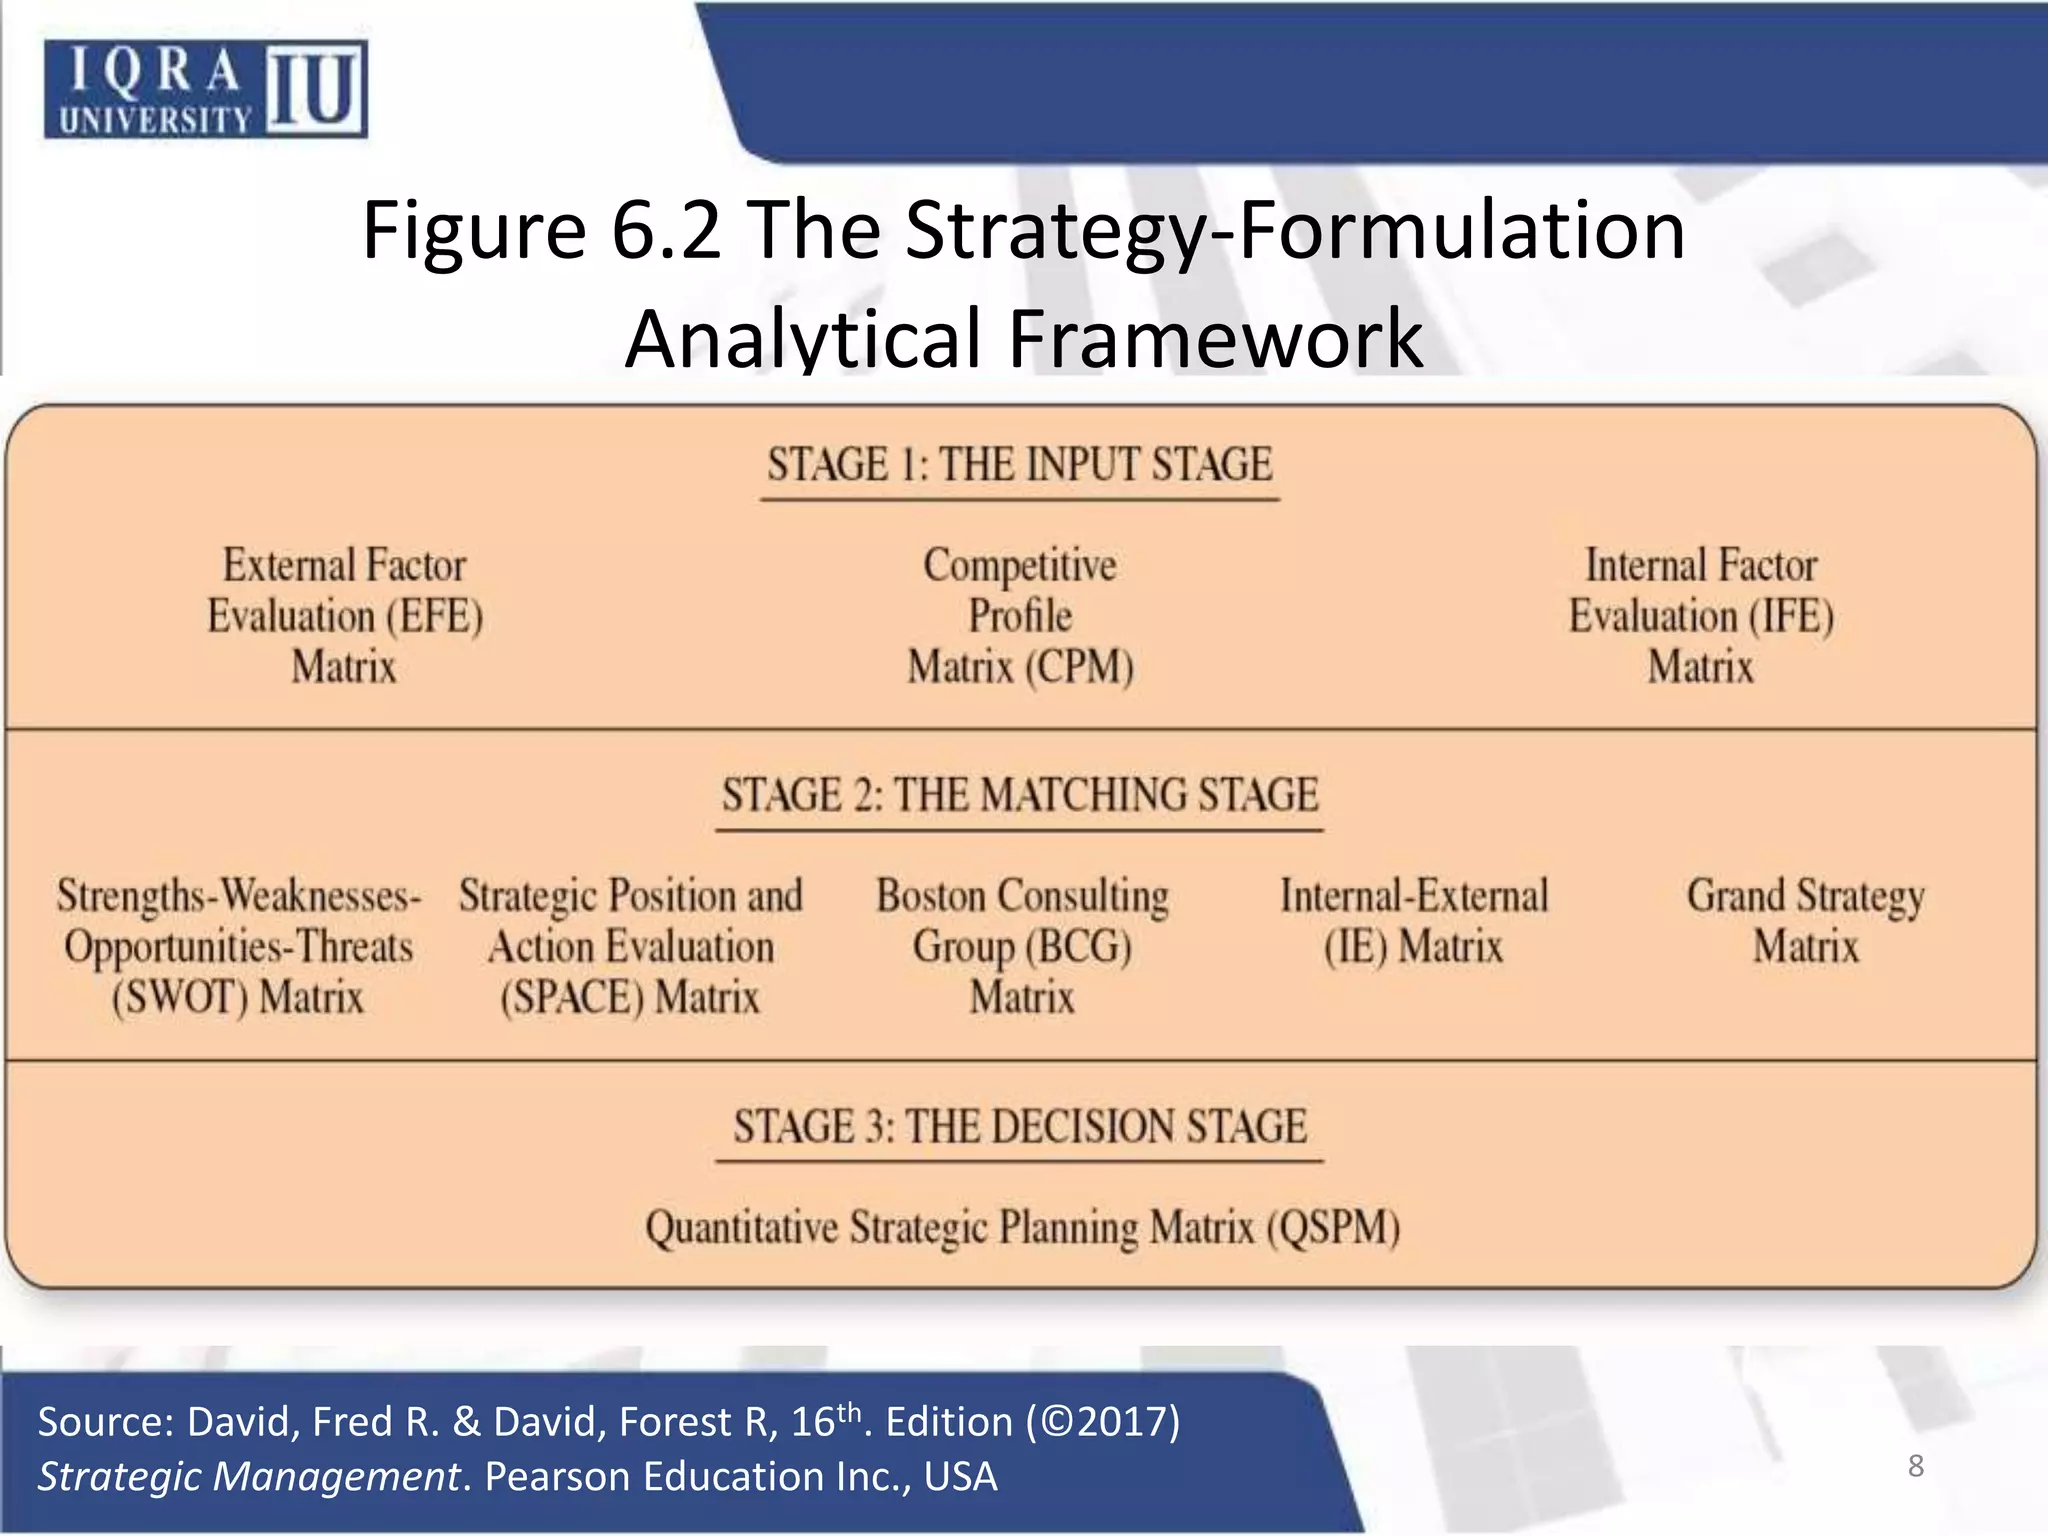
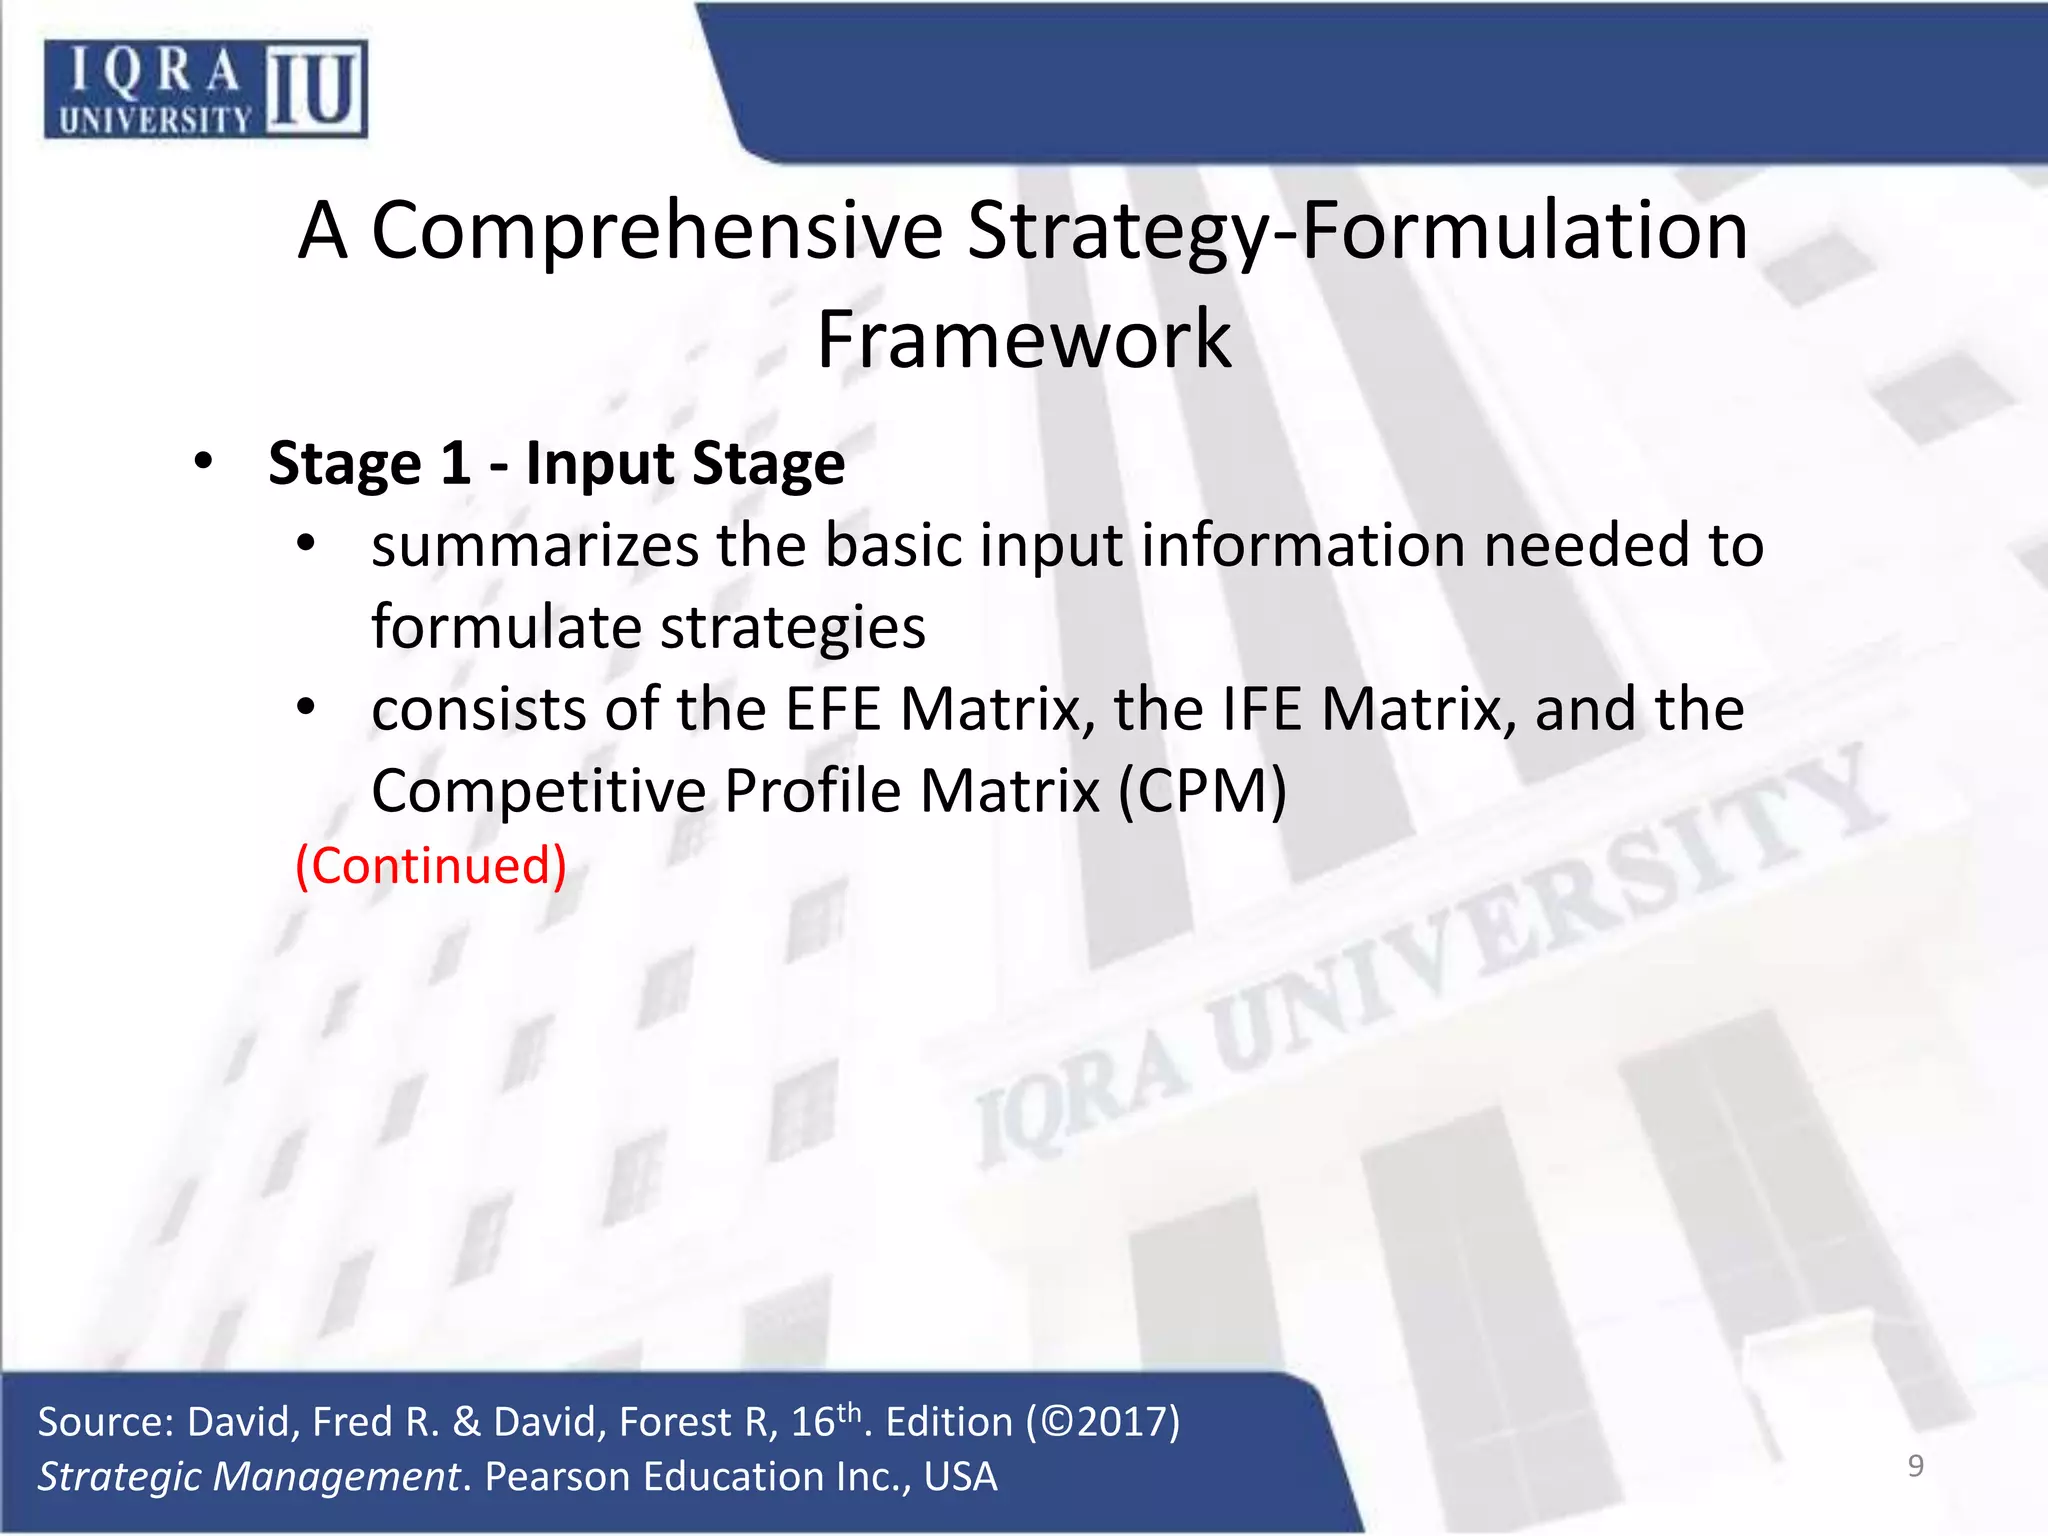
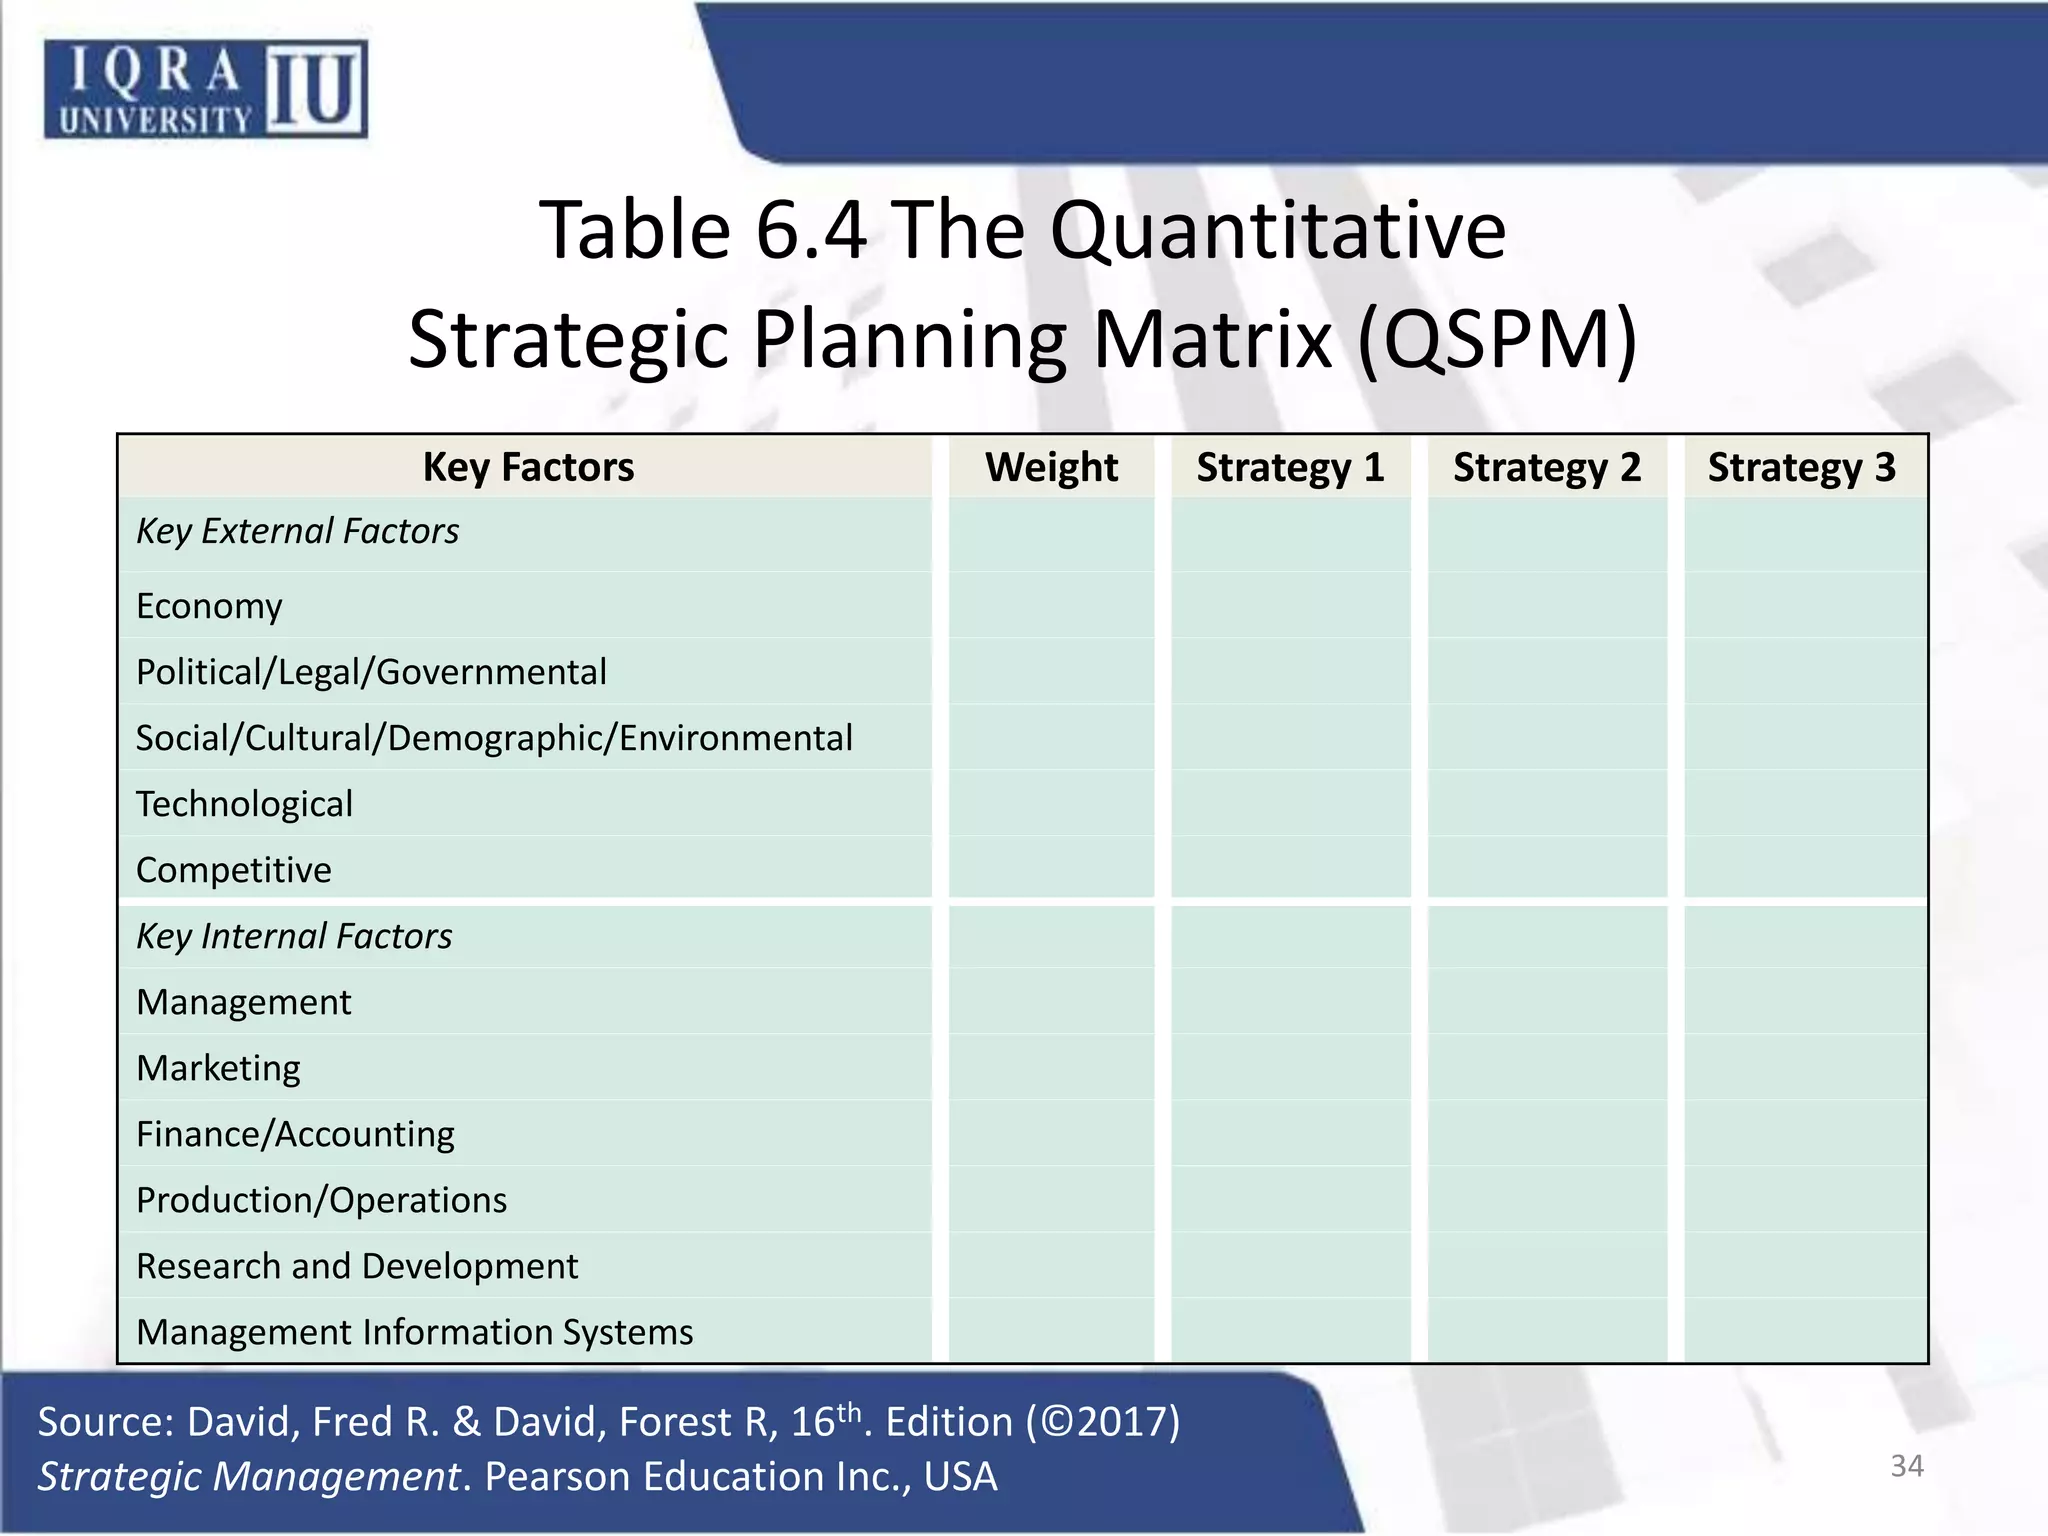
Unit 6
Strategy Analysis and Choice
Source: David, Fred R. & David, Forest R, 16th. Edition (©2017)
Strategic Management. Pearson Education Inc., USA
Learning Objectives
6.1 Describe the strategy analysis and choice process.
6.2 Diagram and explain the three-stage strategy-
formulation analytical framework.
6.3 Construct and apply the Strengths-Weaknesses-
Opportunities-Threats (SWOT) Matrix.
6.4 Construct and apply the Strategic Position and Action
Evaluation (SPACE) Matrix.
6.5 Construct and apply the Boston Consulting Group (BCG)
Matrix.
6.6 Construct and apply the Internal-External (IE) Matrix.
(Continued)
Source: David, Fred R. & David, Forest R, 16th. Edition (©2017)
Strategic Management. Pearson Education Inc., USA 2
Learning Objectives
6.7 Construct and apply the Grand Strategy Matrix.
6.8 Construct and apply the Quantitative Strategic Planning
Matrix (QSPM).
6.9 Explain how to estimate costs associated with
recommendations.
6.10 Discuss the role of organizational culture in strategic
analysis and choice.
6.11 Identify and discuss important political considerations
in strategy analysis and choice.
Source: David, Fred R. & David, Forest R, 16th. Edition (©2017)
Strategic Management. Pearson Education Inc., USA 3
Figure 6.1 The Comprehensive, Integrative
Strategic-Management Model
Source: Fred R. David, “How Companies Define Their Mission,”
Long Range Planning 22, no. 1 (February 1989): 91 4
The Process of Generating and
Selecting Strategies
• A manageable set of the most attractive alternative
strategies must be developed.
• The advantages, disadvantages, trade-offs, costs, and
benefits of these strategies should be determined.
Source: David, Fred R. & David, Forest R, 16th. Edition (©2017)
Strategic Management. Pearson Education Inc., USA 5
The Process of Generating and
Selecting Strategies
• Identifying and evaluating alternative strategies should
involve many of the managers and employees who earlier
assembled the organizational vision and mission
statements, performed the external audit, and conducted
the internal audit.
Source: David, Fred R. & David, Forest R, 16th. Edition (©2017)
Strategic Management. Pearson Education Inc., USA 6
The Process of Generating and
Selecting Strategies
• Alternative strategies proposed by participants should be
considered and discussed in a series of meetings.
• Proposed strategies should be listed in writing.
• When all feasible strategies identified by participants are
given and understood, the strategies should be ranked in
order of attractiveness.
Source: David, Fred R. & David, Forest R, 16th. Edition (©2017)
Strategic Management. Pearson Education Inc., USA 7
Figure 6.2 The Strategy-Formulation
Analytical Framework
Source: David, Fred R. & David, Forest R, 16th. Edition (©2017)
Strategic Management. Pearson Education Inc., USA 8
A Comprehensive Strategy-Formulation
Framework
• Stage 1 - Input Stage
• summarizes the basic input information needed to
formulate strategies
• consists of the EFE Matrix, the IFE Matrix, and the
Competitive Profile Matrix (CPM)
(Continued)
Source: David, Fred R. & David, Forest R, 16th. Edition (©2017)
Strategic Management. Pearson Education Inc., USA 9
A Comprehensive Strategy-Formulation
Framework
• Stage 2 - Matching Stage
• focuses on generating feasible alternative strategies
by aligning key external and internal factors
• techniques include the Strengths-Weaknesses-
Opportunities-Threats (SWOT) Matrix, the Strategic
Position and Action Evaluation (SPACE) Matrix, the
Boston Consulting Group (BCG) Matrix, the Internal-
External (IE) Matrix, and the Grand Strategy Matrix
(Continued)
Source: David, Fred R. & David, Forest R, 16th. Edition (©2017)
Strategic Management. Pearson Education Inc., USA 10
A Comprehensive Strategy-Formulation
Framework
• Stage 3 - Decision Stage
• involves the Quantitative Strategic Planning Matrix
(QSPM)
• reveals the relative attractiveness of alternative
strategies and thus provides objective basis for
selecting specific strategies
Source: David, Fred R. & David, Forest R, 16th. Edition (©2017)
Strategic Management. Pearson Education Inc., USA 11
The Matching Stage
• The Strengths-Weaknesses-Opportunities-Threats (SWOT)
Matrix helps managers develop four types of strategies:
• SO (strengths-opportunities) Strategies
• WO (weaknesses-opportunities) Strategies
• ST (strengths-threats) Strategies
• WT (weaknesses-threats) Strategies
(Continued)
Source: David, Fred R. & David, Forest R, 16th. Edition (©2017)
Strategic Management. Pearson Education Inc., USA 12
The Matching Stage
• SO Strategies
• use a firm’s internal strengths to take advantage of
external opportunities
• WO Strategies
• aim at improving internal weaknesses by taking
advantage of external opportunities
(Continued)
Source: David, Fred R. & David, Forest R, 16th. Edition (©2017)
Strategic Management. Pearson Education Inc., USA 13
The Matching Stage
• ST Strategies
• use a firm's strengths to avoid or reduce the impact of
external threats
• WT Strategies
• defensive tactics directed at reducing internal
weakness and avoiding external threats
Source: David, Fred R. & David, Forest R, 16th. Edition (©2017)
Strategic Management. Pearson Education Inc., USA 14
Figure 6.3 A SWOT Matrix for a Retail Computer Store
Source: David, Fred R. & David, Forest R, 16th. Edition (©2017)
Strategic Management. Pearson Education Inc., USA
SWOT Matrix
1. List the firm’s key external opportunities.
2. List the firm’s key external threats.
3. List the firm’s key internal strengths.
4. List the firm’s key internal weaknesses.
5. Match internal strengths with external opportunities, and
record the resultant SO strategies.
(Continued)
Source: David, Fred R. & David, Forest R, 16th. Edition (©2017)
Strategic Management. Pearson Education Inc., USA 16
SWOT Matrix
6. Match internal weaknesses with external opportunities,
and record the resultant WO strategies.
7. Match internal strengths with external threats, and record
the resultant ST strategies.
8. Match internal weaknesses with external threats, and
record the resultant WT strategies.
Source: David, Fred R. & David, Forest R, 16th. Edition (©2017)
Strategic Management. Pearson Education Inc., USA 17
The Boston Consulting Group (BCG) Matrix
• BCG Matrix
• graphically portrays differences among divisions in
terms of relative market share position and industry
growth rate
• allows a multidivisional organization to manage its
portfolio of businesses by examining the relative
market share position and the industry growth rate of
each division relative to all other divisions in the
organization
Source: David, Fred R. & David, Forest R, 16th. Edition (©2017)
Strategic Management. Pearson Education Inc., USA 18
Copyright © 2020, 2017, 2015 Pearson Education, Inc. All Rights Reserved
Figure 6.7 The BCG Matrix
Source: Based on the BCG Portfolio Matrix from the Product Portfolio Matrix, © 1970, The Boston Consulting Group.
The Boston Consulting Group (BCG) Matrix
• Question Marks - Quadrant I
• Organization must decide whether to strengthen
them by pursuing an intensive strategy (market
penetration, market development, or product
development) or to sell them
• Stars - Quadrant II
• represent the organization’s best long-run
opportunities for growth and profitability
(Continued)
Source: David, Fred R. & David, Forest R, 16th. Edition (©2017)
Strategic Management. Pearson Education Inc., USA 20
The Boston Consulting Group (BCG) Matrix
• Cash Cows - Quadrant III
• generate cash in excess of their needs
• should be managed to maintain their strong position
for as long as possible
• Dogs - Quadrant IV
• compete in a slow- or no-market-growth industry
• businesses are often liquidated, divested, or trimmed
down through retrenchment
Source: David, Fred R. & David, Forest R, 16th. Edition (©2017)
Strategic Management. Pearson Education Inc., USA 21
The Boston Consulting Group (BCG) Matrix
• The major benefit of the BCG Matrix is that it draws
attention to the cash flow, investment characteristics, and
needs of an organization's various divisions.
Source: David, Fred R. & David, Forest R, 16th. Edition (©2017)
Strategic Management. Pearson Education Inc., USA 22
Figure 6.8 An Example BCG Matrix
Source: David, Fred R. & David, Forest R, 16th. Edition (©2017)
Strategic Management. Pearson Education Inc., USA 23
Figure 6.9 An Example BCG Matrix
Source: David, Fred R. & David, Forest R, 16th. Edition (©2017)
Strategic Management. Pearson Education Inc., USA 24
Figure 6.10 The Internal-External (IE) Matrix
Source: David, Fred R. & David, Forest R, 16th. Edition (©2017)
Strategic Management. Pearson Education Inc., USA 25
The Internal-External (IE) Matrix
• The IE Matrix is based on two key dimensions: the IFE
total weighted scores on the x-axis and the EFE total
weighted scores on the y-axis
• Three Major Regions
• Grow and build
• Hold and maintain
• Harvest or divest
Source: David, Fred R. & David, Forest R, 16th. Edition (©2017)
Strategic Management. Pearson Education Inc., USA 26
Figure 6.11 An Example IE Matrix
Source: David, Fred R. & David, Forest R, 16th. Edition (©2017)
Strategic Management. Pearson Education Inc., USA 27
Figure 6.12 The IE Matrix
• A
Source: David, Fred R. & David, Forest R, 16th. Edition (©2017)
Strategic Management. Pearson Education Inc., USA 28
The Grand Strategy Matrix
• Grand Strategy Matrix
• based on two evaluative dimensions: competitive
position and market (industry) growth
Source: David, Fred R. & David, Forest R, 16th. Edition (©2017)
Strategic Management. Pearson Education Inc., USA 29
Figure 6.13 The Grand Strategy Matrix
• A
Source: David, Fred R. & David, Forest R, 16th. Edition (©2017)
Strategic Management. Pearson Education Inc., USA 30
The Grand Strategy Matrix
• Quadrant I
• continued concentration on current markets (market
penetration and market development) and products
(product development) is an appropriate strategy
• Quadrant II
• unable to compete effectively
• need to determine why the firm's current approach is
ineffective and how the company can best change to
improve its competitiveness
(Continued)
Source: David, Fred R. & David, Forest R, 16th. Edition (©2017)
Strategic Management. Pearson Education Inc., USA 31
The Grand Strategy Matrix
• Quadrant III
• must make some drastic changes quickly to avoid
further decline and possible liquidation
• Extensive cost and asset reduction (retrenchment)
should be pursued first
• Quadrant IV
• have characteristically high cash-flow levels and
limited internal growth needs and often can pursue
related or unrelated diversification successfully
Source: David, Fred R. & David, Forest R, 16th. Edition (©2017)
Strategic Management. Pearson Education Inc., USA 32
The Quantitative Strategic Planning Matrix
• Quantitative Strategic Planning Matrix (QSPM)
• objectively indicates which alternative strategies are
best
• uses input from Stage 1 analyses and matching results
from Stage 2 analyses to decide objectively among
alternative strategies
Source: David, Fred R. & David, Forest R, 16th. Edition (©2017)
Strategic Management. Pearson Education Inc., USA 33
Table 6.4 The Quantitative
Strategic Planning Matrix (QSPM)
• A
Source: David, Fred R. & David, Forest R, 16th. Edition (©2017)
Strategic Management. Pearson Education Inc., USA 34
Key Factors Weight Strategy 1 Strategy 2 Strategy 3
Key External Factors
Economy
Political/Legal/Governmental
Social/Cultural/Demographic/Environmental
Technological
Competitive
Key Internal Factors
Management
Marketing
Finance/Accounting
Production/Operations
Research and Development
Management Information Systems
Steps in a QSPM
1. Make a list of the firm’s key external opportunities and
threats and internal strengths and weaknesses in the
left column.
2. Assign weights to each key external and internal factor.
3. Examine the Stage 2 (matching) matrices, and identify
alternative strategies that the organization should
consider implementing.
4. Determine the Attractiveness Scores (AS).
5. Compute the Total Attractiveness Scores.
6. Compute the Sum Total Attractiveness Score.
Source: David, Fred R. & David, Forest R, 16th. Edition (©2017)
Strategic Management. Pearson Education Inc., USA 35
Positive Features of the QSPM
• Sets of strategies can be examined sequentially or
simultaneously
• Requires strategists to integrate pertinent external and
internal factors into the decision process
• Can be adapted for use by small and large for-profit and
nonprofit organizations
Source: David, Fred R. & David, Forest R, 16th. Edition (©2017)
Strategic Management. Pearson Education Inc., USA 36
Limitations of the QSPM
• Always requires informed judgments
• It is only as good as the prerequisite information and
matching analyses on which it is based
Source: David, Fred R. & David, Forest R, 16th. Edition (©2017)
Strategic Management. Pearson Education Inc., USA 37
Table 6.5 A QSPM for a Retail Computer Store
Source: David, Fred R. & David, Forest R, 16th. Edition (©2017)
Strategic Management. Pearson Education Inc., USA 38
Table 6.5 A QSPM for a Retail Computer Store
Source: David, Fred R. & David, Forest R, 16th. Edition (©2017)
Strategic Management. Pearson Education Inc., USA 39
Table 6.5 A QSPM for a Retail Computer Store
Source: David, Fred R. & David, Forest R, 16th. Edition (©2017)
Strategic Management. Pearson Education Inc., USA 40
Estimating Costs Associated
With Recommendations
• The term recommendation is used to refer to “any
alternative strategy that is selected for implementation.”
• Due to monetary and/or non-monetary constraints, no
firm can implement all alternative strategies proposed in
the matching matrices, so firms utilize the QSPM and
expert judgment to select particular strategies.
Source: David, Fred R. & David, Forest R, 16th. Edition (©2017)
Strategic Management. Pearson Education Inc., USA 41
The Culture and Politics of Strategy Choice
• Strategies that require fewer cultural changes may be
more attractive because extensive changes can take
considerable time and effort
• Political maneuvering consumes valuable time, subverts
organizational objectives, diverts human energy, and
results in the loss of some valuable employees
• Political biases and personal preferences get unduly
embedded in strategy choice decisions
Source: David, Fred R. & David, Forest R, 16th. Edition (©2017)
Strategic Management. Pearson Education Inc., USA 42
Session Ends
Disclaimer
The information provided in this module is derived from Pearson
Education Inc., USA, and other sources. All information is provided in
good faith for educational purposes only. Iqra University claims no
ownership of this information, and will not be liable for any claims
arising thereof, now or in the future.

Strategy Analysis and Choice.pptx

  • 1.
    Unit 6 Strategy Analysisand Choice Source: David, Fred R. & David, Forest R, 16th. Edition (©2017) Strategic Management. Pearson Education Inc., USA
  • 2.
    Learning Objectives 6.1 Describethe strategy analysis and choice process. 6.2 Diagram and explain the three-stage strategy- formulation analytical framework. 6.3 Construct and apply the Strengths-Weaknesses- Opportunities-Threats (SWOT) Matrix. 6.4 Construct and apply the Strategic Position and Action Evaluation (SPACE) Matrix. 6.5 Construct and apply the Boston Consulting Group (BCG) Matrix. 6.6 Construct and apply the Internal-External (IE) Matrix. (Continued) Source: David, Fred R. & David, Forest R, 16th. Edition (©2017) Strategic Management. Pearson Education Inc., USA 2
  • 3.
    Learning Objectives 6.7 Constructand apply the Grand Strategy Matrix. 6.8 Construct and apply the Quantitative Strategic Planning Matrix (QSPM). 6.9 Explain how to estimate costs associated with recommendations. 6.10 Discuss the role of organizational culture in strategic analysis and choice. 6.11 Identify and discuss important political considerations in strategy analysis and choice. Source: David, Fred R. & David, Forest R, 16th. Edition (©2017) Strategic Management. Pearson Education Inc., USA 3
  • 4.
    Figure 6.1 TheComprehensive, Integrative Strategic-Management Model Source: Fred R. David, “How Companies Define Their Mission,” Long Range Planning 22, no. 1 (February 1989): 91 4
  • 5.
    The Process ofGenerating and Selecting Strategies • A manageable set of the most attractive alternative strategies must be developed. • The advantages, disadvantages, trade-offs, costs, and benefits of these strategies should be determined. Source: David, Fred R. & David, Forest R, 16th. Edition (©2017) Strategic Management. Pearson Education Inc., USA 5
  • 6.
    The Process ofGenerating and Selecting Strategies • Identifying and evaluating alternative strategies should involve many of the managers and employees who earlier assembled the organizational vision and mission statements, performed the external audit, and conducted the internal audit. Source: David, Fred R. & David, Forest R, 16th. Edition (©2017) Strategic Management. Pearson Education Inc., USA 6
  • 7.
    The Process ofGenerating and Selecting Strategies • Alternative strategies proposed by participants should be considered and discussed in a series of meetings. • Proposed strategies should be listed in writing. • When all feasible strategies identified by participants are given and understood, the strategies should be ranked in order of attractiveness. Source: David, Fred R. & David, Forest R, 16th. Edition (©2017) Strategic Management. Pearson Education Inc., USA 7
  • 8.
    Figure 6.2 TheStrategy-Formulation Analytical Framework Source: David, Fred R. & David, Forest R, 16th. Edition (©2017) Strategic Management. Pearson Education Inc., USA 8
  • 9.
    A Comprehensive Strategy-Formulation Framework •Stage 1 - Input Stage • summarizes the basic input information needed to formulate strategies • consists of the EFE Matrix, the IFE Matrix, and the Competitive Profile Matrix (CPM) (Continued) Source: David, Fred R. & David, Forest R, 16th. Edition (©2017) Strategic Management. Pearson Education Inc., USA 9
  • 10.
    A Comprehensive Strategy-Formulation Framework •Stage 2 - Matching Stage • focuses on generating feasible alternative strategies by aligning key external and internal factors • techniques include the Strengths-Weaknesses- Opportunities-Threats (SWOT) Matrix, the Strategic Position and Action Evaluation (SPACE) Matrix, the Boston Consulting Group (BCG) Matrix, the Internal- External (IE) Matrix, and the Grand Strategy Matrix (Continued) Source: David, Fred R. & David, Forest R, 16th. Edition (©2017) Strategic Management. Pearson Education Inc., USA 10
  • 11.
    A Comprehensive Strategy-Formulation Framework •Stage 3 - Decision Stage • involves the Quantitative Strategic Planning Matrix (QSPM) • reveals the relative attractiveness of alternative strategies and thus provides objective basis for selecting specific strategies Source: David, Fred R. & David, Forest R, 16th. Edition (©2017) Strategic Management. Pearson Education Inc., USA 11
  • 12.
    The Matching Stage •The Strengths-Weaknesses-Opportunities-Threats (SWOT) Matrix helps managers develop four types of strategies: • SO (strengths-opportunities) Strategies • WO (weaknesses-opportunities) Strategies • ST (strengths-threats) Strategies • WT (weaknesses-threats) Strategies (Continued) Source: David, Fred R. & David, Forest R, 16th. Edition (©2017) Strategic Management. Pearson Education Inc., USA 12
  • 13.
    The Matching Stage •SO Strategies • use a firm’s internal strengths to take advantage of external opportunities • WO Strategies • aim at improving internal weaknesses by taking advantage of external opportunities (Continued) Source: David, Fred R. & David, Forest R, 16th. Edition (©2017) Strategic Management. Pearson Education Inc., USA 13
  • 14.
    The Matching Stage •ST Strategies • use a firm's strengths to avoid or reduce the impact of external threats • WT Strategies • defensive tactics directed at reducing internal weakness and avoiding external threats Source: David, Fred R. & David, Forest R, 16th. Edition (©2017) Strategic Management. Pearson Education Inc., USA 14
  • 15.
    Figure 6.3 ASWOT Matrix for a Retail Computer Store Source: David, Fred R. & David, Forest R, 16th. Edition (©2017) Strategic Management. Pearson Education Inc., USA
  • 16.
    SWOT Matrix 1. Listthe firm’s key external opportunities. 2. List the firm’s key external threats. 3. List the firm’s key internal strengths. 4. List the firm’s key internal weaknesses. 5. Match internal strengths with external opportunities, and record the resultant SO strategies. (Continued) Source: David, Fred R. & David, Forest R, 16th. Edition (©2017) Strategic Management. Pearson Education Inc., USA 16
  • 17.
    SWOT Matrix 6. Matchinternal weaknesses with external opportunities, and record the resultant WO strategies. 7. Match internal strengths with external threats, and record the resultant ST strategies. 8. Match internal weaknesses with external threats, and record the resultant WT strategies. Source: David, Fred R. & David, Forest R, 16th. Edition (©2017) Strategic Management. Pearson Education Inc., USA 17
  • 18.
    The Boston ConsultingGroup (BCG) Matrix • BCG Matrix • graphically portrays differences among divisions in terms of relative market share position and industry growth rate • allows a multidivisional organization to manage its portfolio of businesses by examining the relative market share position and the industry growth rate of each division relative to all other divisions in the organization Source: David, Fred R. & David, Forest R, 16th. Edition (©2017) Strategic Management. Pearson Education Inc., USA 18
  • 19.
    Copyright © 2020,2017, 2015 Pearson Education, Inc. All Rights Reserved Figure 6.7 The BCG Matrix Source: Based on the BCG Portfolio Matrix from the Product Portfolio Matrix, © 1970, The Boston Consulting Group.
  • 20.
    The Boston ConsultingGroup (BCG) Matrix • Question Marks - Quadrant I • Organization must decide whether to strengthen them by pursuing an intensive strategy (market penetration, market development, or product development) or to sell them • Stars - Quadrant II • represent the organization’s best long-run opportunities for growth and profitability (Continued) Source: David, Fred R. & David, Forest R, 16th. Edition (©2017) Strategic Management. Pearson Education Inc., USA 20
  • 21.
    The Boston ConsultingGroup (BCG) Matrix • Cash Cows - Quadrant III • generate cash in excess of their needs • should be managed to maintain their strong position for as long as possible • Dogs - Quadrant IV • compete in a slow- or no-market-growth industry • businesses are often liquidated, divested, or trimmed down through retrenchment Source: David, Fred R. & David, Forest R, 16th. Edition (©2017) Strategic Management. Pearson Education Inc., USA 21
  • 22.
    The Boston ConsultingGroup (BCG) Matrix • The major benefit of the BCG Matrix is that it draws attention to the cash flow, investment characteristics, and needs of an organization's various divisions. Source: David, Fred R. & David, Forest R, 16th. Edition (©2017) Strategic Management. Pearson Education Inc., USA 22
  • 23.
    Figure 6.8 AnExample BCG Matrix Source: David, Fred R. & David, Forest R, 16th. Edition (©2017) Strategic Management. Pearson Education Inc., USA 23
  • 24.
    Figure 6.9 AnExample BCG Matrix Source: David, Fred R. & David, Forest R, 16th. Edition (©2017) Strategic Management. Pearson Education Inc., USA 24
  • 25.
    Figure 6.10 TheInternal-External (IE) Matrix Source: David, Fred R. & David, Forest R, 16th. Edition (©2017) Strategic Management. Pearson Education Inc., USA 25
  • 26.
    The Internal-External (IE)Matrix • The IE Matrix is based on two key dimensions: the IFE total weighted scores on the x-axis and the EFE total weighted scores on the y-axis • Three Major Regions • Grow and build • Hold and maintain • Harvest or divest Source: David, Fred R. & David, Forest R, 16th. Edition (©2017) Strategic Management. Pearson Education Inc., USA 26
  • 27.
    Figure 6.11 AnExample IE Matrix Source: David, Fred R. & David, Forest R, 16th. Edition (©2017) Strategic Management. Pearson Education Inc., USA 27
  • 28.
    Figure 6.12 TheIE Matrix • A Source: David, Fred R. & David, Forest R, 16th. Edition (©2017) Strategic Management. Pearson Education Inc., USA 28
  • 29.
    The Grand StrategyMatrix • Grand Strategy Matrix • based on two evaluative dimensions: competitive position and market (industry) growth Source: David, Fred R. & David, Forest R, 16th. Edition (©2017) Strategic Management. Pearson Education Inc., USA 29
  • 30.
    Figure 6.13 TheGrand Strategy Matrix • A Source: David, Fred R. & David, Forest R, 16th. Edition (©2017) Strategic Management. Pearson Education Inc., USA 30
  • 31.
    The Grand StrategyMatrix • Quadrant I • continued concentration on current markets (market penetration and market development) and products (product development) is an appropriate strategy • Quadrant II • unable to compete effectively • need to determine why the firm's current approach is ineffective and how the company can best change to improve its competitiveness (Continued) Source: David, Fred R. & David, Forest R, 16th. Edition (©2017) Strategic Management. Pearson Education Inc., USA 31
  • 32.
    The Grand StrategyMatrix • Quadrant III • must make some drastic changes quickly to avoid further decline and possible liquidation • Extensive cost and asset reduction (retrenchment) should be pursued first • Quadrant IV • have characteristically high cash-flow levels and limited internal growth needs and often can pursue related or unrelated diversification successfully Source: David, Fred R. & David, Forest R, 16th. Edition (©2017) Strategic Management. Pearson Education Inc., USA 32
  • 33.
    The Quantitative StrategicPlanning Matrix • Quantitative Strategic Planning Matrix (QSPM) • objectively indicates which alternative strategies are best • uses input from Stage 1 analyses and matching results from Stage 2 analyses to decide objectively among alternative strategies Source: David, Fred R. & David, Forest R, 16th. Edition (©2017) Strategic Management. Pearson Education Inc., USA 33
  • 34.
    Table 6.4 TheQuantitative Strategic Planning Matrix (QSPM) • A Source: David, Fred R. & David, Forest R, 16th. Edition (©2017) Strategic Management. Pearson Education Inc., USA 34 Key Factors Weight Strategy 1 Strategy 2 Strategy 3 Key External Factors Economy Political/Legal/Governmental Social/Cultural/Demographic/Environmental Technological Competitive Key Internal Factors Management Marketing Finance/Accounting Production/Operations Research and Development Management Information Systems
  • 35.
    Steps in aQSPM 1. Make a list of the firm’s key external opportunities and threats and internal strengths and weaknesses in the left column. 2. Assign weights to each key external and internal factor. 3. Examine the Stage 2 (matching) matrices, and identify alternative strategies that the organization should consider implementing. 4. Determine the Attractiveness Scores (AS). 5. Compute the Total Attractiveness Scores. 6. Compute the Sum Total Attractiveness Score. Source: David, Fred R. & David, Forest R, 16th. Edition (©2017) Strategic Management. Pearson Education Inc., USA 35
  • 36.
    Positive Features ofthe QSPM • Sets of strategies can be examined sequentially or simultaneously • Requires strategists to integrate pertinent external and internal factors into the decision process • Can be adapted for use by small and large for-profit and nonprofit organizations Source: David, Fred R. & David, Forest R, 16th. Edition (©2017) Strategic Management. Pearson Education Inc., USA 36
  • 37.
    Limitations of theQSPM • Always requires informed judgments • It is only as good as the prerequisite information and matching analyses on which it is based Source: David, Fred R. & David, Forest R, 16th. Edition (©2017) Strategic Management. Pearson Education Inc., USA 37
  • 38.
    Table 6.5 AQSPM for a Retail Computer Store Source: David, Fred R. & David, Forest R, 16th. Edition (©2017) Strategic Management. Pearson Education Inc., USA 38
  • 39.
    Table 6.5 AQSPM for a Retail Computer Store Source: David, Fred R. & David, Forest R, 16th. Edition (©2017) Strategic Management. Pearson Education Inc., USA 39
  • 40.
    Table 6.5 AQSPM for a Retail Computer Store Source: David, Fred R. & David, Forest R, 16th. Edition (©2017) Strategic Management. Pearson Education Inc., USA 40
  • 41.
    Estimating Costs Associated WithRecommendations • The term recommendation is used to refer to “any alternative strategy that is selected for implementation.” • Due to monetary and/or non-monetary constraints, no firm can implement all alternative strategies proposed in the matching matrices, so firms utilize the QSPM and expert judgment to select particular strategies. Source: David, Fred R. & David, Forest R, 16th. Edition (©2017) Strategic Management. Pearson Education Inc., USA 41
  • 42.
    The Culture andPolitics of Strategy Choice • Strategies that require fewer cultural changes may be more attractive because extensive changes can take considerable time and effort • Political maneuvering consumes valuable time, subverts organizational objectives, diverts human energy, and results in the loss of some valuable employees • Political biases and personal preferences get unduly embedded in strategy choice decisions Source: David, Fred R. & David, Forest R, 16th. Edition (©2017) Strategic Management. Pearson Education Inc., USA 42
  • 43.
  • 44.
    Disclaimer The information providedin this module is derived from Pearson Education Inc., USA, and other sources. All information is provided in good faith for educational purposes only. Iqra University claims no ownership of this information, and will not be liable for any claims arising thereof, now or in the future.

Editor's Notes

  • #20 Based on each division’s respective (x, y) coordinate, each segment can be properly positioned (centered) in a BCG Matrix. Each circle represents a separate division. The size of the circle corresponds to the proportion of corporate revenue generated by that business unit, and the pie slice indicates the proportion of corporate profits generated by that division.