This document contains data and questions from multiple exercises related to statistical analysis and hypothesis testing. It includes data on faculty numbers at colleges, number of jobs for retired men, day care tuition costs, state gasoline taxes, dance company student numbers, beliefs in haunted places, moviegoer habits, government employee salaries, student expenditures, park acreages, chocolate chip cookie calories, percentages of female physicians, doctoral student salaries, teacher salaries in different states, home prices in different municipalities, ages of resident and commuter college students, test scores for novels read vs watched, obstacle course times before and after drinking an energy drink, number of mistakes by music students before and after practice, and percentages of undergraduate women and men receiving financial aid. It
Please Subscribe to this Channel for more solutions and lectures
http://www.youtube.com/onlineteaching
Chapter 4: Probability
4.3: Complements and Conditional Probability, and Bayes' Theorem
Hypothesis, Characteristics, Basic concepts concerning testing of hypothesis, The level of significance, testing of hypothesis, Type I error and Type II error, One tailed test and two tailed test, steps involved in hypothesis testing, flow diagram for hypothesis testing
This presentation discusses the following topics:
Hypothesis Test
Potential Outcomes in Hypothesis Testing
Significance level
P-value
Sampling Errors
Type I Error
What causes Type I errors?
What causes Type II errors?
4 possible outcomes
Exercise 7-1 Q # 10 Number of faculty. the numbers of faculty .docxgitagrimston
Exercise 7-1
Q # 10
Number of faculty. the numbers of faculty at 32 randomly selected state-controlled colleges and universities with enrollment under 12,000 students are shown below. use these data to estimate the mean number of faculty at all state-controlled colleges and universities with enrollment under 12,000 with 92% confidence. assume .
211
384
396
211
224
337
395
121
356
621
367
408
515
280
289
180
431
176
318
836
203
374
224
121
412
134
539
471
638
425
159
324
Q # 14
Number of jobs. a sociologist found that in a sample of 50 retired men, the average number of jobs they had during their lifetimes was 7.2. the population standard deviation is 2.1.
a. find the best point to estimate of the population men.
b.find the 95 % confidence interval of the mean number of jobs.
c.find the 99% confidence interval of the mean number of jobs.
d. which is smaller? explain why.
Q # 18
Day care tuition. a random sample of 50 four-year-olds attending day care centers provided a yearly tuition average of $3987 and the population standard deviation of $630. find the 90% confidence interval of the true mean. if a day care center were starting up and wanted to keep tuition low. what would be a reasonable amount to charge?
Exercise 7-2
Q # 8
State Gasoline Taxes. a random sample of state gasoline taxes ( in cents ) is shown here for 12 states. use the data to estimate the true population mean gasoline tax with 90% confidence. does your interval contain the national average of 44.7 cents?
38.4
40.9
67
32.5
51.5
43.4
38
43.4
50.7
35.4
39.3
41.4
Q # 10
Dance Company Students. the number of students who belong to dance company at each of several randomly selected small universities is shown below. estimate the true population mean size of a university dance company with 99% confidence.
21
25
32
22
28
30
29
30
47
26
35
26
35
26
28
28
32
27
40
Exercise 7-3
Q # 6
Belief in haunted places. a random sample of 205 college students were asked if they believed that places could be haunted, and 65 responded yes. estimate the true proportion of college students who believed in the possibility of haunted places with 99% confidence. according to time magazine,37% of americans believe that places can be haunted.
Q # 14
Fighting U.S hunger. in a poll of 1000 likely voters, 560 say that the united states spends too little on fighting hunger at home. find a 95% confidence interval for the true proportion of voters who feel this way.
Exercise 8-2
Q # 4
Moviegoers. the average moviegoer sees 8.5 movies a year. a moviegoer is defined as a person who sees at least one movie in a theater in a 12 month period. a random sample of 40 moviegoers from a large university revealed that the average number of movies seen per person was 9.6. The population standard deviation is 3.2 movies. at the 0.05 level of significance, can it be concluded that this represents a difference from the national average?
Q # 8
Salaries of government employees. the mean salary o ...
For these problems, please use Excel to show your work, and submit.docxtemplestewart19
For these problems, please use Excel to show your work, and submit the Excel spreadsheet along with your completed assignment.
Find the point estimate of the population mean and the margin of error for a 90% confidence interval for the following drive times (in minutes) for commuters to a college.
35
40
47
22
17
19
36
44
65
55
22
23
16
46
44
38
29
22
37
16
8
15
27
41
45
17
11
45
63
17
28
19
64
55
53
50
Answer:
X
=
S
=
1231
= 34.1 Sample Mean
n
36
Use the results from the above data (#1) and determine the minimum survey size that is necessary to be 95% confident that the sample mean drive time is within 10 minutes of the actual mean commuting time.
In a random sample of 35 tractors, the annual cost of maintenance was $4,425 and the standard deviation was $775. Construct a 90% confidence interval for this. Assume the annual maintenance costs are normally distributed.
Answer:
90% = mean ± 1.645 SEm
SEm = SD/√n
I used the table in the back of my statistics text labeled "areas under normal distribution" to find the proportion/probability (±5%) to get Z = 1.645. I assume that you have a similar table available.
The following data represents the number of points scored by players on a high school basketball team this season.
Player 1
68
Player 6
128
Player 2
82
Player 7
66
Player 3
145
Player 8
54
Player 4
111
Player 9
221
Player 5
97
Player 10
99
Find the sample mean and the sample standard deviation.
Answer:
Sample Mean
1071
= 107.1
Sample Standard Deviation S = 3.16
10
Construct a 90% confidence interval for the population mean and interpret the results. Assume the population of the data set is normally distributed.
For the following statements, state the null and alternative hypotheses and identify which represents the claim. Determine when a type I or type II error occurs for a hypothesis test of the claim. Determine whether the hypothesis test is left-tailed, right-tailed, or two-tailed, and explain your reasoning. Explain how you should interpret a decision that rejects the null hypothesis. Explain how you would interpret a decision that fails to reject the null hypothesis.
It is reported that the number of residents in Wisconsin who support plans to recall the governor is 48%.
An Amish bakery store states that the average shelf life of their fresh baked goods is seven days.
A soda manufacturer states that the average number of calories in the regular soda is less than 150 calories per serving.
The census figures show that the average income for a family in a rural region is approximately $34,860 per year. A random sample has a mean income of $33,566 per year, with a standard deviation of $1,245. At a sig. level of .0.01 is there enough evidence to reject the claim? Explain.
An advertising firm claims that the average expenditure for advertising for their customers is at least $12,500.
For more classes visit
www.snaptutorial.com
Q1
The Director of Golf for a local course wants to study the number of rounds played by members on weekdays. He gathered the sample information shown below for 520 rounds. At the .05 significance level, is there a difference in the number of rounds played by day of the week?
For more course tutorials visit
www.qnt351.com
Q1 The Director of Golf for a local course wants to study the number of rounds played by members on weekdays. He gathered the sample information shown below for 520 rounds.
For more course tutorials visit
www.qnt351.com
Q1 The Director of Golf for a local course wants to study the number of rounds played by members on weekdays. He gathered the sample information shown below for 520 rounds
For more classes visit
www.snaptutorial.com
Q1
The Director of Golf for a local course wants to study the number of rounds played by members on weekdays. He gathered the sample information shown below for 520 rounds. At the .05 significance level, is there a difference in the number of rounds played by day of the week?
2An auditor for American Health Insurance reports that 20% of policyholders submit a claim during the year. 15 policyholders are selected randomly. What is the probability that at least 3 of them submitted a claim the previous year?
For more classes visit
www.snaptutorial.com
Q1
The Director of Golf for a local course wants to study the number of rounds played by members on weekdays.
For more course tutorials visit
www.qnt351.com
Q1 The Director of Golf for a local course wants to study the number of rounds played by members on weekdays. He gathered the sample information shown below for 520 rounds.
QNT 351 PAPER Education for Service--qnt351paper.commamata53
FOR MORE CLASSES VISIT
www.qnt351paper.com
Q1 The Director of Golf for a local course wants to study the number of rounds played by members on weekdays. He gathered the sample information shown below for 520 rounds. At the .05 significance level, is there a difference in the number of rounds played by day of the week?
STAT225 Introduction to Statistics in the Behavioral Sciences.docxdessiechisomjj4
STAT225: Introduction to Statistics in the Behavioral Sciences
1. In a school election, five people run for student body president. The actual number of votes for each candidate would be a(n) variable. If the total number of votes were removed and the candidates were listed in order of least to most popular, this would be a(n)
variable.
a. ratio; ordinal b. ordinal; ratio c. ratio; nominal
d. nominal; ordinal
2. A researcher was interested in the effects of gender on attitudes toward women in leadership positions. The researcher surveyed a group of individuals, 12 of whom were men and 12 of whom were women. In this example, what is the explanatory/independent variable?
a. type of leadership position b. the 12 women in the study
c. the gender of the participants
d. the participants' attitudes toward women in leadership positions
3. A researcher was interested in the effects of gender on attitudes toward women in leadership positions. The researcher surveyed a group of individuals, 12 of whom were men and 12 of whom were women. In this example, what is the response/dependent variable?
a. type of leadership position b. the 12 women in the study
c. the gender of the participants
d. the participants' attitudes toward women in leadership positions
Please use the following information to answer questions 4 through 9
An industrial psychologist at a company has heard that desk bikes could help employees to lose weight, increase their stamina, and improve productivity. Sixteen employees were provided with desk bikes and the total number of pounds they lost, after one month, was recorded. Here are the data, in pounds lost, per employee:
4
8
12
0
2
20
18
0
12
6
12
16
10
8
12
4
4. What is the range of this distribution?
a. 0 t o 20 b. 20
c. 18 d. 4
5. What is the mean number of pounds that were lost by the employees in one month?
a.
9.88
b.
10.4
c.
12
d.
9
6. What is the median number of pounds that were lost by the employees in one month?
a.
8
b.
9
c.
10
d.
11
7. What is the variance of the number of pounds that were lost by the employees in one month?
a.
37.33
b.
9.72
c.
9.85
d.
6.11
8. What is the Interquartile range for this distribution?
a.
4
b.
8
c.
9
d.
12
9. How many outliers are in this distribution?
a. 0 b. 1
c. 2
d. Unable to determine from this information
The following graph depicts the typical relationship found between physiological arousal (anxiety) levels (e.g., range from 0 = no anxiety to 10=extreme anxiety) and test performance (e.g., percentage of correct answers on test).
Please use the following information to answer questions 10 and 11.
100%
Test Performance (in Percentage)
90%
80%
70%
60%
50%
40%
30%
20%
10%
0%
Relationship Between Physiological Arousal Level and Test
Performance
0 2 4 6 8 10
Physiological Arousal Level
10. Based on this graph, what type of relation exists between physiological arousal level and test performanc.
Exam 2 (covers Chapters 6 and 7), Math 140 Spring 2015,.docxMARRY7
Exam 2 (covers Chapters 6 and 7), Math 140
Spring 2015, CSUN
Show All Work! Name:___________________________
Seat number:________________________
P a p e r s w i t h o u t n a m e / s e a t n u m b e r w o u l d l o s e 1 0 p o i n t s . Write your name and seat number now.
For full credit, draw a sketch for each problem put all information on the graph.
Problems 1 and 2 each 10 points, problem 3 has 15 points, problems 4-8 each 13 points.
1. Assume that weights of men are normally distributed with a mean of 172 lb and a standard deviation of 29
lb. Find the probability that if an individual man is randomly selected, his weight will be greater than 180
lb.
2. Birth weights in Los Angeles are normally distributed with a mean of 3400 grams and a standard deviation
of 450 grams. If a hospital plans to set up special observation conditions for the lightest 4% of the babies,
what weight is used to separating the lightest 4% from the others?
2
3. An airline jet has doors with a height of 70 inches. Heights of men are normally distributed with a mean of
69.0 inches and a standard deviation of 2.8 inches.
a. If a male passenger is randomly selected, find the probability that he can fit through the doorways
without bending.
b. Find the probability that the mean height of the 28 men passengers is less than 70 inches.
3
4. In a study, 414 randomly selected CSUN students were asked whether they are willing to take a class at
7:00AM, 45% of them said that they are in favor. Find a 99% confidence interval estimate of the
percentage of CSUN students who are in favor of having a class starting at 7:00AM. Can we safely
conclude that the majority of CSUN students are in favor of having a starting at 7:00AM? Explain why or
why not?
4
5. How many randomly selected students at CSUN must be surveyed to estimate the percentage of CSUNers
who have a cellphone? Assume that we want to be 99% confident that the sample percentage is within two
points of the true population percentage. Also, assume that it is estimated that 77% of students at CSUN
have a cellphone
5
6. In a survey at CSUN, a simple random sample of 41 students has a mean family income $49,000.
Assuming that population standard deviation is known to be $12,500, find a 95% confidence interval
estimate of the mean family income of all CSUN students.
6
7. Assume that heights of students taking statistics are normally distributed. Listed below are the heights of
10 students from our Math 140 class that are selected randomly. Construct a 99% confidence interval
estimate of mean of heights for all statistics’ students at CSUN. 63, 70, 64, 67, 62, 65, 64, 61, 69, 74.
Explain the confidence interval in words.
7
8. The listed v ...
The Octavia range embodies the design trend of the Škoda brand: a fusion of
aesthetics, safety and practicality. Whether you see the car as a whole or step
closer and explore its unique features, the Octavia range radiates with the
harmony of functionality and emotion
Your VW's camshaft position sensor is crucial for engine performance. Signs of failure include engine misfires, difficulty starting, stalling at low speeds, reduced fuel efficiency, and the check engine light. Prompt inspection and replacement can prevent further damage and keep your VW running smoothly.
𝘼𝙣𝙩𝙞𝙦𝙪𝙚 𝙋𝙡𝙖𝙨𝙩𝙞𝙘 𝙏𝙧𝙖𝙙𝙚𝙧𝙨 𝙞𝙨 𝙫𝙚𝙧𝙮 𝙛𝙖𝙢𝙤𝙪𝙨 𝙛𝙤𝙧 𝙢𝙖𝙣𝙪𝙛𝙖𝙘𝙩𝙪𝙧𝙞𝙣𝙜 𝙩𝙝𝙚𝙞𝙧 𝙥𝙧𝙤𝙙𝙪𝙘𝙩𝙨. 𝙒𝙚 𝙝𝙖𝙫𝙚 𝙖𝙡𝙡 𝙩𝙝𝙚 𝙥𝙡𝙖𝙨𝙩𝙞𝙘 𝙜𝙧𝙖𝙣𝙪𝙡𝙚𝙨 𝙪𝙨𝙚𝙙 𝙞𝙣 𝙖𝙪𝙩𝙤𝙢𝙤𝙩𝙞𝙫𝙚 𝙖𝙣𝙙 𝙖𝙪𝙩𝙤 𝙥𝙖𝙧𝙩𝙨 𝙖𝙣𝙙 𝙖𝙡𝙡 𝙩𝙝𝙚 𝙛𝙖𝙢𝙤𝙪𝙨 𝙘𝙤𝙢𝙥𝙖𝙣𝙞𝙚𝙨 𝙗𝙪𝙮 𝙩𝙝𝙚 𝙜𝙧𝙖𝙣𝙪𝙡𝙚𝙨 𝙛𝙧𝙤𝙢 𝙪𝙨.
Over the 10 years, we have gained a strong foothold in the market due to our range's high quality, competitive prices, and time-lined delivery schedules.
Comprehensive program for Agricultural Finance, the Automotive Sector, and Empowerment . We will define the full scope and provide a detailed two-week plan for identifying strategic partners in each area within Limpopo, including target areas.:
1. Agricultural : Supporting Primary and Secondary Agriculture
• Scope: Provide support solutions to enhance agricultural productivity and sustainability.
• Target Areas: Polokwane, Tzaneen, Thohoyandou, Makhado, and Giyani.
2. Automotive Sector: Partnerships with Mechanics and Panel Beater Shops
• Scope: Develop collaborations with automotive service providers to improve service quality and business operations.
• Target Areas: Polokwane, Lephalale, Mokopane, Phalaborwa, and Bela-Bela.
3. Empowerment : Focusing on Women Empowerment
• Scope: Provide business support support and training to women-owned businesses, promoting economic inclusion.
• Target Areas: Polokwane, Thohoyandou, Musina, Burgersfort, and Louis Trichardt.
We will also prioritize Industrial Economic Zone areas and their priorities.
Sign up on https://profilesmes.online/welcome/
To be eligible:
1. You must have a registered business and operate in Limpopo
2. Generate revenue
3. Sectors : Agriculture ( primary and secondary) and Automative
Women and Youth are encouraged to apply even if you don't fall in those sectors.
What Are The Immediate Steps To Take When The VW Temperature Light Starts Fla...Import Motorworks
Learn how to respond when the red temperature light flashes in your VW with this presentation. From checking coolant levels to seeking professional help, follow these steps promptly to prevent engine damage and ensure safety on the road.
Learn why monitoring your Mercedes' Exhaust Back Pressure (EBP) sensor is crucial. Understand its role in engine performance and emission reduction. Discover five warning signs of EBP sensor failure, from loss of power to increased emissions. Take action promptly to avoid costly repairs and maintain your Mercedes' reliability and efficiency.
What Does the PARKTRONIC Inoperative, See Owner's Manual Message Mean for You...Autohaus Service and Sales
Learn what "PARKTRONIC Inoperative, See Owner's Manual" means for your Mercedes-Benz. This message indicates a malfunction in the parking assistance system, potentially due to sensor issues or electrical faults. Prompt attention is crucial to ensure safety and functionality. Follow steps outlined for diagnosis and repair in the owner's manual.
Fleet management these days is next to impossible without connected vehicle solutions. Why? Well, fleet trackers and accompanying connected vehicle management solutions tend to offer quite a few hard-to-ignore benefits to fleet managers and businesses alike. Let’s check them out!
In this presentation, we have discussed a very important feature of BMW X5 cars… the Comfort Access. Things that can significantly limit its functionality. And things that you can try to restore the functionality of such a convenient feature of your vehicle.
Symptoms like intermittent starting and key recognition errors signal potential problems with your Mercedes’ EIS. Use diagnostic steps like error code checks and spare key tests. Professional diagnosis and solutions like EIS replacement ensure safe driving. Consult a qualified technician for accurate diagnosis and repair.
What Could Cause The Headlights On Your Porsche 911 To Stop WorkingLancer Service
Discover why your Porsche 911 headlights might flicker out unexpectedly. From aging bulbs to electrical gremlins and moisture mishaps, we're delving into the reasons behind the blackout. Stay tuned to illuminate the road ahead and ensure your lights shine bright for safer journeys.
Ever been troubled by the blinking sign and didn’t know what to do?
Here’s a handy guide to dashboard symbols so that you’ll never be confused again!
Save them for later and save the trouble!
"Trans Failsafe Prog" on your BMW X5 indicates potential transmission issues requiring immediate action. This safety feature activates in response to abnormalities like low fluid levels, leaks, faulty sensors, electrical or mechanical failures, and overheating.
Things to remember while upgrading the brakes of your carjennifermiller8137
Upgrading the brakes of your car? Keep these things in mind before doing so. Additionally, start using an OBD 2 GPS tracker so that you never miss a vehicle maintenance appointment. On top of this, a car GPS tracker will also let you master good driving habits that will let you increase the operational life of your car’s brakes.
Things to remember while upgrading the brakes of your car
Normaldistribution questions
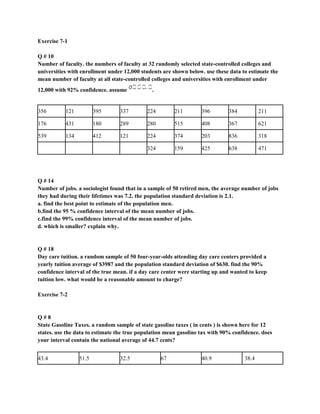
1. Exercise 7-1
Q # 10
Number of faculty. the numbers of faculty at 32 randomly selected state-controlled colleges and
universities with enrollment under 12,000 students are shown below. use these data to estimate the
mean number of faculty at all state-controlled colleges and universities with enrollment under
12,000 with 92% confidence. assume .
211384396211224337395121356
621367408515280289180431176
318836203374224121412134539
471638425159324
Q # 14
Number of jobs. a sociologist found that in a sample of 50 retired men, the average number of jobs
they had during their lifetimes was 7.2. the population standard deviation is 2.1.
a. find the best point to estimate of the population men.
b.find the 95 % confidence interval of the mean number of jobs.
c.find the 99% confidence interval of the mean number of jobs.
d. which is smaller? explain why.
Q # 18
Day care tuition. a random sample of 50 four-year-olds attending day care centers provided a
yearly tuition average of $3987 and the population standard deviation of $630. find the 90%
confidence interval of the true mean. if a day care center were starting up and wanted to keep
tuition low. what would be a reasonable amount to charge?
Exercise 7-2
Q # 8
State Gasoline Taxes. a random sample of state gasoline taxes ( in cents ) is shown here for 12
states. use the data to estimate the true population mean gasoline tax with 90% confidence. does
your interval contain the national average of 44.7 cents?
38.440.96732.551.543.4
2. 3843.450.735.439.341.4
Q # 10
Dance Company Students. the number of students who belong to dance company at each of several
randomly selected small universities is shown below. estimate the true population mean size of a
university dance company with 99% confidence.
2125322228302930
4726352635262828
322740
Exercise 7-3
Q # 6
Belief in haunted places. a random sample of 205 college students were asked if they believed that
places could be haunted, and 65 responded yes. estimate the true proportion of college students who
believed in the possibility of haunted places with 99% confidence. according to time magazine,37%
of americans believe that places can be haunted.
Q # 14
Fighting U.S hunger. in a poll of 1000 likely voters, 560 say that the united states spends too little on
fighting hunger at home. find a 95% confidence interval for the true proportion of voters who feel
this way.
Exercise 8-2
Q # 4
Moviegoers. the average moviegoer sees 8.5 movies a year. a moviegoer is defined as a person who
sees at least one movie in a theater in a 12 month period. a random sample of 40 moviegoers from a
large university revealed that the average number of movies seen per person was 9.6. The
population standard deviation is 3.2 movies. at the 0.05 level of significance, can it be concluded
that this represents a difference from the national average?
Q # 8
Salaries of government employees. the mean salary of federal government employees on the general
3. schedule is $59,593. the average salary of 30 state employees who do similar work is $58,800 with
. at the 0.01 level of significance, can it be concluded that state employees earn on
average less than federal employees?
Q # 12
Student expenditures. the average expenditure per student ( based on average daily attendance) for
a certain school year was $10,337 with a population standard deviation of $1560. a survey for the
next school year of 150 randomly selected students resulted in a sample mean of $10,798. do these
results indicates that the average expenditure has changed? choose your own level of significance.
Exercise 8-3
Q # 6
Park acreage. a state executive claims that the average number of acres in western pennsylvania
state parks is less that 2000 acres. a random sample of five parks is selected, and the number of
acres is shown. at , is there enough evidence to support the claim?
95911874936249541
Q # 14
Chocolate chip cookie calories. the average 1-ounce chocolate chip cookie contains 110 calories. a
random sample of 15 different brands of 1-ounce chocolate chip cookies resulted in the following
calorie amounts. at the , is there sufficient evidence that the average calorie content
is greater than 110 calories?
100125150160185125155145160
100150140135120110
Exercise 8-4
Q # 8
Female Physicians. the percentage of physicians who are women is 27.9%. in a survey of physicians
employed by a larger university health system,45 of 120 randomly selected physicians were women.
is there sufficient evidence at the 0.05 level of significance to conclude that the proportion of women
physicians at the university health system exceeds 27.9%?
4. Q # 18
Doctoral student's salaries. nationally, at least 60% of Ph.D. Students have paid assistantship. a
college dean feels that this is not true in his state, so he randomly selected 50 Ph.D. Students and
finds that 26 have assistantships. at , is the dean correct?
Exercise 9-1
Q # 6
Teachers salaries. california and new york lead the list of average teacher's salaries. the california
yearly average is $64,421 while teachers in new york make an average annual salary of $62,332.
random samples of 45 teachers from each state yielded the following
CaliforniaNew York
Sample mean64,51062,900
Population standard deviation8,2007,800
at is a difference in means of the salaries?
Q # 10
Home Prices. a real estate agent compares the selling prices of homes in two municipalities in south
western pennsylvania to see if there is a difference. the results of the study are shown. is there
enough evidence to reject the claim that the average cost of a home in both locations is the same?
use .
ScottLigonier
$93,430*$98,043*
$5602$4731
3540
Q # 16
Ages of College Students . the dean of students wants to see whether there is a significant difference
in ages of resident students and commuting students. she selects a sample of 50 students from each
group. the ages are shown here. at ,decide if there is enough evidence to reject the claim of
no difference in the ages of the two groups. use the P-value method. assume and
6. Book90809075809084
DVD85728080707580
Q # 4
Obstacle course times. an obstacle course was set up on a campus, and 10 volunteers were given a
chance to complete it while there were being time. they then sampled a new energy drink and were
given the opportunity to run the course again. the before and after times in seconds are shown
below. is there sufficient evidence at to conclude that the students did better the second
time? discuss possible reasons for your results.
Student12345678
Before6772807078826975
After6870766575786568
Q # 10
A random sample of six music students played a short song, and the number of mistakes each
student made was recorded. after they practiced the song 5 times, the number of mistakes each
student made was recorded. the data are shown. at , can it be concluded that there was a
decrease in the mean number of mistakes?
StudentABCDEF
Before10688138
After422789
Exercise 9-4
Q # 4
Undergraduate financial aid. a study is conducted to determine if the percent of women who receive
financial aid in undergraduate school is different from the percent of men who receive financial aid
in undergraduate school. a random sample of undergraduates revealed these results. at ,
is there significant evidence to reject the null hypothesis?