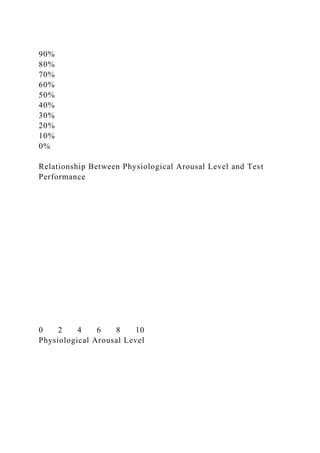
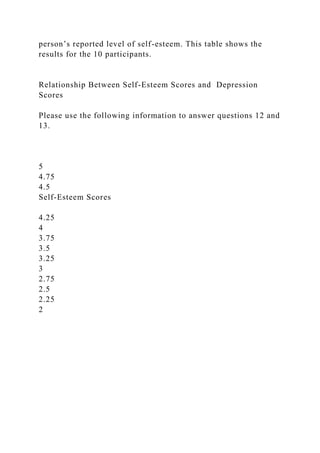
STAT225: Introduction to Statistics in the Behavioral Sciences 1. In a school election, five people run for student body president. The actual number of votes for each candidate would be a(n) variable. If the total number of votes were removed and the candidates were listed in order of least to most popular, this would be a(n) variable. a. ratio; ordinal b. ordinal; ratio c. ratio; nominal d. nominal; ordinal 2. A researcher was interested in the effects of gender on attitudes toward women in leadership positions. The researcher surveyed a group of individuals, 12 of whom were men and 12 of whom were women. In this example, what is the explanatory/independent variable? a. type of leadership position b. the 12 women in the study c. the gender of the participants d. the participants' attitudes toward women in leadership positions 3. A researcher was interested in the effects of gender on attitudes toward women in leadership positions. The researcher surveyed a group of individuals, 12 of whom were men and 12 of whom were women. In this example, what is the response/dependent variable? a. type of leadership position b. the 12 women in the study c. the gender of the participants d. the participants' attitudes toward women in leadership positions Please use the following information to answer questions 4 through 9 An industrial psychologist at a company has heard that desk bikes could help employees to lose weight, increase their stamina, and improve productivity. Sixteen employees were provided with desk bikes and the total number of pounds they lost, after one month, was recorded. Here are the data, in pounds lost, per employee: 4 8 12 0 2 20 18 0 12 6 12 16 10 8 12 4 4. What is the range of this distribution? a. 0 t o 20 b. 20 c. 18 d. 4 5. What is the mean number of pounds that were lost by the employees in one month? a. 9.88 b. 10.4 c. 12 d. 9 6. What is the median number of pounds that were lost by the employees in one month? a. 8 b. 9 c. 10 d. 11 7. What is the variance of the number of pounds that were lost by the employees in one month? a. 37.33 b. 9.72 c. 9.85 d. 6.11 8. What is the Interquartile range for this distribution? a. 4 b. 8 c. 9 d. 12 9. How many outliers are in this distribution? a. 0 b. 1 c. 2 d. Unable to determine from this information The following graph depicts the typical relationship found between physiological arousal (anxiety) levels (e.g., range from 0 = no anxiety to 10=extreme anxiety) and test performance (e.g., percentage of correct answers on test). Please use the following information to answer questions 10 and 11. 100% Test Performance (in Percentage) 90% 80% 70% 60% 50% 40% 30% 20% 10% 0% Relationship Between Physiological Arousal Level and Test Performance 0 2 4 6 8 10 Physiological Arousal Level 10. Based on this graph, what type of relation exists between physiological arousal level and test performanc.