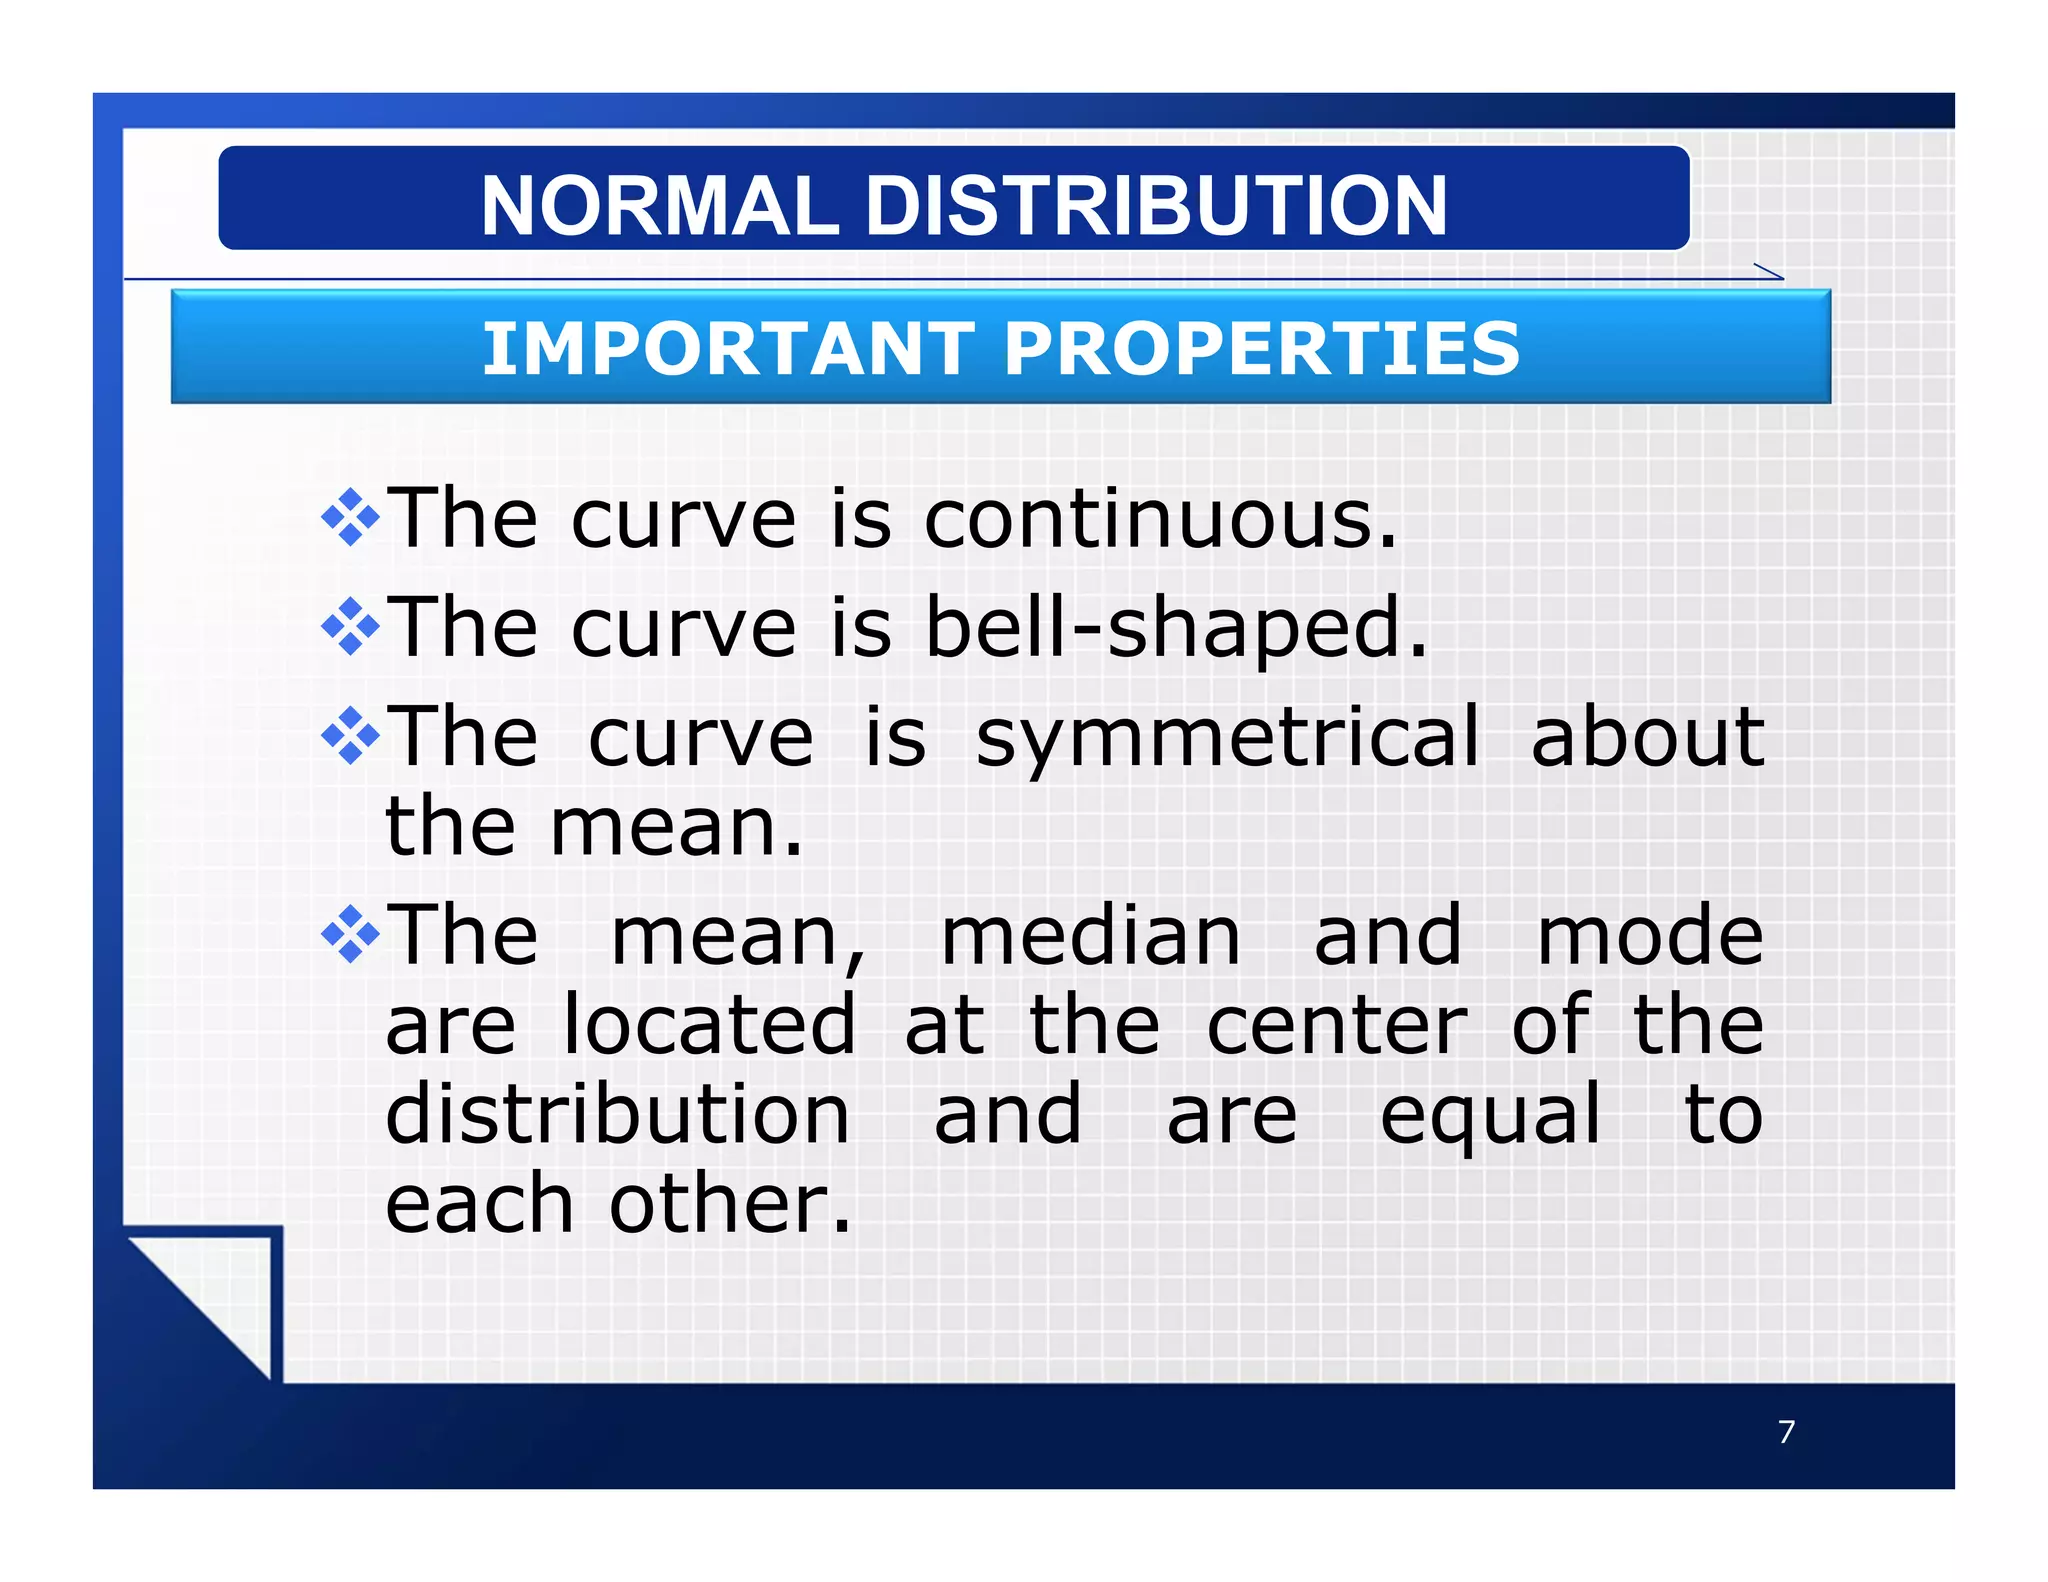
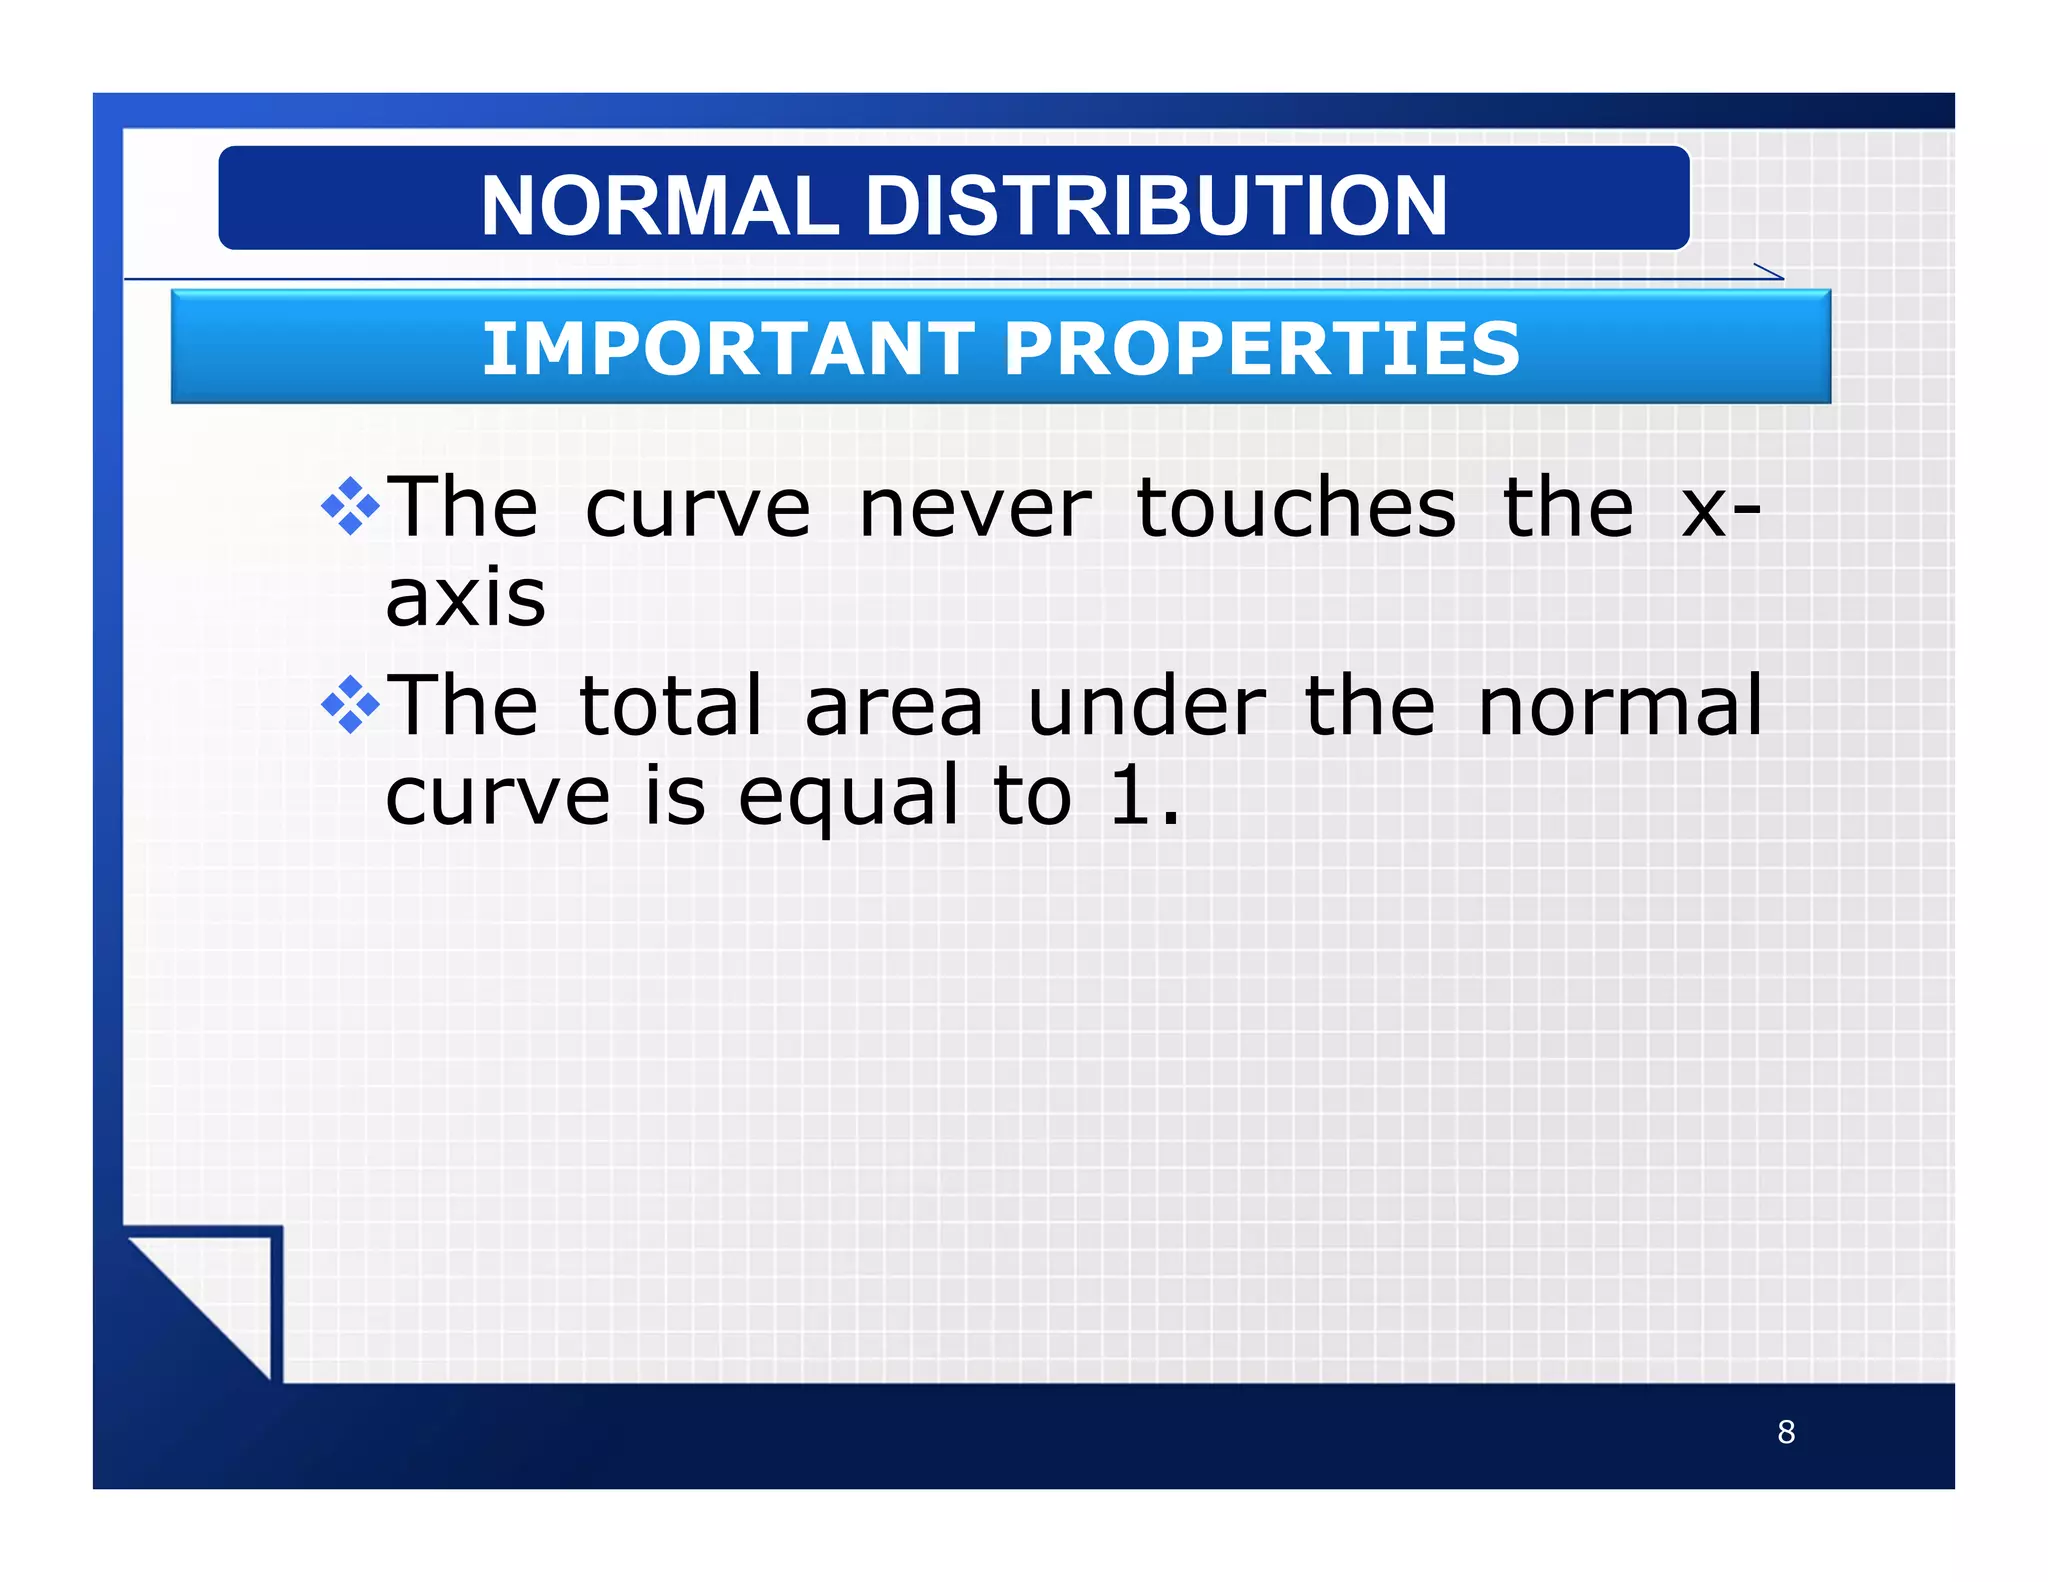
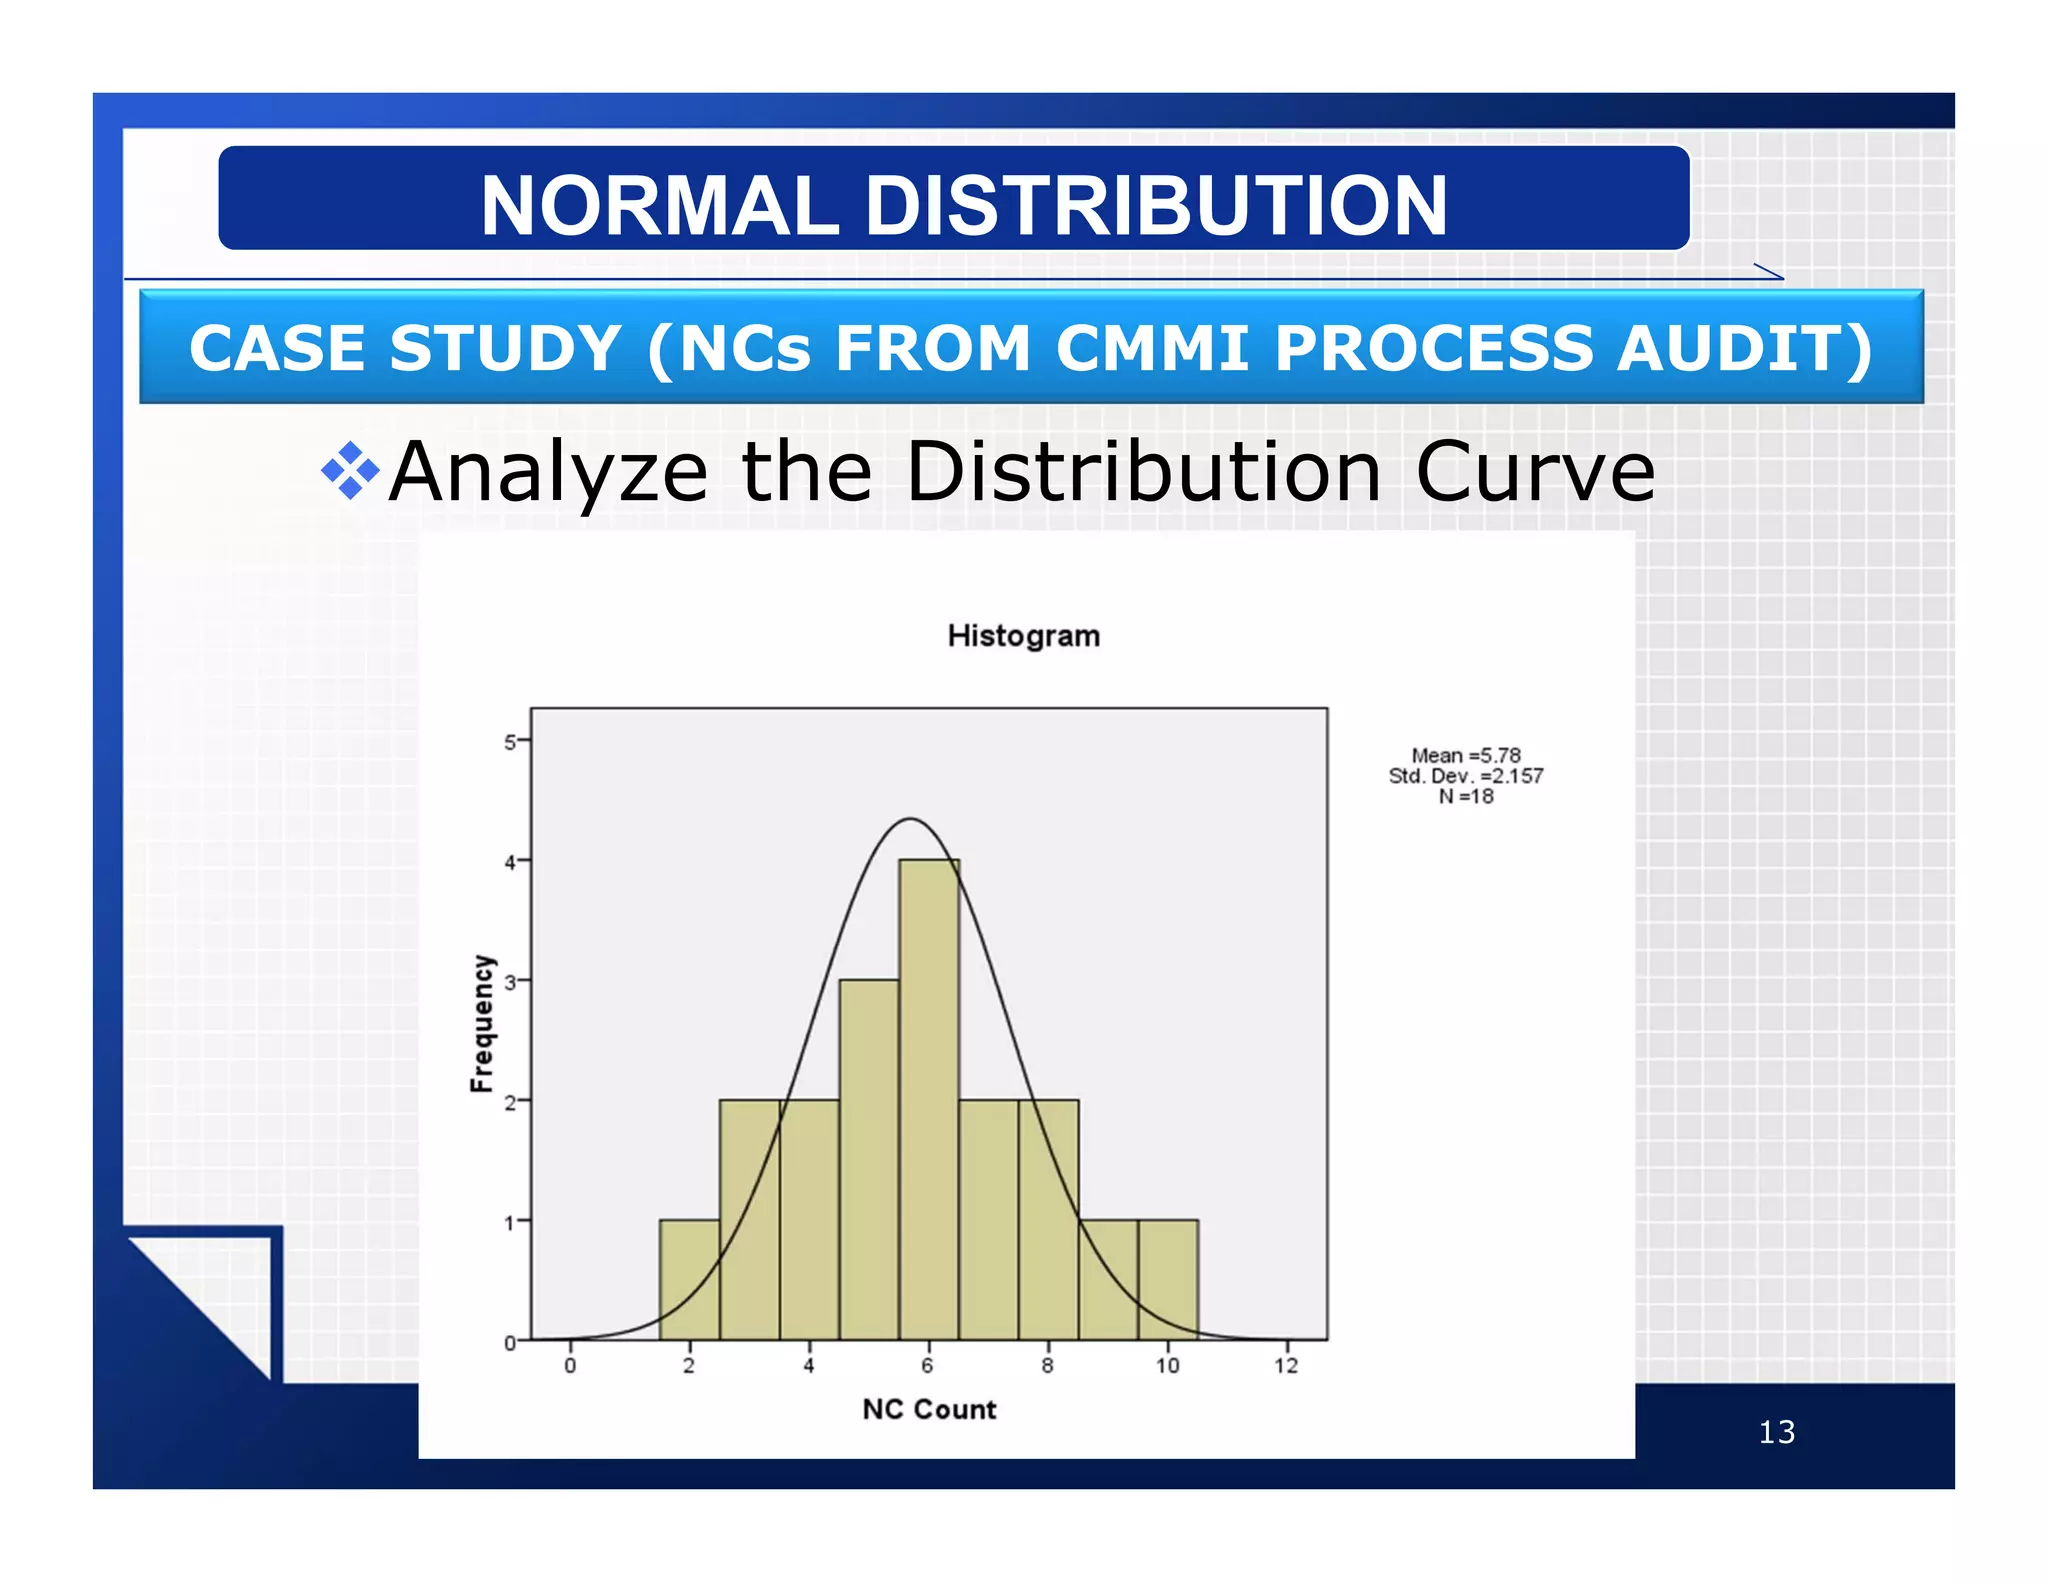
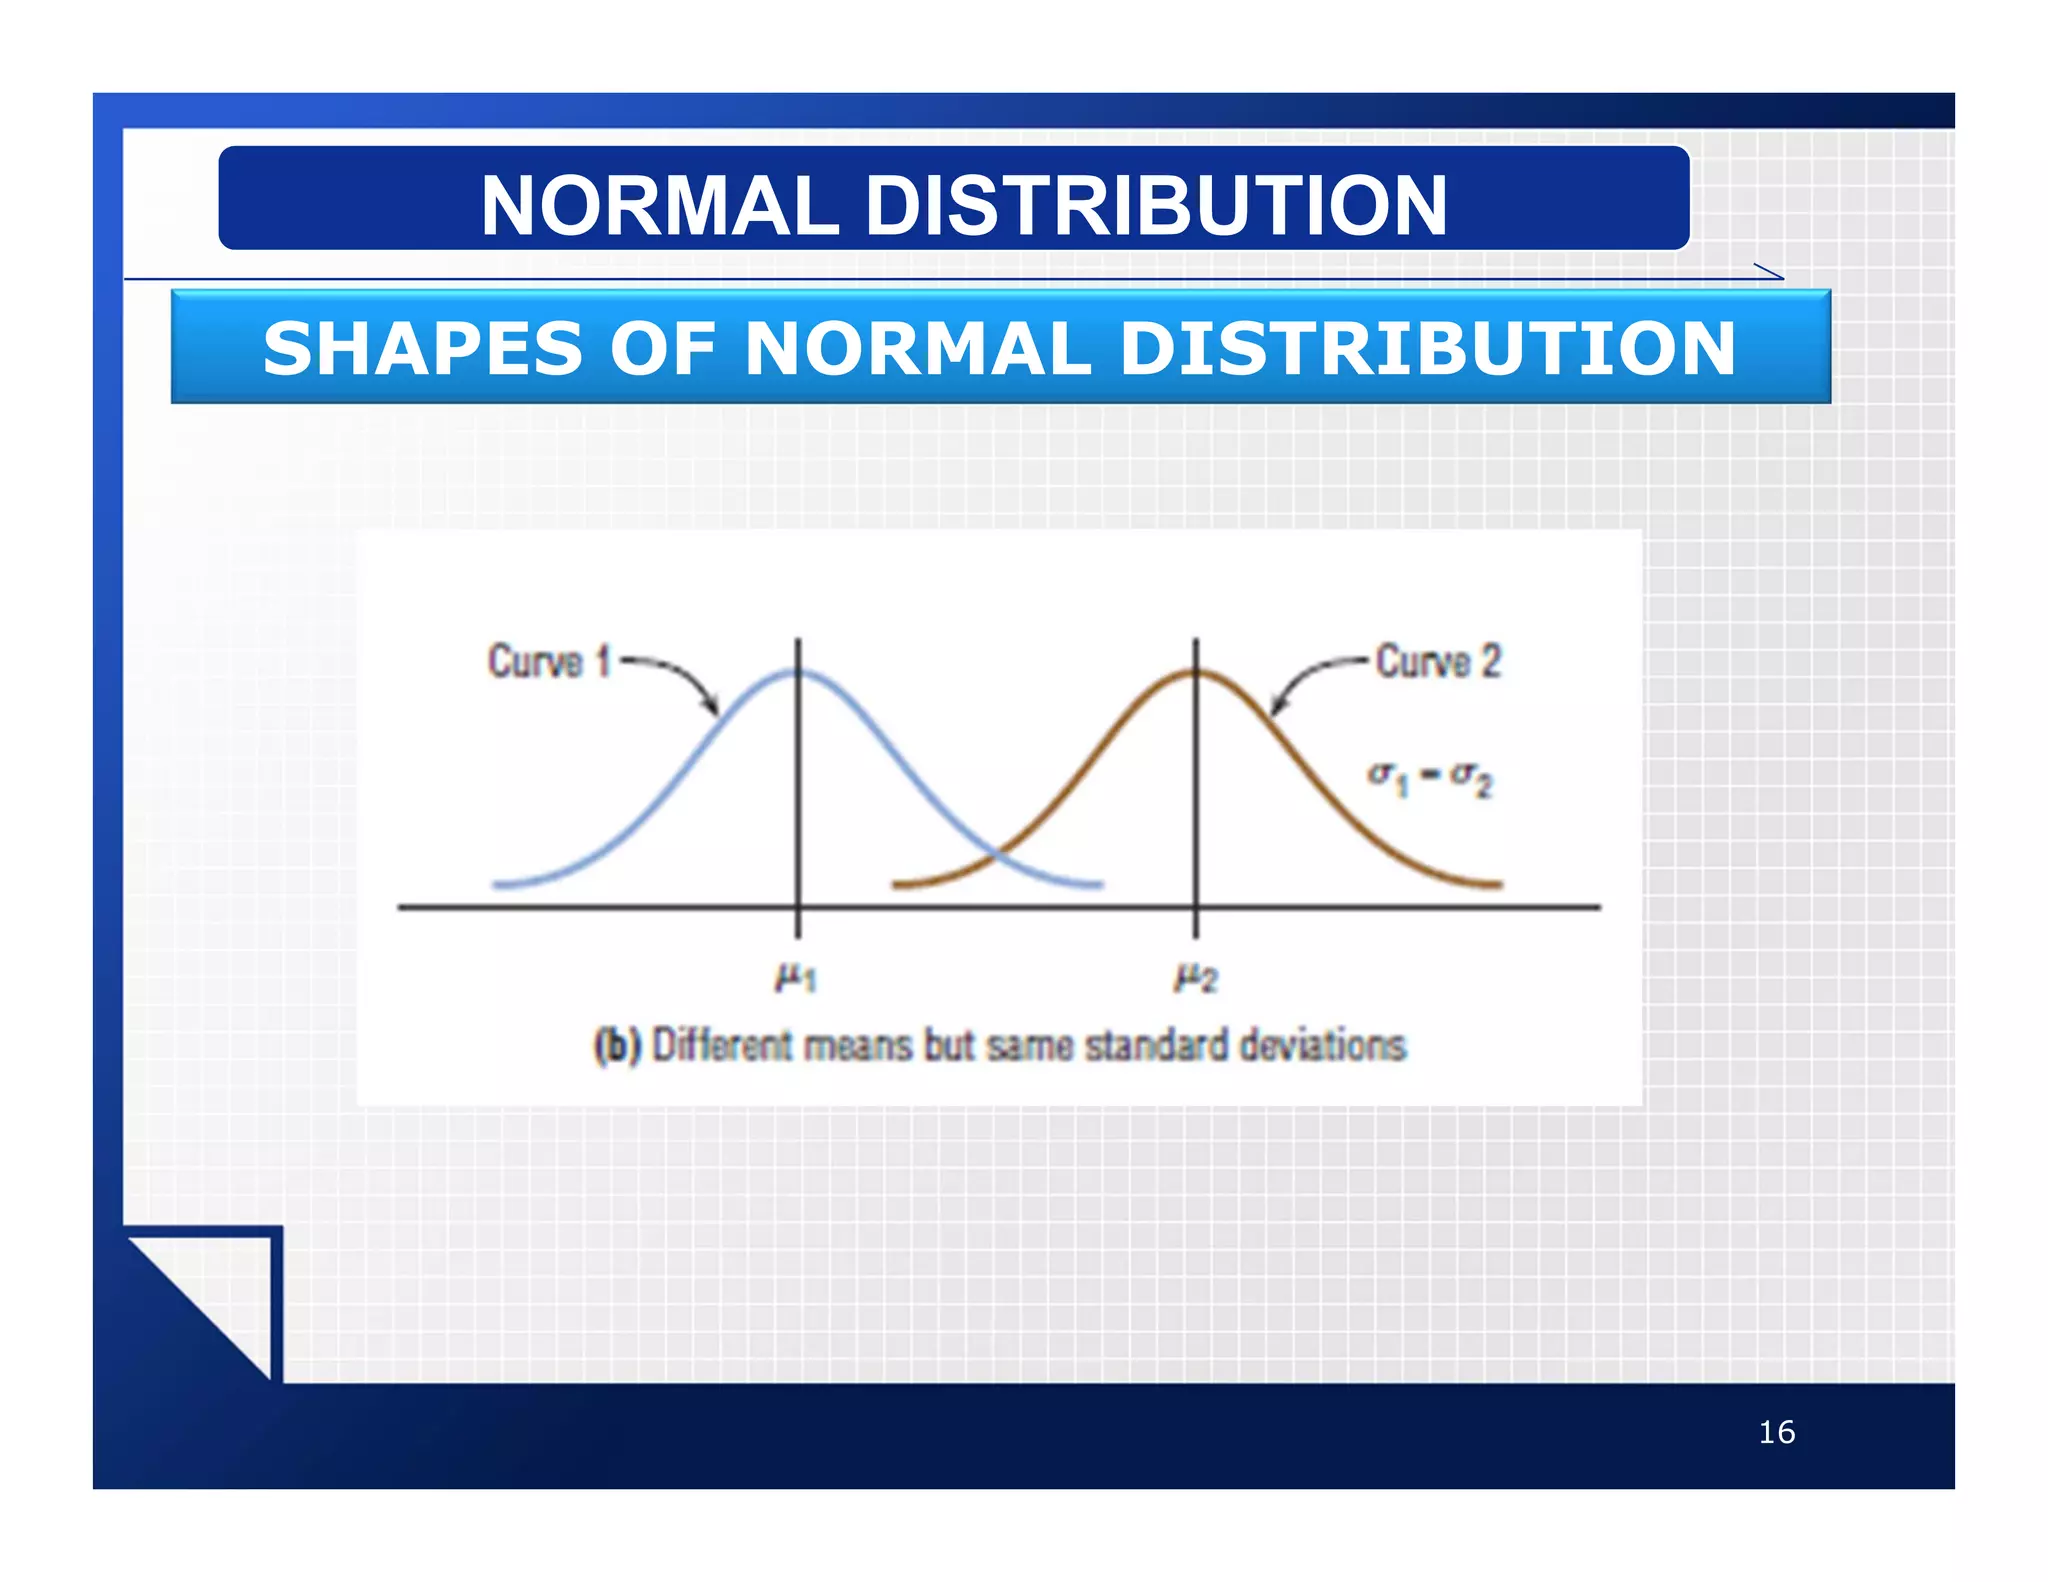
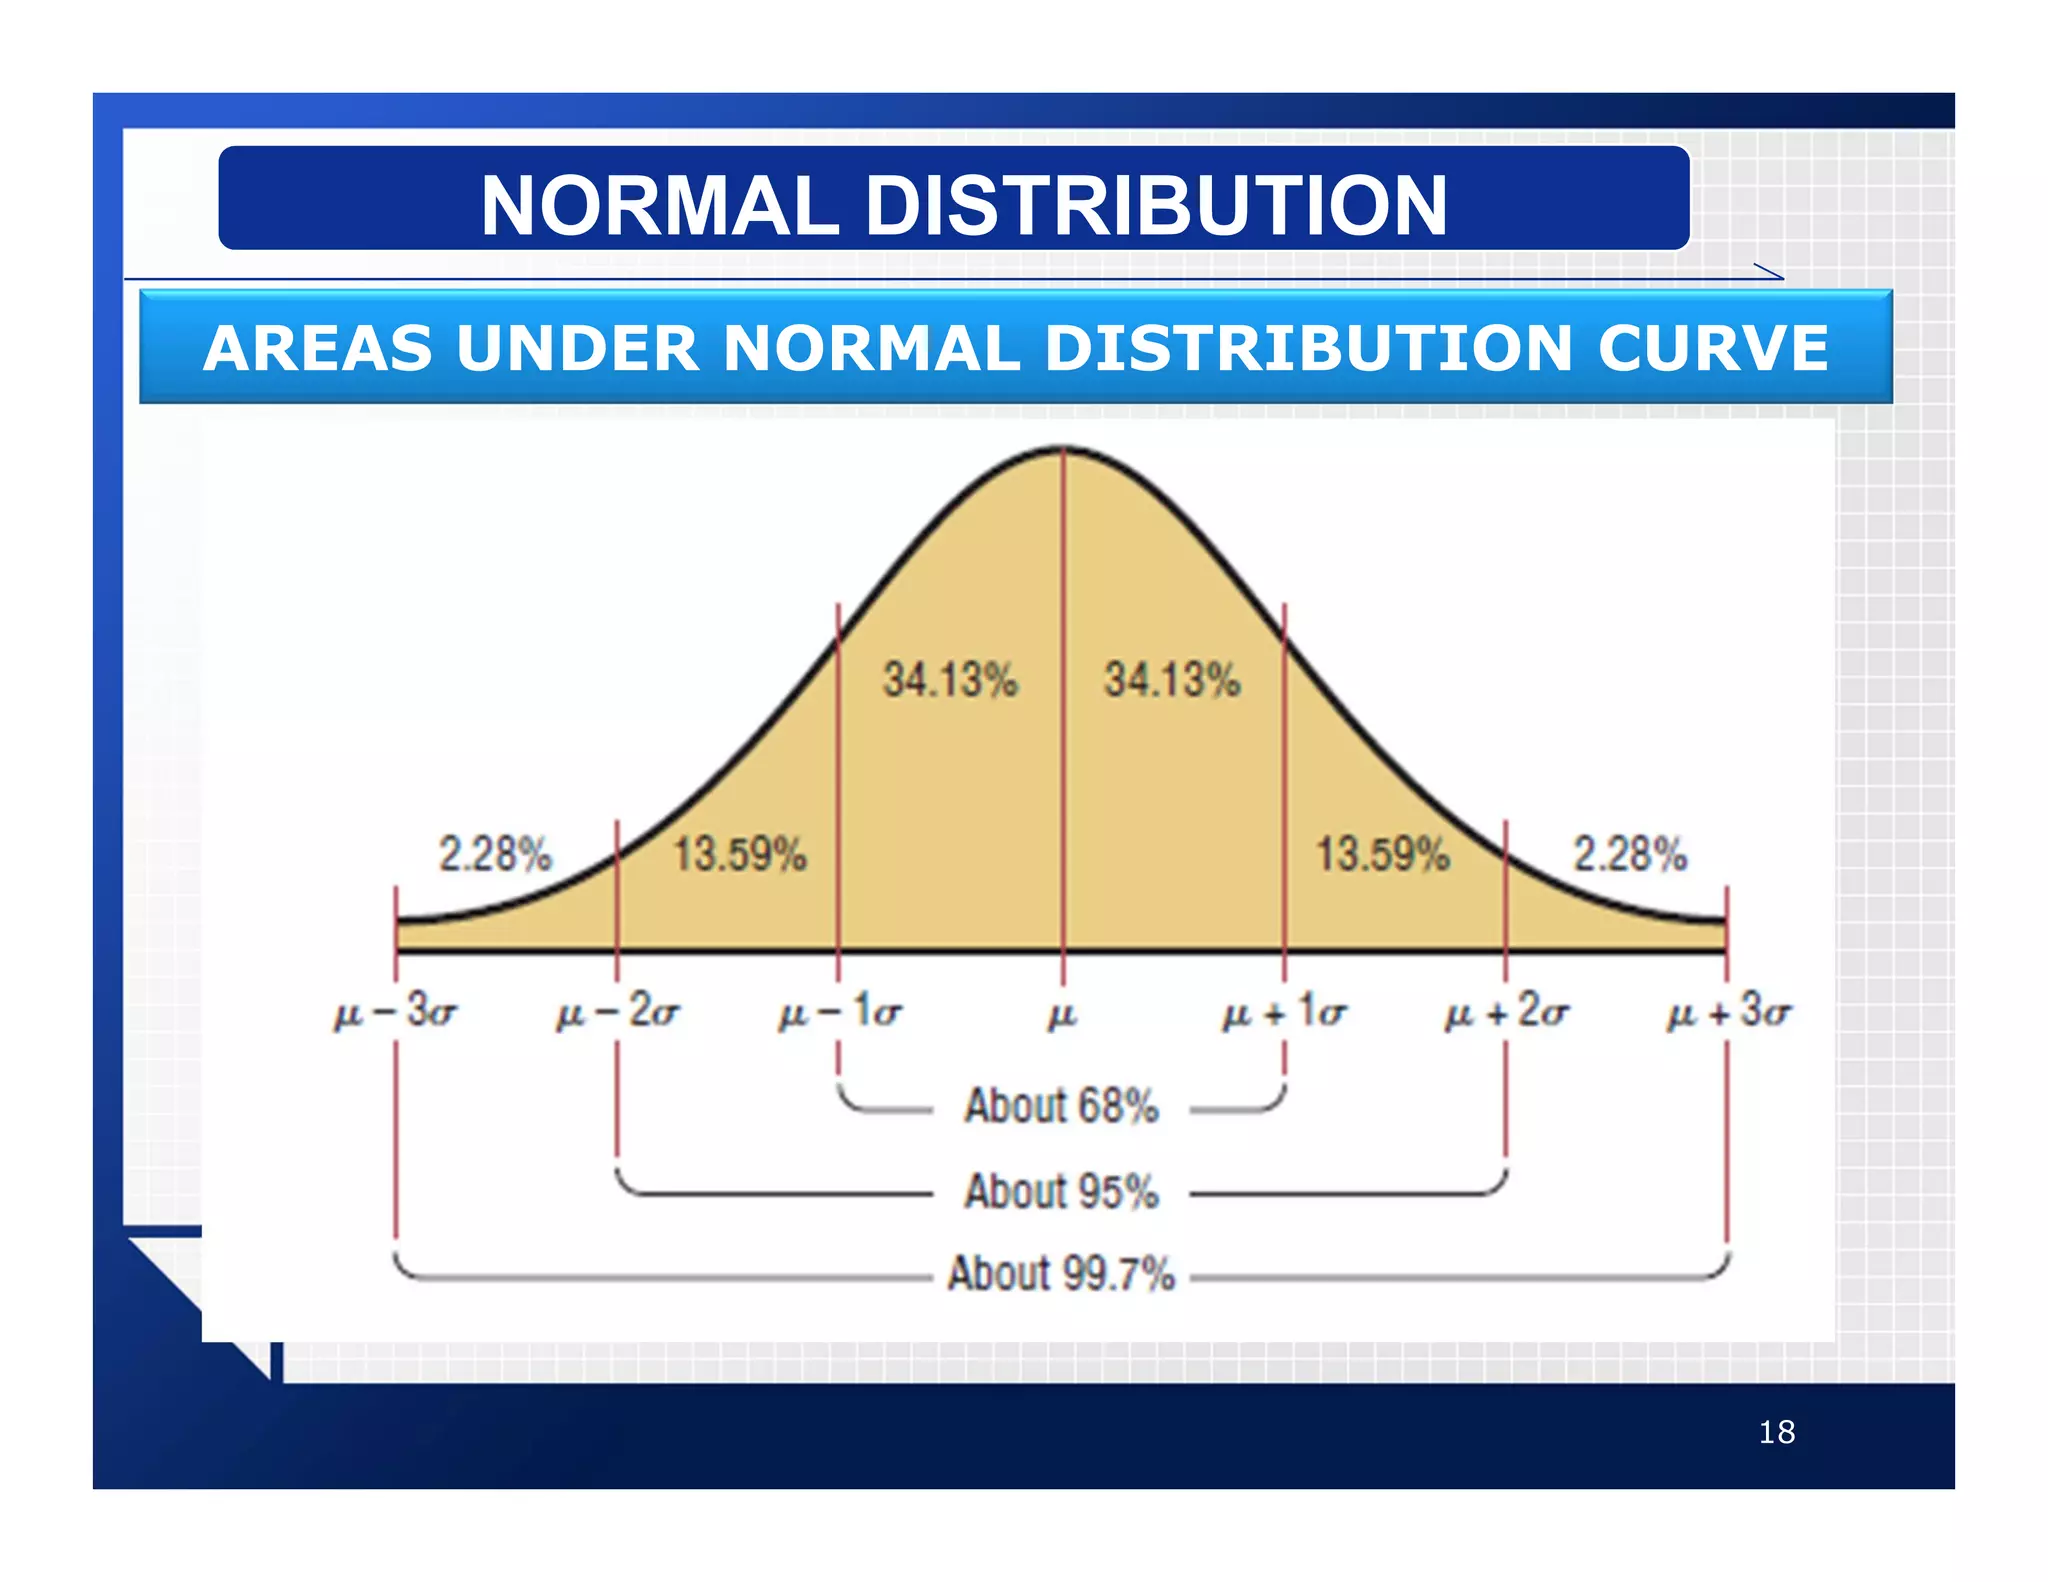
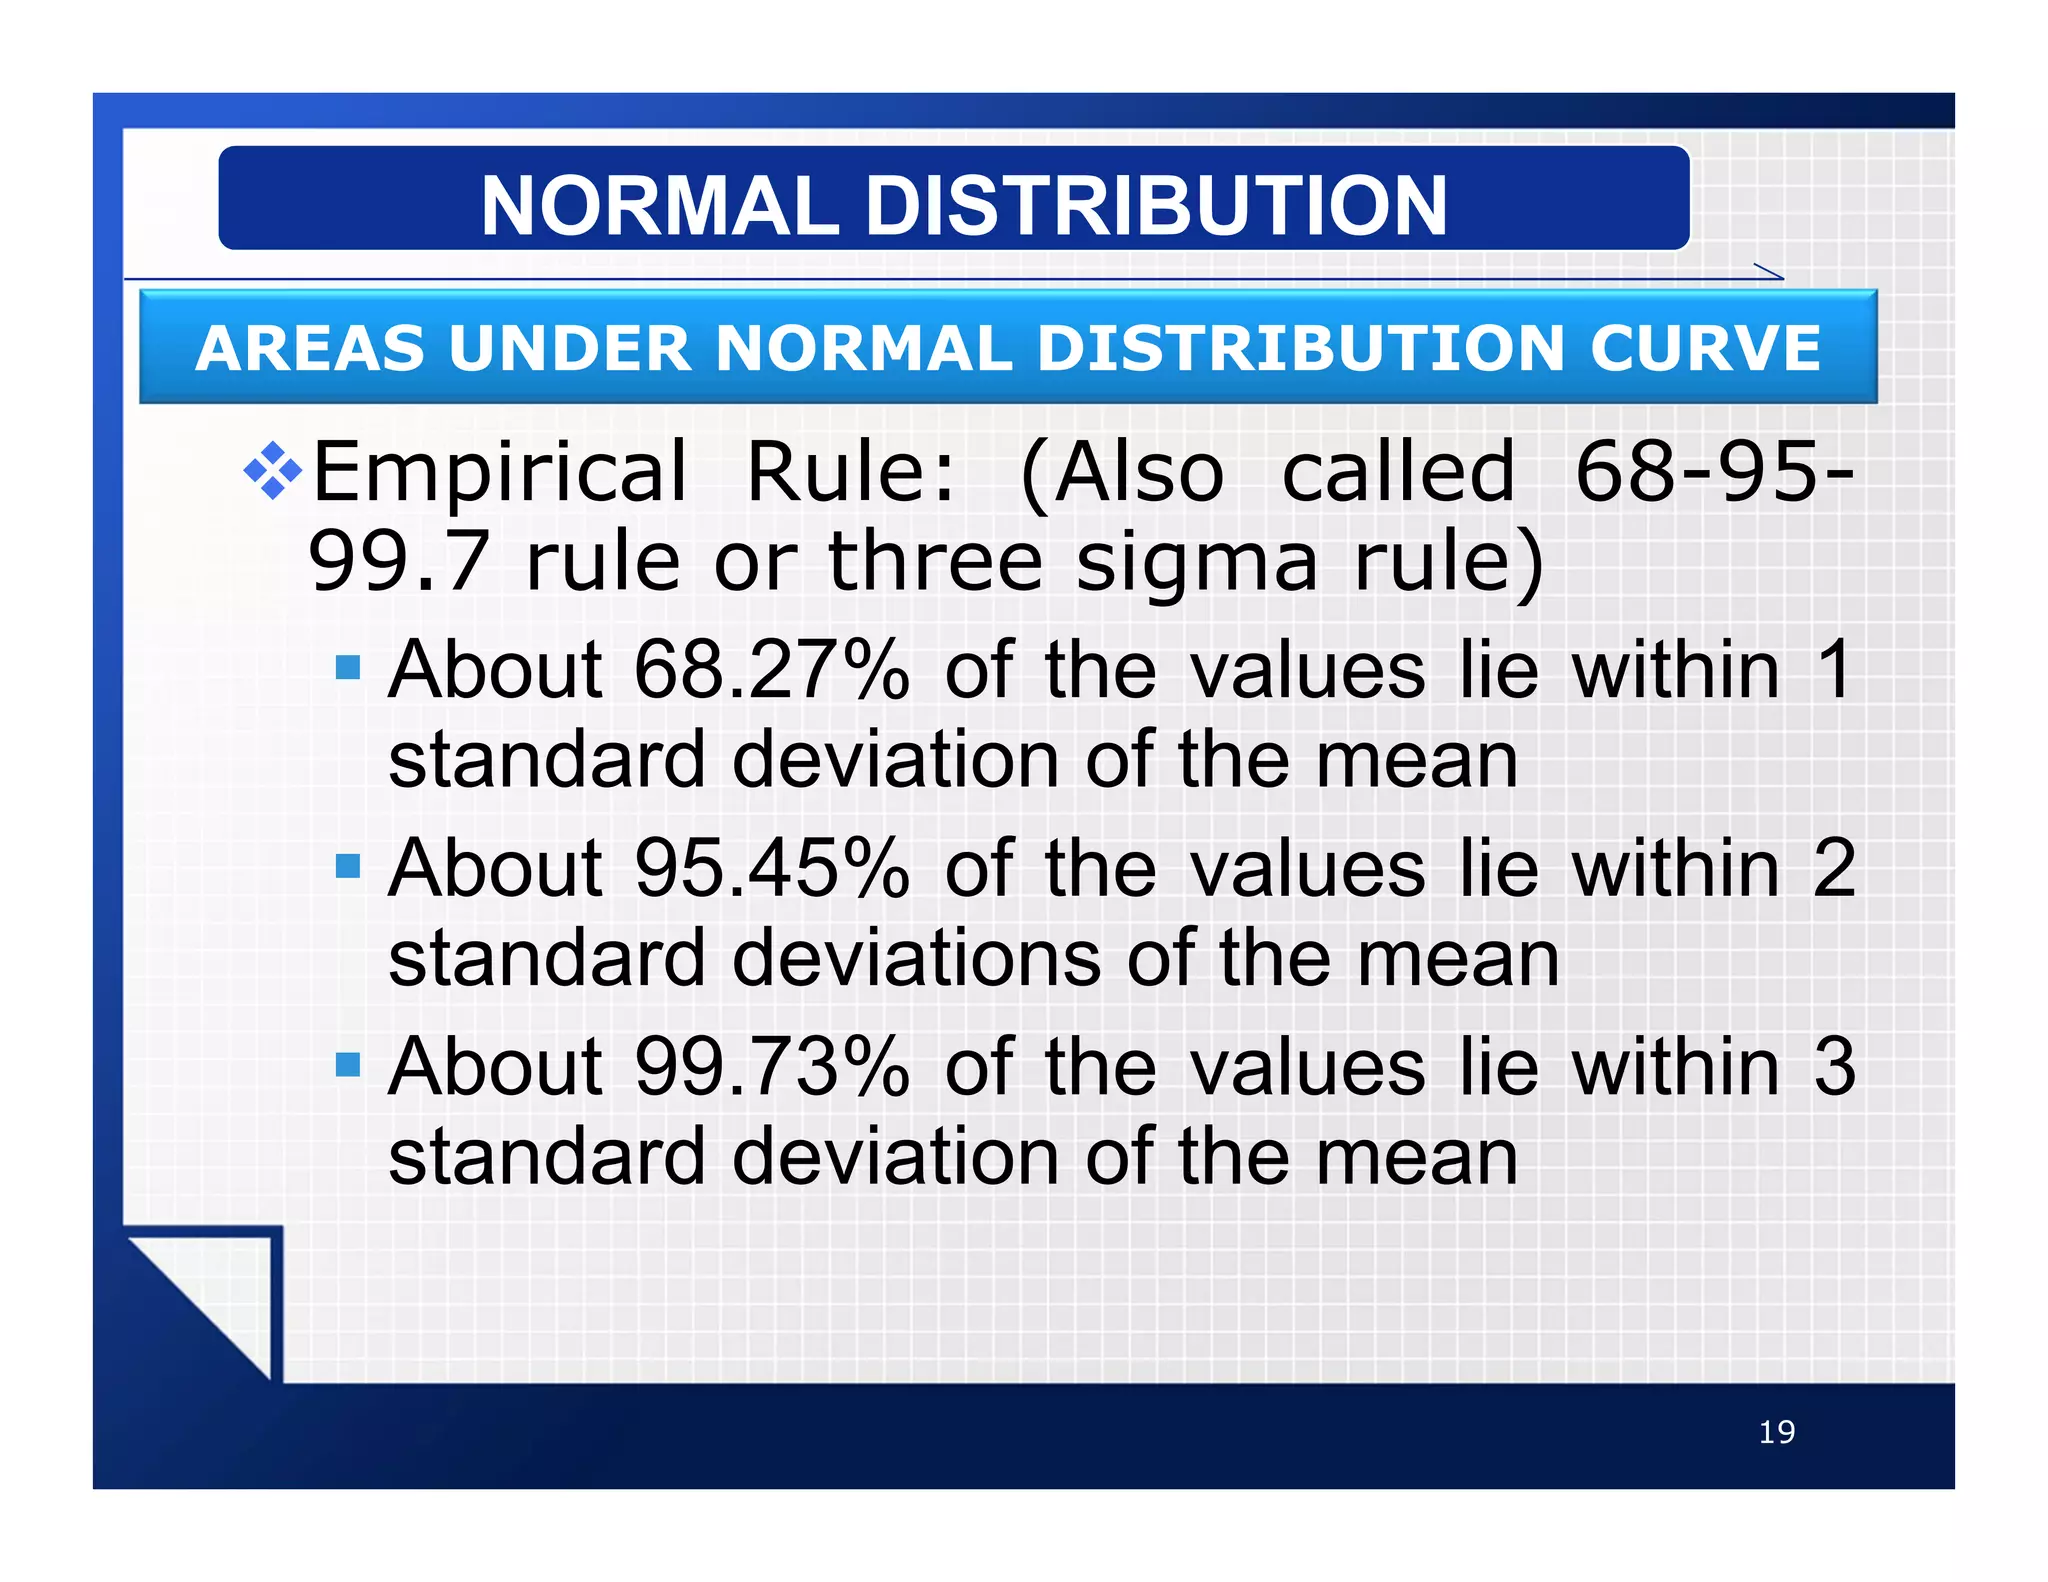
Normal Distribution and its applications
1
2
NORMAL DISTRIBUTIONS
1
™When the data values are evenly
distributed about the mean, a
distribution is said to be a
Normal Distribution (symmetric
distribution).
™A normal distribution is a
continuous, symmetric, bell-
shaped distribution of a variable.
3
NORMAL DISTRIBUTION
4
NORMAL DISTRIBUTION
™The area under a normal distribution
curve is used more often than the values
on the y axis. Therefore, when a normal
distribution is pictured, the y axis is
sometimes omitted
™The mathematical equation for a
normal distribution is;
™Where
ƒ e = 2.718
ƒ = 3.14
ƒ µ = Population Mean
ƒ =Standard Deviation
5
NORMAL DISTRIBUTION
FORMULA
™The shape and position of a
normal distribution curve
depend on two parameters;
ƒ Mean
ƒ Standard Deviation
6
NORMAL DISTRIBUTION
FORMULA
™The curve is continuous.
™The curve is bell-shaped.
™The curve is symmetrical about
the mean.
™The mean, median and mode
are located at the center of the
distribution and are equal to
each other.
7
NORMAL DISTRIBUTION
IMPORTANT PROPERTIES
™The curve never touches the x-
axis
™The total area under the normal
curve is equal to 1.
8
NORMAL DISTRIBUTION
IMPORTANT PROPERTIES
™SEI Auditors have performed the
Class C appraisal of ‘Welcome
Technologies’ for CMMI Level 2,
3, 4 and 5 processes. They
found several NCs in 18 different
process areas. No. of NCs found
in 18 process areas are enlisted
below;
™3, 5, 3, 6, 4, 8, 10, 2, 6, 5, 7, 4,
9, 5, 6, 6, 8, 7
9
NORMAL DISTRIBUTION
CASE STUDY (NCs FROM CMMI PROCESS AUDIT)
™Draw the Frequency Distribution
(Histogram) of given Data
™Analyze the Distribution Curve
10
NORMAL DISTRIBUTION
CASE STUDY (NCs FROM CMMI PROCESS AUDIT)
™Draw the Frequency Distribution Table
11
NORMAL DISTRIBUTION
CASE STUDY (NCs FROM CMMI PROCESS AUDIT)
Classes X Frequency F(x)
2 1
3 2
4 2
5 3
6 4
7 2
8 2
9 1
10 1
™Draw the Histogram
12
NORMAL DISTRIBUTION
CASE STUDY (NCs FROM CMMI PROCESS AUDIT)
™Analyze the Distribution Curve
13
NORMAL DISTRIBUTION
CASE STUDY (NCs FROM CMMI PROCESS AUDIT)
™Demo with SPSS
14
NORMAL DISTRIBUTION
CASE STUDY (NCs FROM CMMI PROCESS AUDIT)
15
NORMAL DISTRIBUTION
SHAPES OF NORMAL DISTRIBUTION
16
NORMAL DISTRIBUTION
SHAPES OF NORMAL DISTRIBUTION
17
NORMAL DISTRIBUTION
SHAPES OF NORMAL DISTRIBUTION
18
NORMAL DISTRIBUTION
AREAS UNDER NORMAL DISTRIBUTION CURVE
™Empirical Rule: (Also called 68-95-
99.7 rule or three sigma rule)
ƒ About 68.27% of the values lie within 1
standard deviation of the mean
ƒ About 95.45% of the values lie within 2
standard deviations of the mean
ƒ About 99.73% of the values lie within 3
standard deviation of the mean
19
NORMAL DISTRIBUTION
AREAS UNDER NORMAL DISTRIBUTION CURVE

Normal Distribution.pdf

  • 1.
    Normal Distribution andits applications 1
  • 2.
  • 3.
    ™When the datavalues are evenly distributed about the mean, a distribution is said to be a Normal Distribution (symmetric distribution). ™A normal distribution is a continuous, symmetric, bell- shaped distribution of a variable. 3 NORMAL DISTRIBUTION
  • 4.
    4 NORMAL DISTRIBUTION ™The areaunder a normal distribution curve is used more often than the values on the y axis. Therefore, when a normal distribution is pictured, the y axis is sometimes omitted
  • 5.
    ™The mathematical equationfor a normal distribution is; ™Where ƒ e = 2.718 ƒ = 3.14 ƒ µ = Population Mean ƒ =Standard Deviation 5 NORMAL DISTRIBUTION FORMULA
  • 6.
    ™The shape andposition of a normal distribution curve depend on two parameters; ƒ Mean ƒ Standard Deviation 6 NORMAL DISTRIBUTION FORMULA
  • 7.
    ™The curve iscontinuous. ™The curve is bell-shaped. ™The curve is symmetrical about the mean. ™The mean, median and mode are located at the center of the distribution and are equal to each other. 7 NORMAL DISTRIBUTION IMPORTANT PROPERTIES
  • 8.
    ™The curve nevertouches the x- axis ™The total area under the normal curve is equal to 1. 8 NORMAL DISTRIBUTION IMPORTANT PROPERTIES
  • 9.
    ™SEI Auditors haveperformed the Class C appraisal of ‘Welcome Technologies’ for CMMI Level 2, 3, 4 and 5 processes. They found several NCs in 18 different process areas. No. of NCs found in 18 process areas are enlisted below; ™3, 5, 3, 6, 4, 8, 10, 2, 6, 5, 7, 4, 9, 5, 6, 6, 8, 7 9 NORMAL DISTRIBUTION CASE STUDY (NCs FROM CMMI PROCESS AUDIT)
  • 10.
    ™Draw the FrequencyDistribution (Histogram) of given Data ™Analyze the Distribution Curve 10 NORMAL DISTRIBUTION CASE STUDY (NCs FROM CMMI PROCESS AUDIT)
  • 11.
    ™Draw the FrequencyDistribution Table 11 NORMAL DISTRIBUTION CASE STUDY (NCs FROM CMMI PROCESS AUDIT) Classes X Frequency F(x) 2 1 3 2 4 2 5 3 6 4 7 2 8 2 9 1 10 1
  • 12.
    ™Draw the Histogram 12 NORMALDISTRIBUTION CASE STUDY (NCs FROM CMMI PROCESS AUDIT)
  • 13.
    ™Analyze the DistributionCurve 13 NORMAL DISTRIBUTION CASE STUDY (NCs FROM CMMI PROCESS AUDIT)
  • 14.
    ™Demo with SPSS 14 NORMALDISTRIBUTION CASE STUDY (NCs FROM CMMI PROCESS AUDIT)
  • 15.
  • 16.
  • 17.
  • 18.
    18 NORMAL DISTRIBUTION AREAS UNDERNORMAL DISTRIBUTION CURVE
  • 19.
    ™Empirical Rule: (Alsocalled 68-95- 99.7 rule or three sigma rule) ƒ About 68.27% of the values lie within 1 standard deviation of the mean ƒ About 95.45% of the values lie within 2 standard deviations of the mean ƒ About 99.73% of the values lie within 3 standard deviation of the mean 19 NORMAL DISTRIBUTION AREAS UNDER NORMAL DISTRIBUTION CURVE