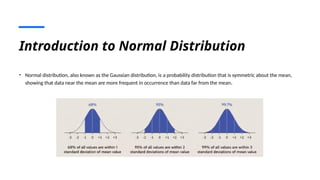
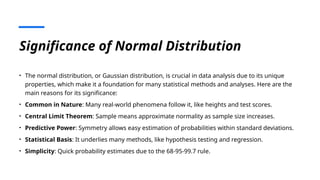
Normal Distribution Utilized in
Statistics, Business Settings,
and Government Entities
OVERVIEW OF APPLICATIONS, BENEFITS,
AND LIMITATIONS
Introduction to Normal Distribution
• Normal distribution, also known as the Gaussian distribution, is a probability distribution that is symmetric about the mean,
showing that data near the mean are more frequent in occurrence than data far from the mean.
Formula:
• where:
• x = value of the variable or data being examined and f(x) the probability function
• μ = the mean
• σ = the standard deviation
Significance of Normal Distribution
• The normal distribution, or Gaussian distribution, is crucial in data analysis due to its unique
properties, which make it a foundation for many statistical methods and analyses. Here are the
main reasons for its significance:
• Common in Nature: Many real-world phenomena follow it, like heights and test scores.
• Central Limit Theorem: Sample means approximate normality as sample size increases.
• Predictive Power: Symmetry allows easy estimation of probabilities within standard deviations.
• Statistical Basis: It underlies many methods, like hypothesis testing and regression.
• Simplicity: Quick probability estimates due to the 68-95-99.7 rule.
Applications in Statistics
• Central Limit Theorem (CLT): Allows use of normal distribution in various statistical
methods
• Hypothesis Testing: Helps determine if a sample differs from the population
• Confidence Intervals: Used to estimate population parameters
Normal Distribution in Business
• Financial Analysis: Modelling asset returns and calculating risk (e.g., Value at Risk)
• Quality Control: Informs Six Sigma methods to minimize defects
• Market Research: Forecasts sales trends and consumer behaviour
• Risk Management: Evaluates potential outcomes and prepares strategies
Role in Government Entities
• Public Health: Analyzes disease prevalence and trends for health planning.
• Economic Policy: Models and forecasts economic indicators like inflation
• Disaster Preparedness: Assesses natural disaster impacts for response planning
Challenges and Limitations
• Assumption of Normality: Often assumed but not always accurate
• Skewed Data: Issues with skewed distributions and fat tails
• Outliers: Sensitivity to extreme values affecting accuracy
• Sample Size: Small samples may not meet normal distribution criteria
Future Scope
• Advancements in Statistics: Computational and machine learning enhancements
• Integration in Business: AI and predictive analytics for market insights
• Policy Modelling in Government: Decision support systems for complex socio-
economic issues
Conclusion
• Normal distribution is a foundational tool across statistics, business, and government,
helping analyze data, manage risks, and make informed decisions. Its wide-ranging
applications—from financial forecasting to public health modelling—demonstrate its
value in understanding and interpreting data. Despite challenges like sensitivity to
outliers and the assumption of normality, it remains crucial for accurate analysis and
effective decision-making in complex, real-world situations. By leveraging normal
distribution principles, we can enhance insights, optimize processes, and support
strategic planning across various sectors.
Thank You !!!

ppt on normal distribution utilized in sta.pptx

  • 1.
    Normal Distribution Utilizedin Statistics, Business Settings, and Government Entities OVERVIEW OF APPLICATIONS, BENEFITS, AND LIMITATIONS
  • 2.
    Introduction to NormalDistribution • Normal distribution, also known as the Gaussian distribution, is a probability distribution that is symmetric about the mean, showing that data near the mean are more frequent in occurrence than data far from the mean.
  • 3.
    Formula: • where: • x= value of the variable or data being examined and f(x) the probability function • μ = the mean • σ = the standard deviation
  • 4.
    Significance of NormalDistribution • The normal distribution, or Gaussian distribution, is crucial in data analysis due to its unique properties, which make it a foundation for many statistical methods and analyses. Here are the main reasons for its significance: • Common in Nature: Many real-world phenomena follow it, like heights and test scores. • Central Limit Theorem: Sample means approximate normality as sample size increases. • Predictive Power: Symmetry allows easy estimation of probabilities within standard deviations. • Statistical Basis: It underlies many methods, like hypothesis testing and regression. • Simplicity: Quick probability estimates due to the 68-95-99.7 rule.
  • 5.
    Applications in Statistics •Central Limit Theorem (CLT): Allows use of normal distribution in various statistical methods • Hypothesis Testing: Helps determine if a sample differs from the population • Confidence Intervals: Used to estimate population parameters
  • 6.
    Normal Distribution inBusiness • Financial Analysis: Modelling asset returns and calculating risk (e.g., Value at Risk) • Quality Control: Informs Six Sigma methods to minimize defects • Market Research: Forecasts sales trends and consumer behaviour • Risk Management: Evaluates potential outcomes and prepares strategies
  • 7.
    Role in GovernmentEntities • Public Health: Analyzes disease prevalence and trends for health planning. • Economic Policy: Models and forecasts economic indicators like inflation • Disaster Preparedness: Assesses natural disaster impacts for response planning
  • 8.
    Challenges and Limitations •Assumption of Normality: Often assumed but not always accurate • Skewed Data: Issues with skewed distributions and fat tails • Outliers: Sensitivity to extreme values affecting accuracy • Sample Size: Small samples may not meet normal distribution criteria
  • 9.
    Future Scope • Advancementsin Statistics: Computational and machine learning enhancements • Integration in Business: AI and predictive analytics for market insights • Policy Modelling in Government: Decision support systems for complex socio- economic issues
  • 10.
    Conclusion • Normal distributionis a foundational tool across statistics, business, and government, helping analyze data, manage risks, and make informed decisions. Its wide-ranging applications—from financial forecasting to public health modelling—demonstrate its value in understanding and interpreting data. Despite challenges like sensitivity to outliers and the assumption of normality, it remains crucial for accurate analysis and effective decision-making in complex, real-world situations. By leveraging normal distribution principles, we can enhance insights, optimize processes, and support strategic planning across various sectors.
  • 11.