Download to read offline

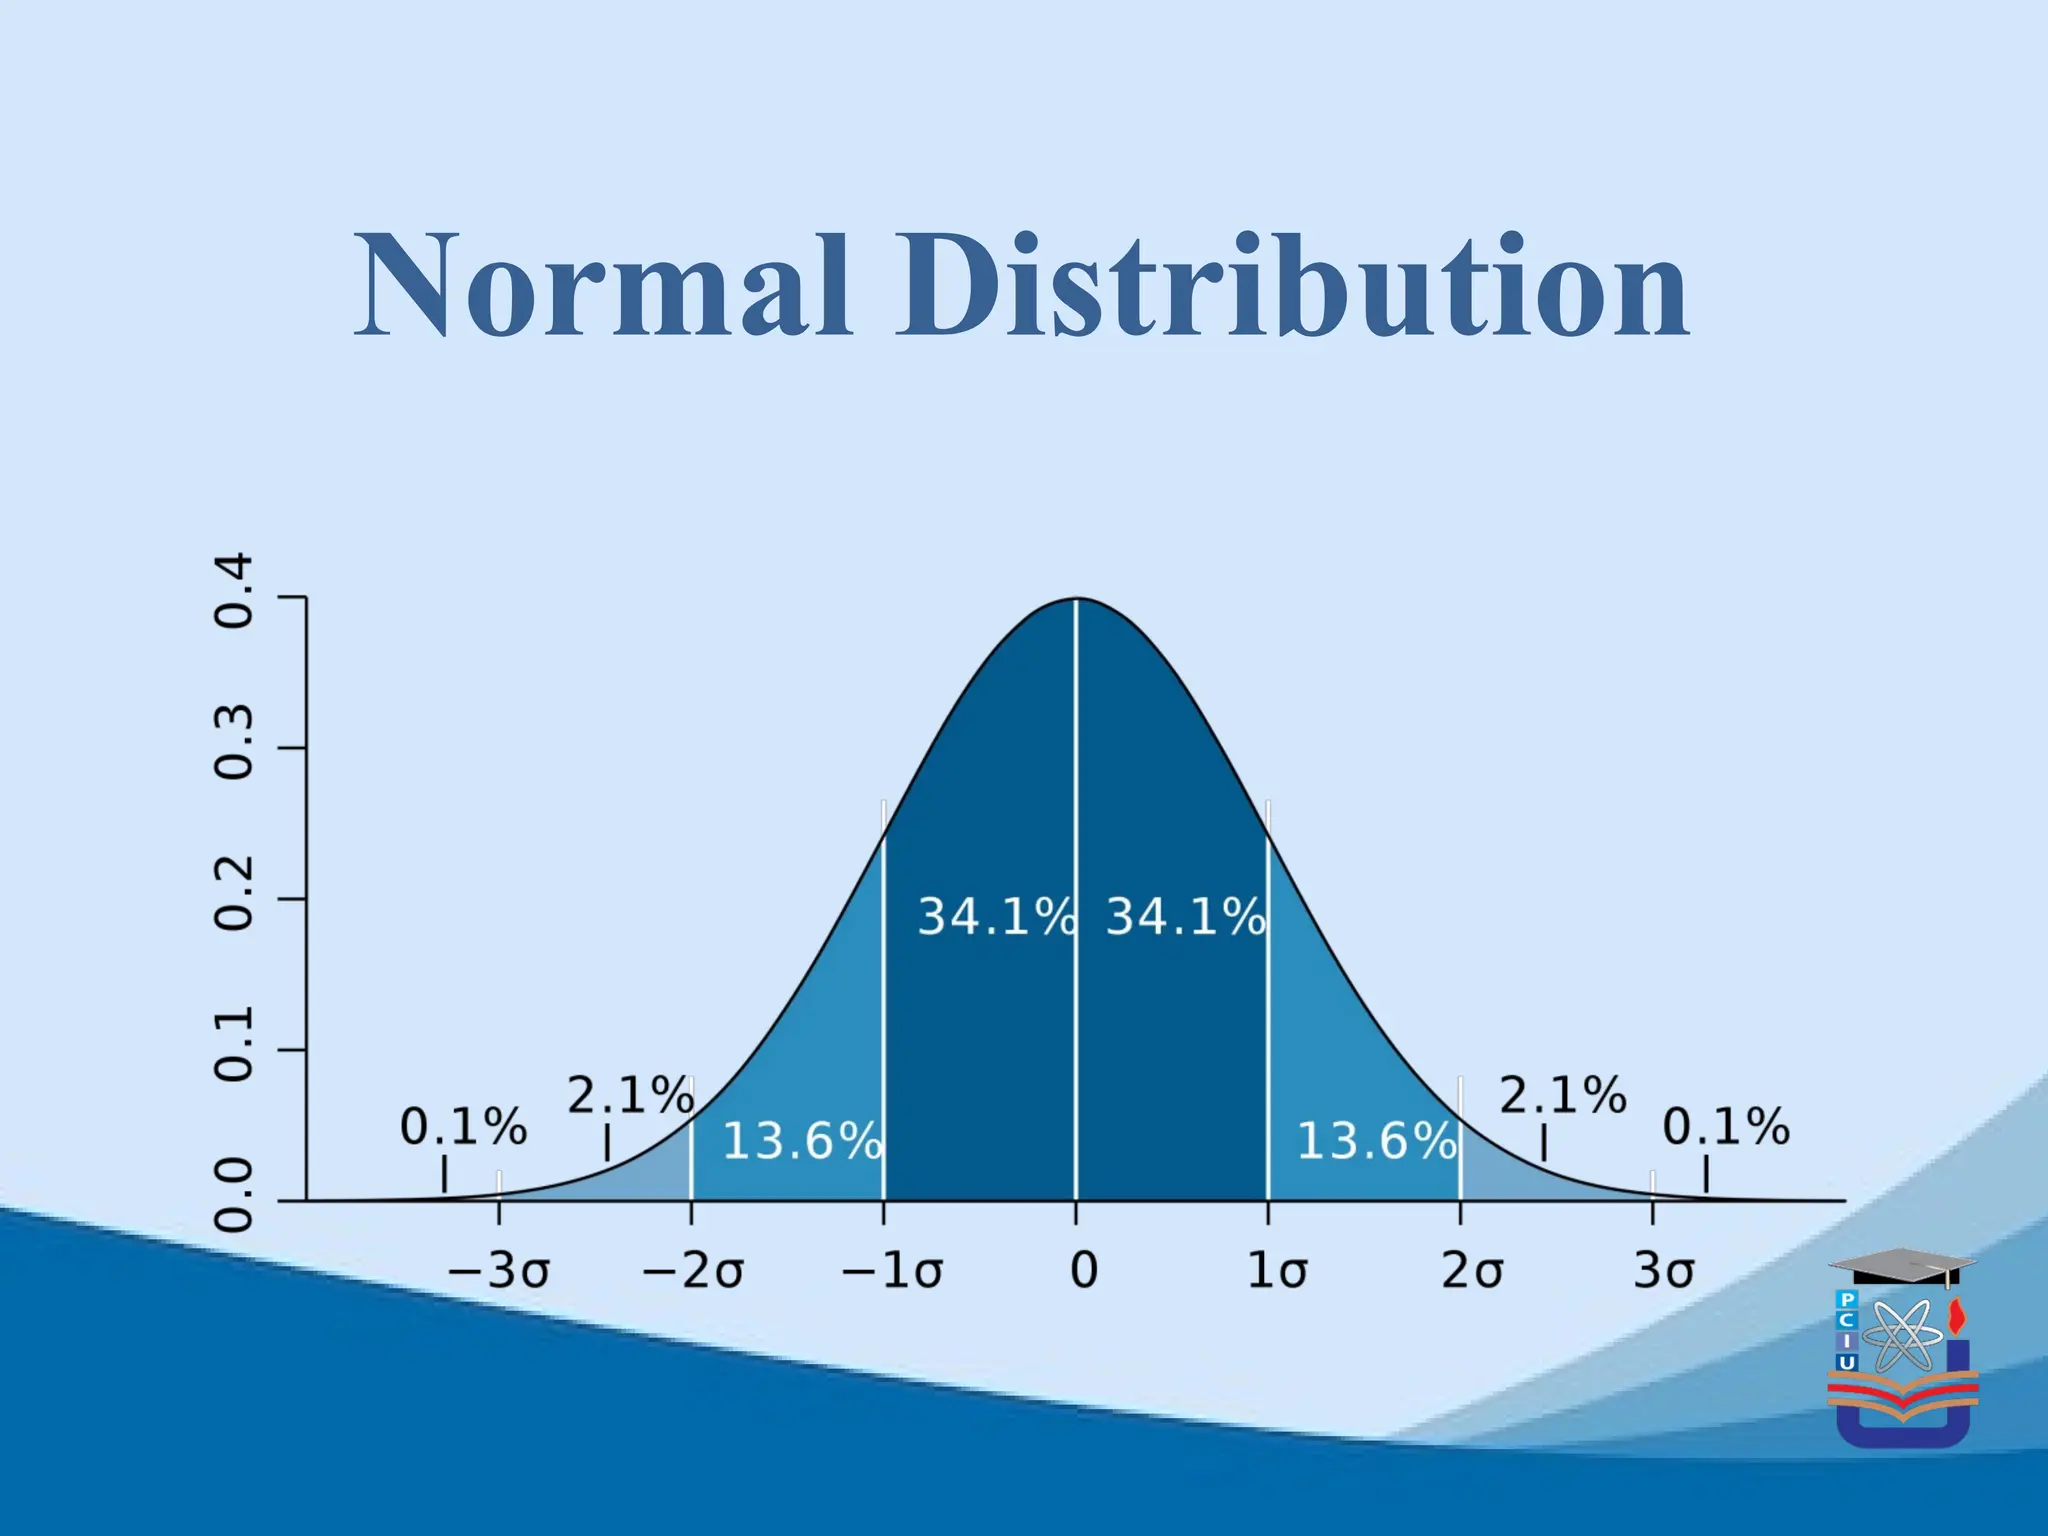
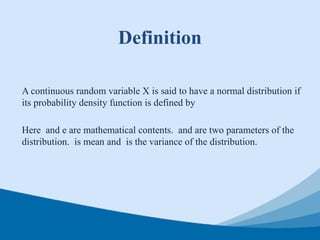
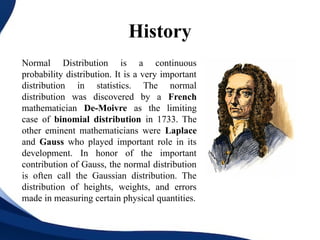


The document provides an overview of normal distribution, defining it as a continuous probability distribution characterized by its mean and variance. It discusses the historical background, applications in various fields such as statistics, finance, and computer science, and outlines its key characteristics, such as symmetry and the bell-shaped curve. The conclusion emphasizes the appropriate use of normal distribution in analyzing continuous, symmetric, and bell-shaped data while cautioning against its use in skewed or multimodal datasets.


![제 23회 보아즈(BOAZ) 빅데이터 컨퍼런스 - [MBOAX] : ABSA를 활용한 소비자 반응 분석 기반 운영 효율화 대시보드 설계](https://cdn.slidesharecdn.com/ss_thumbnails/3-1boaz23rdconferencemboax-260203102709-9d519923-thumbnail.jpg?width=640&height=640&fit=bounds)


