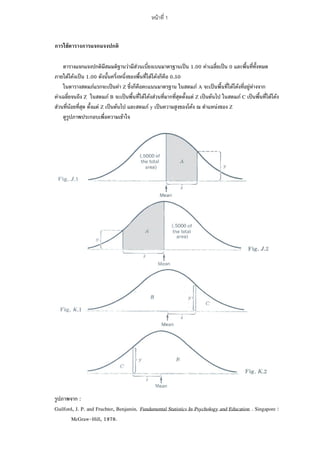
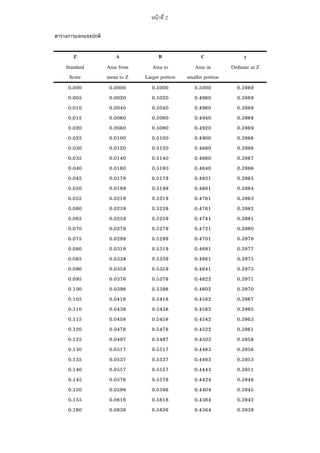
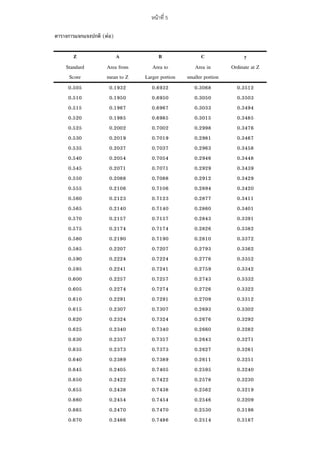
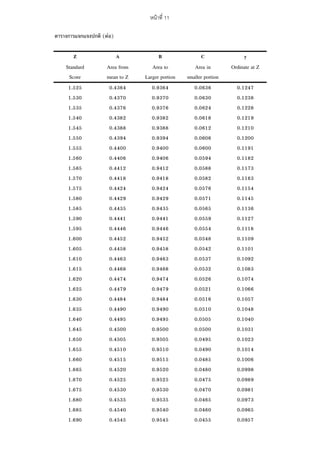
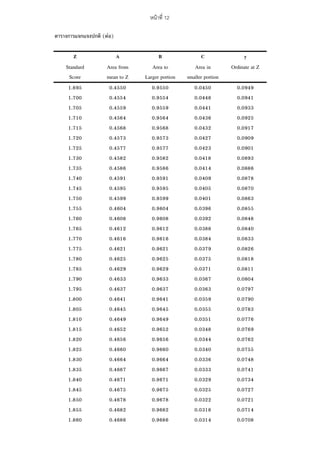
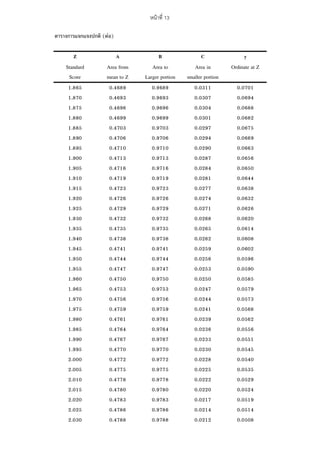
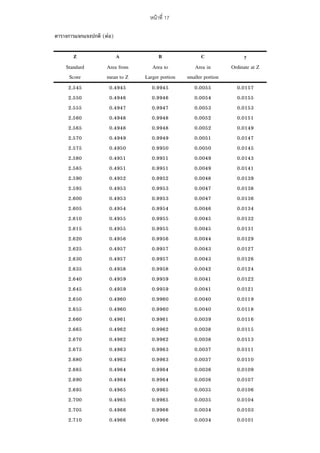
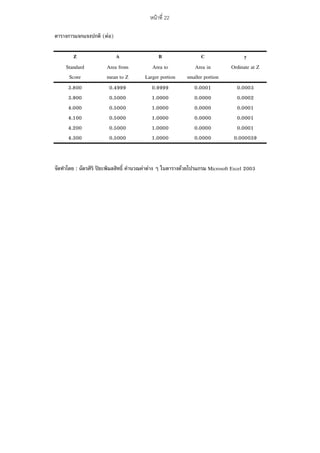
1. The document presents a table with standardized normal distribution values including the z-score, the areas under the normal curve to the left and right of the z-score, and the ordinate value at that z-score.
2. It provides the z-score from 0 to 0.725 in increments of 0.005 and the corresponding standard normal distribution values.
3. The table is referenced from the textbook "Fundamental Statistics In Psychology and Education" by Guilford and Fruchter published in 1978.