Download to read offline
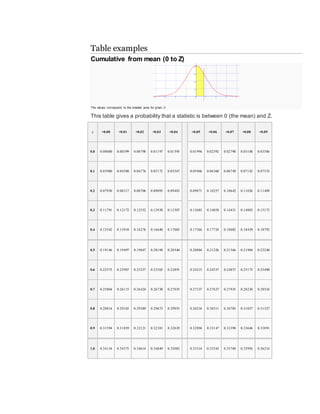
![2.8 0.49744 0.49752 0.49760 0.49767 0.49774 0.49781 0.49788 0.49795 0.49801 0.49807
2.9 0.49813 0.49819 0.49825 0.49831 0.49836 0.49841 0.49846 0.49851 0.49856 0.49861
3.0 0.49865 0.49869 0.49874 0.49878 0.49882 0.49886 0.49889 0.49893 0.49896 0.49900
[2]
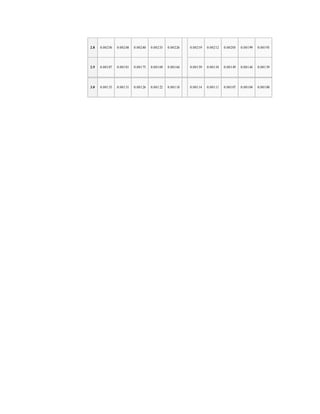
Cumulative
This table gives a probability that a statistic is less than Z (i.e. between negative infinity
and Z).
z +0.00 +0.01 +0.02 +0.03 +0.04 +0.05 +0.06 +0.07 +0.08 +0.09
0.0 0.50000 0.50399 0.50798 0.51197 0.51595 0.51994 0.52392 0.52790 0.53188 0.53586
0.1 0.53980 0.54380 0.54776 0.55172 0.55567 0.55966 0.56360 0.56749 0.57142 0.57535
0.2 0.57930 0.58317 0.58706 0.59095 0.59483 0.59871 0.60257 0.60642 0.61026 0.61409
0.3 0.61791 0.62172 0.62552 0.62930 0.63307 0.63683 0.64058 0.64431 0.64803 0.65173
0.4 0.65542 0.65910 0.66276 0.66640 0.67003 0.67364 0.67724 0.68082 0.68439 0.68793
0.5 0.69146 0.69497 0.69847 0.70194 0.70540 0.70884 0.71226 0.71566 0.71904 0.72240
0.6 0.72575 0.72907 0.73237 0.73565 0.73891 0.74215 0.74537 0.74857 0.75175 0.75490
0.7 0.75804 0.76115 0.76424 0.76730 0.77035 0.77337 0.77637 0.77935 0.78230 0.78524
0.8 0.78814 0.79103 0.79389 0.79673 0.79955 0.80234 0.80511 0.80785 0.81057 0.81327
0.9 0.81594 0.81859 0.82121 0.82381 0.82639 0.82894 0.83147 0.83398 0.83646 0.83891
1.0 0.84134 0.84375 0.84614 0.84849 0.85083 0.85314 0.85543 0.85769 0.85993 0.86214](https://image.slidesharecdn.com/z-distribution1-171229132404/85/Z-distribution-3-320.jpg)
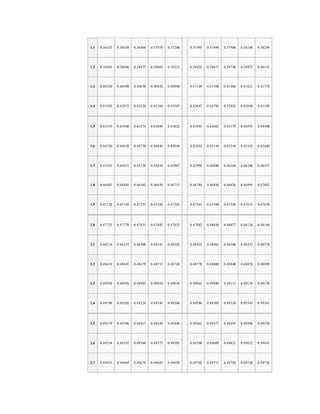
![2.8 0.99744 0.99752 0.99760 0.99767 0.99774 0.99781 0.99788 0.99795 0.99801 0.99807
2.9 0.99813 0.99819 0.99825 0.99831 0.99836 0.99841 0.99846 0.99851 0.99856 0.99861
3.0 0.99865 0.99869 0.99874 0.99878 0.99882 0.99886 0.99889 0.99893 0.99896 0.99900
[3]
Complementary cumulative
This table gives a probability that a statistic is greater than Z.
z +0.00 +0.01 +0.02 +0.03 +0.04 +0.05 +0.06 +0.07 +0.08 +0.09
0.0 0.50000 0.49601 0.49202 0.48803 0.48405 0.48006 0.47608 0.47210 0.46812 0.46414
0.1 0.46020 0.45620 0.45224 0.44828 0.44433 0.44034 0.43640 0.43251 0.42858 0.42465
0.2 0.42070 0.41683 0.41294 0.40905 0.40517 0.40129 0.39743 0.39358 0.38974 0.38591
0.3 0.38209 0.37828 0.37448 0.37070 0.36693 0.36317 0.35942 0.35569 0.35197 0.34827
0.4 0.34458 0.34090 0.33724 0.33360 0.32997 0.32636 0.32276 0.31918 0.31561 0.31207
0.5 0.30854 0.30503 0.30153 0.29806 0.29460 0.29116 0.28774 0.28434 0.28096 0.27760
0.6 0.27425 0.27093 0.26763 0.26435 0.26109 0.25785 0.25463 0.25143 0.24825 0.24510
0.7 0.24196 0.23885 0.23576 0.23270 0.22965 0.22663 0.22363 0.22065 0.21770 0.21476
0.8 0.21186 0.20897 0.20611 0.20327 0.20045 0.19766 0.19489 0.19215 0.18943 0.18673
0.9 0.18406 0.18141 0.17879 0.17619 0.17361 0.17106 0.16853 0.16602 0.16354 0.16109
1.0 0.15866 0.15625 0.15386 0.15151 0.14917 0.14686 0.14457 0.14231 0.14007 0.13786](https://image.slidesharecdn.com/z-distribution1-171229132404/85/Z-distribution-5-320.jpg)
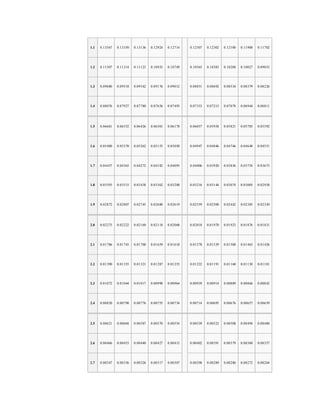

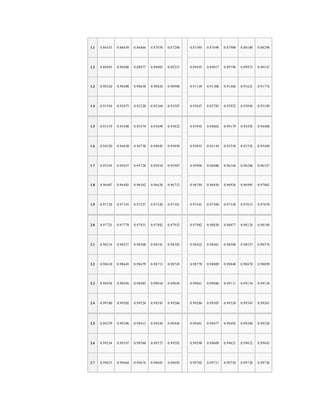
This document contains tables of probability values corresponding to the area under the normal distribution curve for given z-values. There are three tables that provide the probability of a statistic being: 1) between 0 and z, 2) less than z, and 3) greater than z. The tables allow looking up the cumulative probability for any z-value between 0 and 3 with increments of 0.01.


