Download to read offline
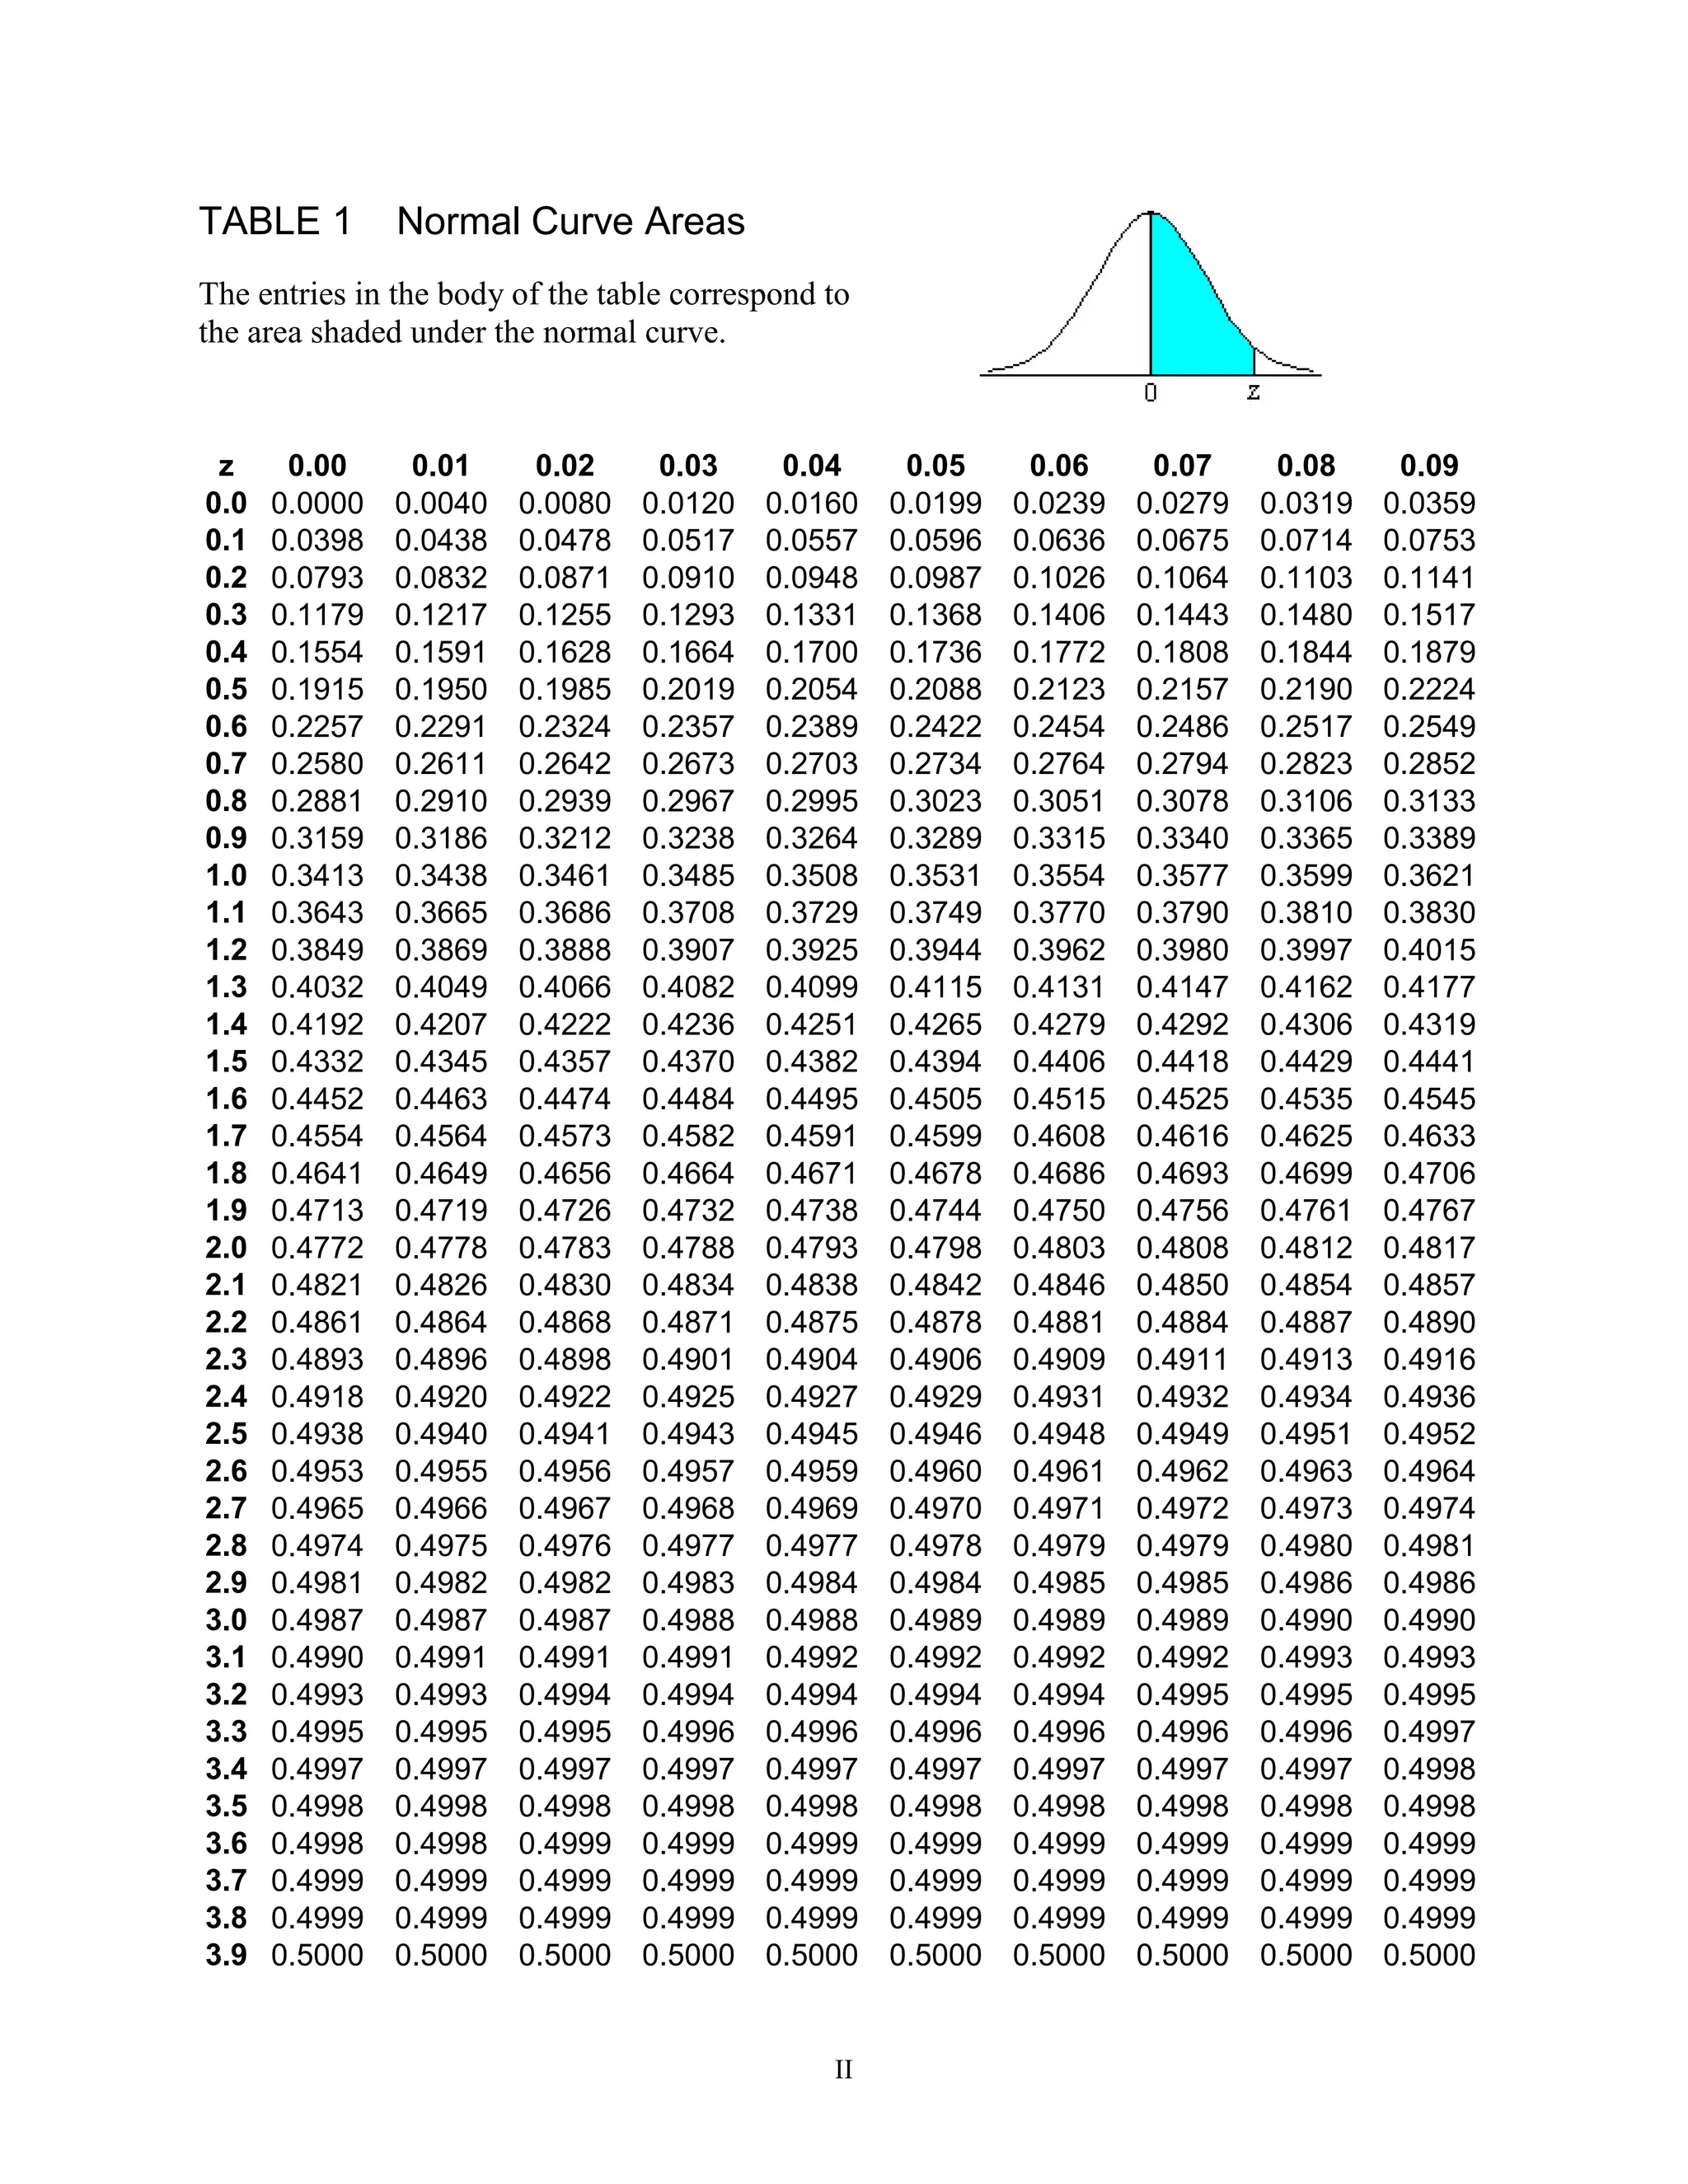

The document contains a table presenting areas under the normal curve corresponding to varying z-scores. Each entry provides the cumulative probability for z-scores ranging from 0.00 to 3.99. This table is a useful reference for statistical analysis involving the normal distribution.


