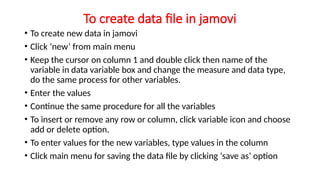
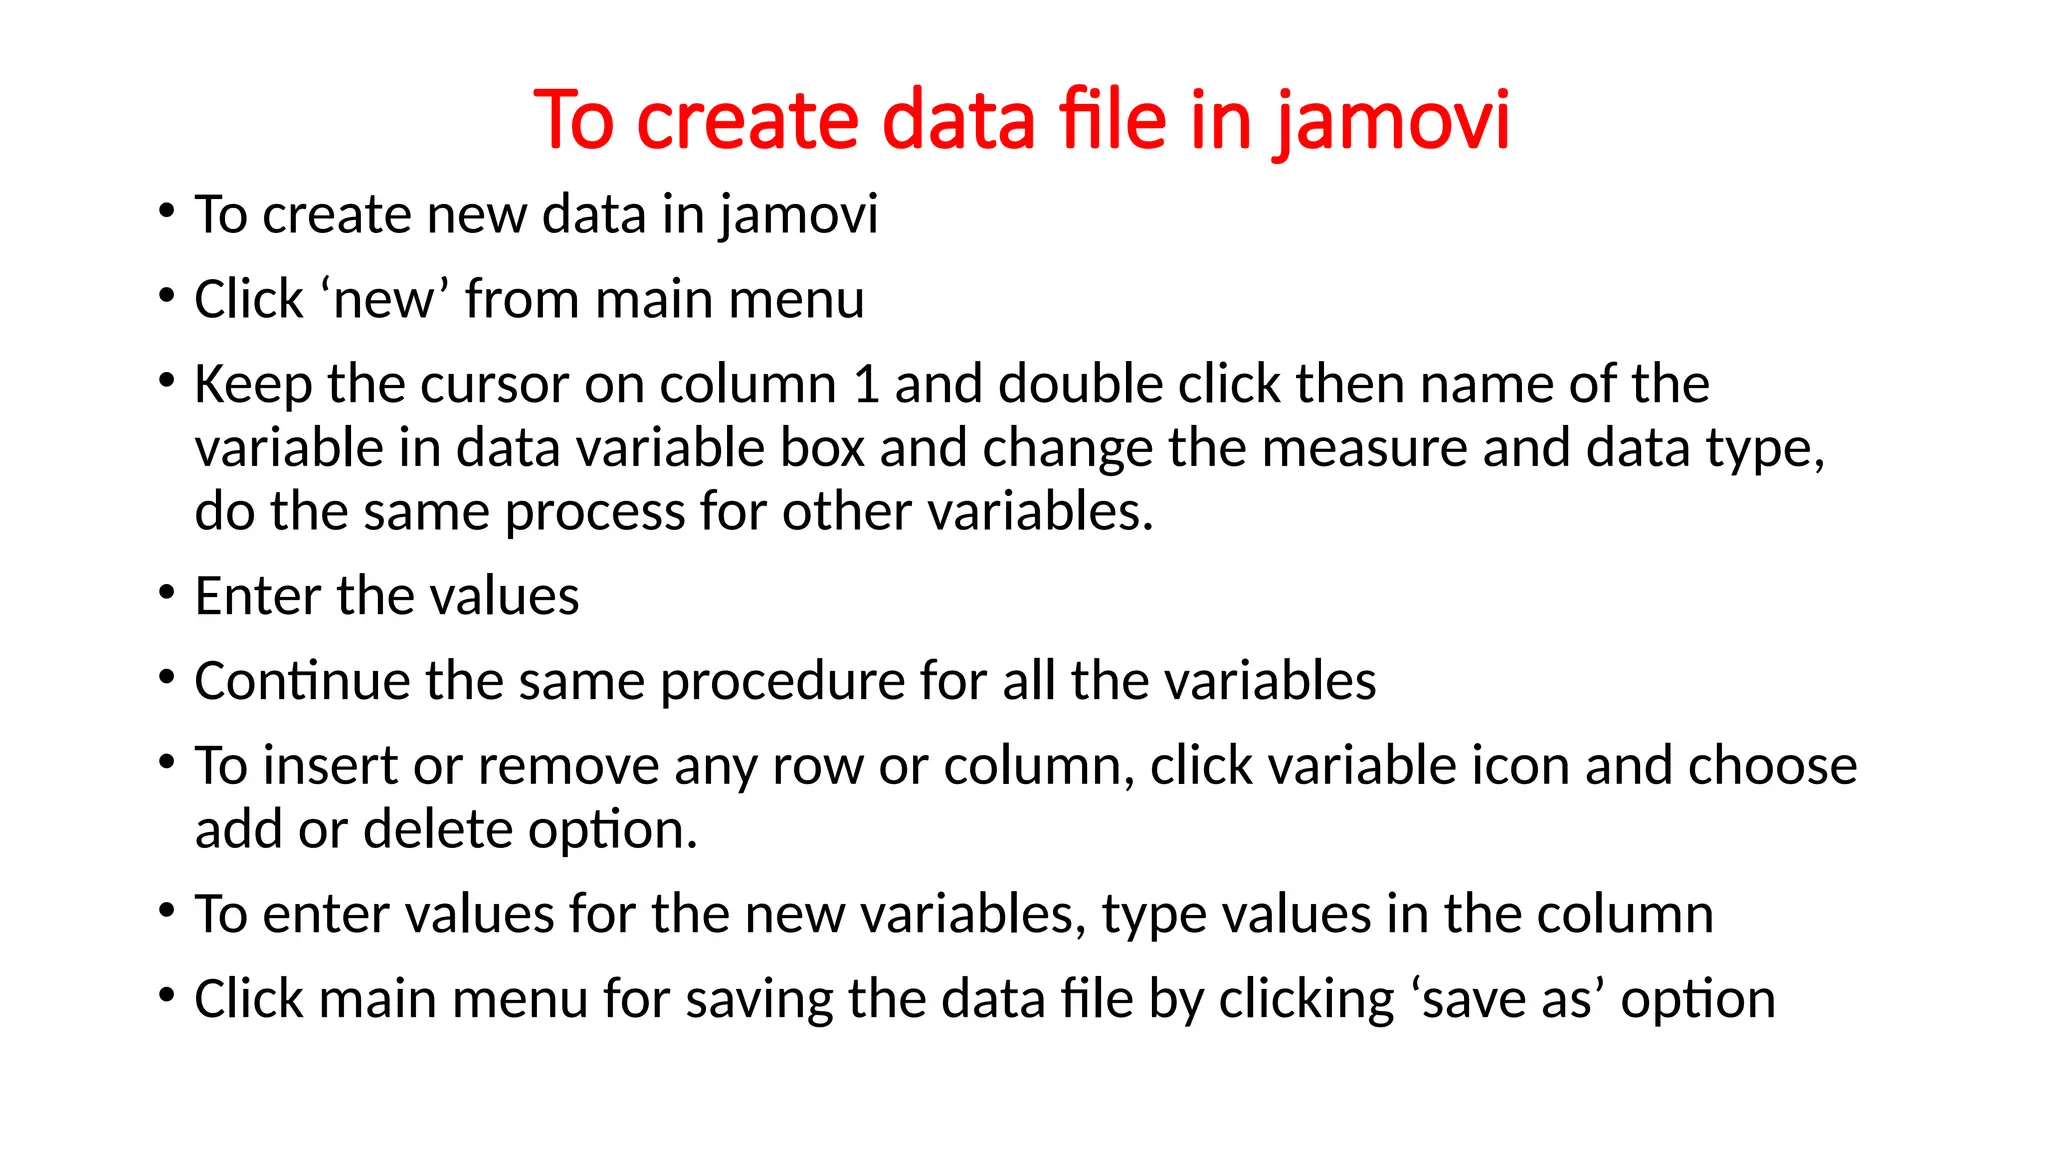
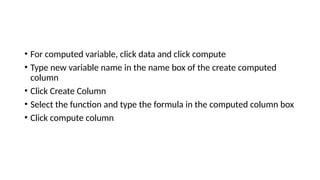
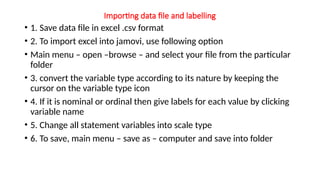
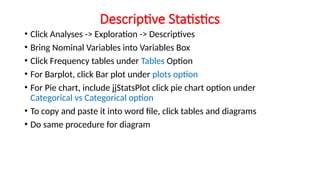
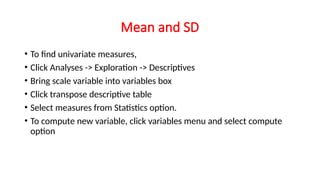
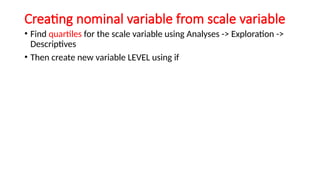
To create data file in jamovi
• To create new data in jamovi
• Click ‘new’ from main menu
• Keep the cursor on column 1 and double click then name of the
variable in data variable box and change the measure and data type,
do the same process for other variables.
• Enter the values
• Continue the same procedure for all the variables
• To insert or remove any row or column, click variable icon and choose
add or delete option.
• To enter values for the new variables, type values in the column
• Click main menu for saving the data file by clicking ‘save as’ option
• For computed variable, click data and click compute
• Type new variable name in the name box of the create computed
column
• Click Create Column
• Select the function and type the formula in the computed column box
• Click compute column
Filtering data
• Click filter icon which is available in the top menus
• Type required condition in the box
• To see the row values click eye icon
• To remove filter, click ‘X’ button
• To get original data, click filter icon
Importing data file and labelling
• 1. Save data file in excel .csv format
• 2. To import excel into jamovi, use following option
• Main menu – open –browse – and select your file from the particular
folder
• 3. convert the variable type according to its nature by keeping the
cursor on the variable type icon
• 4. If it is nominal or ordinal then give labels for each value by clicking
variable name
• 5. Change all statement variables into scale type
• 6. To save, main menu – save as – computer and save into folder
Descriptive Statistics
• Click Analyses -> Exploration -> Descriptives
• Bring Nominal Variables into Variables Box
• Click Frequency tables under Tables Option
• For Barplot, click Bar plot under plots option
• For Pie chart, include jjStatsPlot click pie chart option under
Categorical vs Categorical option
• To copy and paste it into word file, click tables and diagrams
• Do same procedure for diagram
Mean and SD
• To find univariate measures,
• Click Analyses -> Exploration -> Descriptives
• Bring scale variable into variables box
• Click transpose descriptive table
• Select measures from Statistics option.
• To compute new variable, click variables menu and select compute
option
Creating nominal variable from scale variable
• Find quartiles for the scale variable using Analyses -> Exploration ->
Descriptives
• Then create new variable LEVEL using if

Descriptive Statistics.pptx- Statistical data analysis

  • 1.
    To create datafile in jamovi • To create new data in jamovi • Click ‘new’ from main menu • Keep the cursor on column 1 and double click then name of the variable in data variable box and change the measure and data type, do the same process for other variables. • Enter the values • Continue the same procedure for all the variables • To insert or remove any row or column, click variable icon and choose add or delete option. • To enter values for the new variables, type values in the column • Click main menu for saving the data file by clicking ‘save as’ option
  • 2.
    • For computedvariable, click data and click compute • Type new variable name in the name box of the create computed column • Click Create Column • Select the function and type the formula in the computed column box • Click compute column
  • 3.
    Filtering data • Clickfilter icon which is available in the top menus • Type required condition in the box • To see the row values click eye icon • To remove filter, click ‘X’ button • To get original data, click filter icon
  • 4.
    Importing data fileand labelling • 1. Save data file in excel .csv format • 2. To import excel into jamovi, use following option • Main menu – open –browse – and select your file from the particular folder • 3. convert the variable type according to its nature by keeping the cursor on the variable type icon • 4. If it is nominal or ordinal then give labels for each value by clicking variable name • 5. Change all statement variables into scale type • 6. To save, main menu – save as – computer and save into folder
  • 5.
    Descriptive Statistics • ClickAnalyses -> Exploration -> Descriptives • Bring Nominal Variables into Variables Box • Click Frequency tables under Tables Option • For Barplot, click Bar plot under plots option • For Pie chart, include jjStatsPlot click pie chart option under Categorical vs Categorical option • To copy and paste it into word file, click tables and diagrams • Do same procedure for diagram
  • 6.
    Mean and SD •To find univariate measures, • Click Analyses -> Exploration -> Descriptives • Bring scale variable into variables box • Click transpose descriptive table • Select measures from Statistics option. • To compute new variable, click variables menu and select compute option
  • 7.
    Creating nominal variablefrom scale variable • Find quartiles for the scale variable using Analyses -> Exploration -> Descriptives • Then create new variable LEVEL using if