Downloaded 96 times


![NET NPA RATIO
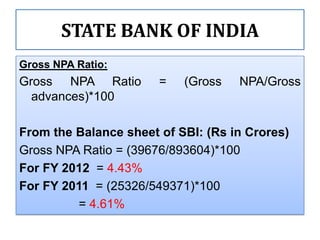
Net NPA Ratio:
NET NPA RATIO =
[(Gross NPA – Provisions)/(Gross Advances –
Provisions)]*100
For FY 2012 = [(39676 – 24884)/ (893604 – 24884)]*100
= 1.82%
For FY 2011= [(25326 – 22060)/ (549371 – 22060)]*100
= 1.63%](https://image.slidesharecdn.com/nonperformingassets-130405114701-phpapp02/85/Non-performing-assets-13-320.jpg)
![NET NPA RATIO
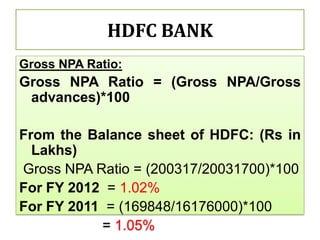
Net NPA Ratio:
NET NPA RATIO =
[(Gross NPA – Provisions)/(Gross Advances –
Provisions)]*100
For FY 2012 = [(200317 – 164898)/ (20031700 –
164898)]*100
= 0.18%
For FY 2011= [(25326 –139986)/ (16176000 –
139986)]*100
= 0.19%](https://image.slidesharecdn.com/nonperformingassets-130405114701-phpapp02/85/Non-performing-assets-15-320.jpg)
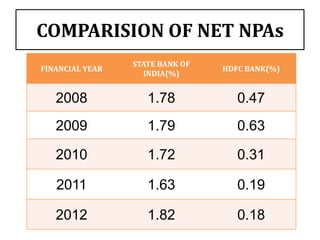
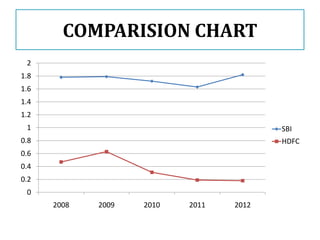


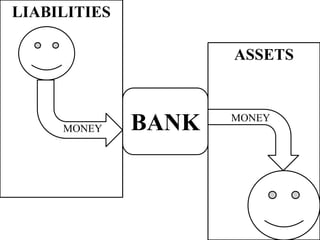
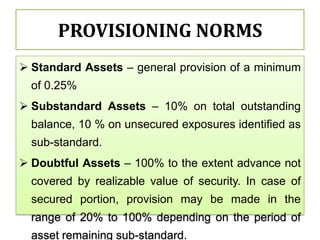
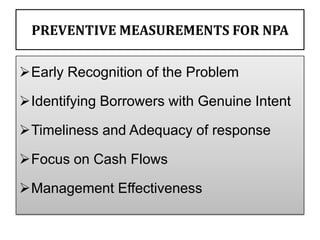
This document compares the non-performing assets (NPAs) of State Bank of India and HDFC Bank for the years 2008-2012. It defines NPAs and outlines categories and provisioning norms. SBI had higher gross and net NPA ratios compared to HDFC Bank for all years. While SBI's gross NPA ratio ranged from 4.43% to 4.61%, HDFC Bank's ratio was lower at 1.02% to 1.05%. Similarly, SBI's net NPA ratio was between 1.63% to 1.82% versus 0.18% to 0.19% for HDFC Bank, indicating better asset quality and loan recovery rates at HDFC Bank. The document concludes with a


