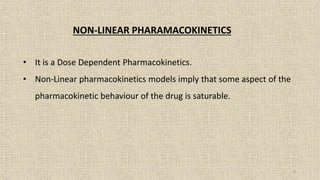
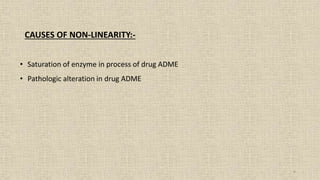
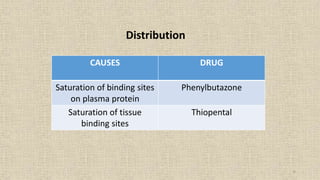
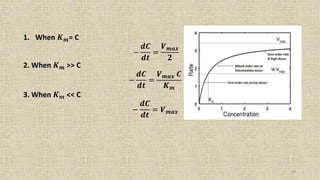
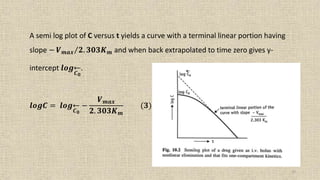
1
NON-LINEAR
PHARMACOKINETICS
PRESENTED BY
SUJITHA MARY
MPHARM
PHARMACEUTICS
ST JOSEPH COLLEGE OFVPHARMACY
2
CONTENTS:-
• Causes of non-linearity
• Michaelis menten equation
• Estimation of 𝑲 𝒎 𝒂𝒏𝒅 𝑽 𝒎𝒂𝒙
• Conclusion
• Reference
3
NON-LINEAR PHARAMACOKINETICS
• It is a Dose Dependent Pharmacokinetics.
• Non-Linear pharmacokinetics models imply that some aspect of the
pharmacokinetic behaviour of the drug is saturable.
4
CAUSES OF NON-LINEARITY:-
• Saturation of enzyme in process of drug ADME
• Pathologic alteration in drug ADME
5
CAUSES DRUG
When absorption involves
carrier mediated transport
systems
Riboflavin, ascorbic acid
When presystemic gut wall or
hepatic metabolism attains
saturation
Propranolol
When absorption is solubility or
dissolution rate limited
Griseofulvin,
GI absorption
6
Distribution
CAUSES DRUG
Saturation of binding sites
on plasma protein
Phenylbutazone
Saturation of tissue
binding sites
Thiopental
7
Drug Metabolism
CAUSES DRUG
Capacity limited
metabolism due to
enzyme and/or cofactor
saturation
Phenytoin, Alcohol,
Theophylline
Enzyme induction Carbamazepine
8
Drug Excretion
CAUSES DRUG
Active tubular secretion Penicillin G
Active tubular
reabsorption
Water-soluble vitamins,
glucose
9
MICHAELIS MENTEN EQUATION
• Non linear pharmacokinetics can be best described by michaelis menten
equation.
−
𝒅𝑪
𝒅𝒕
=
𝑽 𝒎𝒂𝒙 𝑪
𝑲 𝒎 + 𝑪
Where:
o -dC/dt = Rate of decline of drug concentration with time.
o Vmax = Theoretical maximum rate of the process.
o Km = Michaelis-Menten constant.
10
1. When 𝑲 𝒎= C
−
𝒅𝑪
𝒅𝒕
=
𝑽 𝒎𝒂𝒙
𝟐
2. When 𝑲 𝒎 ˃˃ C
−
𝒅𝑪
𝒅𝒕
=
𝑽 𝒎𝒂𝒙 𝑪
𝑲 𝒎
3. When 𝑲 𝒎 ˂˂ C
−
𝒅𝑪
𝒅𝒕
= 𝑽 𝒎𝒂𝒙
11
Estimation of Km and Vmax :-
• The parameters 𝑲 𝒎and 𝑽 𝒎𝒂𝒙 can be assessed from the plasma drug
concentration time data collected after i.v. bolus administration of the drug
with non-linear elimination characteristics.
−
𝒅𝑪
𝒅𝒕
=
𝑽 𝒎𝒂𝒙 𝑪 𝒑
𝑲 𝒎 + 𝑪 𝒑
(𝟏)
• Integration of above equation
𝐥𝐨𝐠 𝑪 = 𝐥𝐨𝐠 𝑪 𝟎 +
(𝑪 𝟎 − 𝑪)
𝟐. 𝟑𝟎𝟑𝑲 𝒎
−
𝑽 𝒎𝒂𝒙
𝟐. 𝟑𝟎𝟑𝑲 𝒎
(𝟐)
12
A semi log plot of C versus t yields a curve with a terminal linear portion having
slope − 𝑽 𝒎𝒂𝒙 𝟐. 𝟑𝟎𝟑𝑲 𝒎 and when back extrapolated to time zero gives y-
intercept 𝒍𝒐𝒈
𝑪 𝟎
.
𝒍𝒐𝒈𝑪 = 𝒍𝒐𝒈
𝑪 𝟎
−
𝑽 𝒎𝒂𝒙
𝟐. 𝟑𝟎𝟑𝑲 𝒎
(𝟑)
13
At low plasma concentrations, equation (2) and (3) are identical. Equating the two
and simplifying further, we get:
(𝑪 𝟎 − 𝑪)
𝟐. 𝟑𝟎𝟑𝑲 𝒎
= 𝒍𝒐𝒈
𝑪 𝟎
𝑪 𝟎
(𝟒)
Km Can thus be obtained from above equation. Vmax Can be computed by
substituting the value of Km in the slope value.
14
𝑲 𝒎 𝒂𝒏𝒅 𝑽 𝒎𝒂𝒙 from steady state concentration:-
When a drug is administered as a constant rate i.v. infusion or in a multiple
dose regimen, the steady-state concentration Cssis given in terms of “dosing
rate” DR as:
𝑫𝑹 = 𝑪 𝑺𝑺 𝑪𝒍 𝑻 (𝟏)
Where DR= R0when the dose is administered as zero order i.v. infusion and
it is equal to FX0/τ when administered as multiple dosage regimen (F is
fraction bioavailable, X0is oral dosage and τ is dosing interval).
15
At steady state, the dosing rate equals rate of decline in plasma drug
concentration and if the decline (elimination) is due to a simple capacity
limited process (for e.g. metabolism), then;
𝑫𝑹 =
𝑽 𝒎𝒂𝒙 𝑪 𝑺𝑺
𝑲 𝒎+𝑪 𝑺
(2)
A plot of CSS versus DR yields a typical hockey-stickshaped curve as
shown in figure:
16
• The rate process of drug’s ADME are depends upon carrier or enzyme that
are substrate specific, have definite capacities and are susceptible to
saturation at a high drug concentration
• Nonlinear kinetics is usually due to saturation occuring in one of the
pharmacokinetic mechanisms: protein binding, hepatic metabolism, or active
renal transport of the drug.
CONCLUSION:-
17
REFERENCE:-
• D M Brahmankar, Sunil B. Jaiswal, Biopharmaceutics and
pharmacokinetics, 3rd edition, Delhi, Vallabh Prakashan,
2015, p. 307-317

non linear pharmacokinetics

  • 1.
  • 2.
    2 CONTENTS:- • Causes ofnon-linearity • Michaelis menten equation • Estimation of 𝑲 𝒎 𝒂𝒏𝒅 𝑽 𝒎𝒂𝒙 • Conclusion • Reference
  • 3.
    3 NON-LINEAR PHARAMACOKINETICS • Itis a Dose Dependent Pharmacokinetics. • Non-Linear pharmacokinetics models imply that some aspect of the pharmacokinetic behaviour of the drug is saturable.
  • 4.
    4 CAUSES OF NON-LINEARITY:- •Saturation of enzyme in process of drug ADME • Pathologic alteration in drug ADME
  • 5.
    5 CAUSES DRUG When absorptioninvolves carrier mediated transport systems Riboflavin, ascorbic acid When presystemic gut wall or hepatic metabolism attains saturation Propranolol When absorption is solubility or dissolution rate limited Griseofulvin, GI absorption
  • 6.
    6 Distribution CAUSES DRUG Saturation ofbinding sites on plasma protein Phenylbutazone Saturation of tissue binding sites Thiopental
  • 7.
    7 Drug Metabolism CAUSES DRUG Capacitylimited metabolism due to enzyme and/or cofactor saturation Phenytoin, Alcohol, Theophylline Enzyme induction Carbamazepine
  • 8.
    8 Drug Excretion CAUSES DRUG Activetubular secretion Penicillin G Active tubular reabsorption Water-soluble vitamins, glucose
  • 9.
    9 MICHAELIS MENTEN EQUATION •Non linear pharmacokinetics can be best described by michaelis menten equation. − 𝒅𝑪 𝒅𝒕 = 𝑽 𝒎𝒂𝒙 𝑪 𝑲 𝒎 + 𝑪 Where: o -dC/dt = Rate of decline of drug concentration with time. o Vmax = Theoretical maximum rate of the process. o Km = Michaelis-Menten constant.
  • 10.
    10 1. When 𝑲𝒎= C − 𝒅𝑪 𝒅𝒕 = 𝑽 𝒎𝒂𝒙 𝟐 2. When 𝑲 𝒎 ˃˃ C − 𝒅𝑪 𝒅𝒕 = 𝑽 𝒎𝒂𝒙 𝑪 𝑲 𝒎 3. When 𝑲 𝒎 ˂˂ C − 𝒅𝑪 𝒅𝒕 = 𝑽 𝒎𝒂𝒙
  • 11.
    11 Estimation of Kmand Vmax :- • The parameters 𝑲 𝒎and 𝑽 𝒎𝒂𝒙 can be assessed from the plasma drug concentration time data collected after i.v. bolus administration of the drug with non-linear elimination characteristics. − 𝒅𝑪 𝒅𝒕 = 𝑽 𝒎𝒂𝒙 𝑪 𝒑 𝑲 𝒎 + 𝑪 𝒑 (𝟏) • Integration of above equation 𝐥𝐨𝐠 𝑪 = 𝐥𝐨𝐠 𝑪 𝟎 + (𝑪 𝟎 − 𝑪) 𝟐. 𝟑𝟎𝟑𝑲 𝒎 − 𝑽 𝒎𝒂𝒙 𝟐. 𝟑𝟎𝟑𝑲 𝒎 (𝟐)
  • 12.
    12 A semi logplot of C versus t yields a curve with a terminal linear portion having slope − 𝑽 𝒎𝒂𝒙 𝟐. 𝟑𝟎𝟑𝑲 𝒎 and when back extrapolated to time zero gives y- intercept 𝒍𝒐𝒈 𝑪 𝟎 . 𝒍𝒐𝒈𝑪 = 𝒍𝒐𝒈 𝑪 𝟎 − 𝑽 𝒎𝒂𝒙 𝟐. 𝟑𝟎𝟑𝑲 𝒎 (𝟑)
  • 13.
    13 At low plasmaconcentrations, equation (2) and (3) are identical. Equating the two and simplifying further, we get: (𝑪 𝟎 − 𝑪) 𝟐. 𝟑𝟎𝟑𝑲 𝒎 = 𝒍𝒐𝒈 𝑪 𝟎 𝑪 𝟎 (𝟒) Km Can thus be obtained from above equation. Vmax Can be computed by substituting the value of Km in the slope value.
  • 14.
    14 𝑲 𝒎 𝒂𝒏𝒅𝑽 𝒎𝒂𝒙 from steady state concentration:- When a drug is administered as a constant rate i.v. infusion or in a multiple dose regimen, the steady-state concentration Cssis given in terms of “dosing rate” DR as: 𝑫𝑹 = 𝑪 𝑺𝑺 𝑪𝒍 𝑻 (𝟏) Where DR= R0when the dose is administered as zero order i.v. infusion and it is equal to FX0/τ when administered as multiple dosage regimen (F is fraction bioavailable, X0is oral dosage and τ is dosing interval).
  • 15.
    15 At steady state,the dosing rate equals rate of decline in plasma drug concentration and if the decline (elimination) is due to a simple capacity limited process (for e.g. metabolism), then; 𝑫𝑹 = 𝑽 𝒎𝒂𝒙 𝑪 𝑺𝑺 𝑲 𝒎+𝑪 𝑺 (2) A plot of CSS versus DR yields a typical hockey-stickshaped curve as shown in figure:
  • 16.
    16 • The rateprocess of drug’s ADME are depends upon carrier or enzyme that are substrate specific, have definite capacities and are susceptible to saturation at a high drug concentration • Nonlinear kinetics is usually due to saturation occuring in one of the pharmacokinetic mechanisms: protein binding, hepatic metabolism, or active renal transport of the drug. CONCLUSION:-
  • 17.
    17 REFERENCE:- • D MBrahmankar, Sunil B. Jaiswal, Biopharmaceutics and pharmacokinetics, 3rd edition, Delhi, Vallabh Prakashan, 2015, p. 307-317