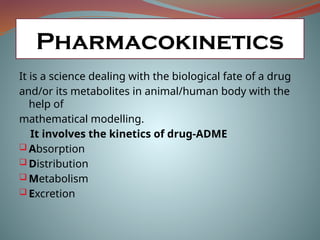
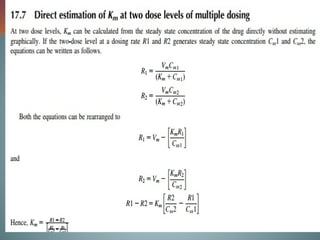
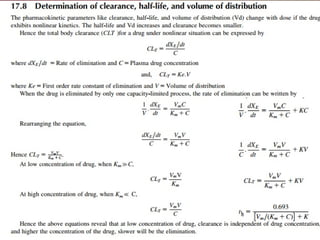
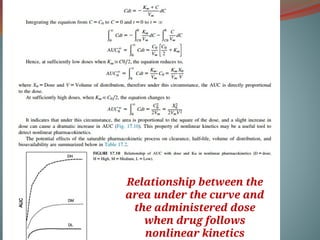
Pharmacokinetics
It is ascience dealing with the biological fate of a drug
and/or its metabolites in animal/human body with the
help of
mathematical modelling.
It involves the kinetics of drug-ADME
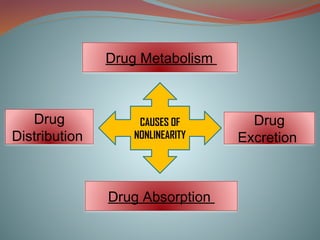
Absorption
Distribution
Metabolism
Excretion
3.
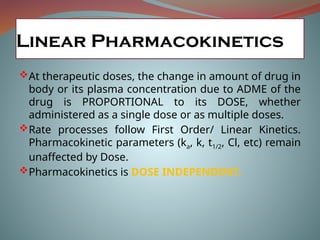
Linear Pharmacokinetics
At therapeuticdoses, the change in amount of drug in
body or its plasma concentration due to ADME of the
drug is PROPORTIONAL to its DOSE, whether
administered as a single dose or as multiple doses.
Rate processes follow First Order/ Linear Kinetics.
Pharmacokinetic parameters (ka, k, t1/2, Cl, etc) remain
unaffected by Dose.
Pharmacokinetics is DOSE INDEPENDENT.
4.
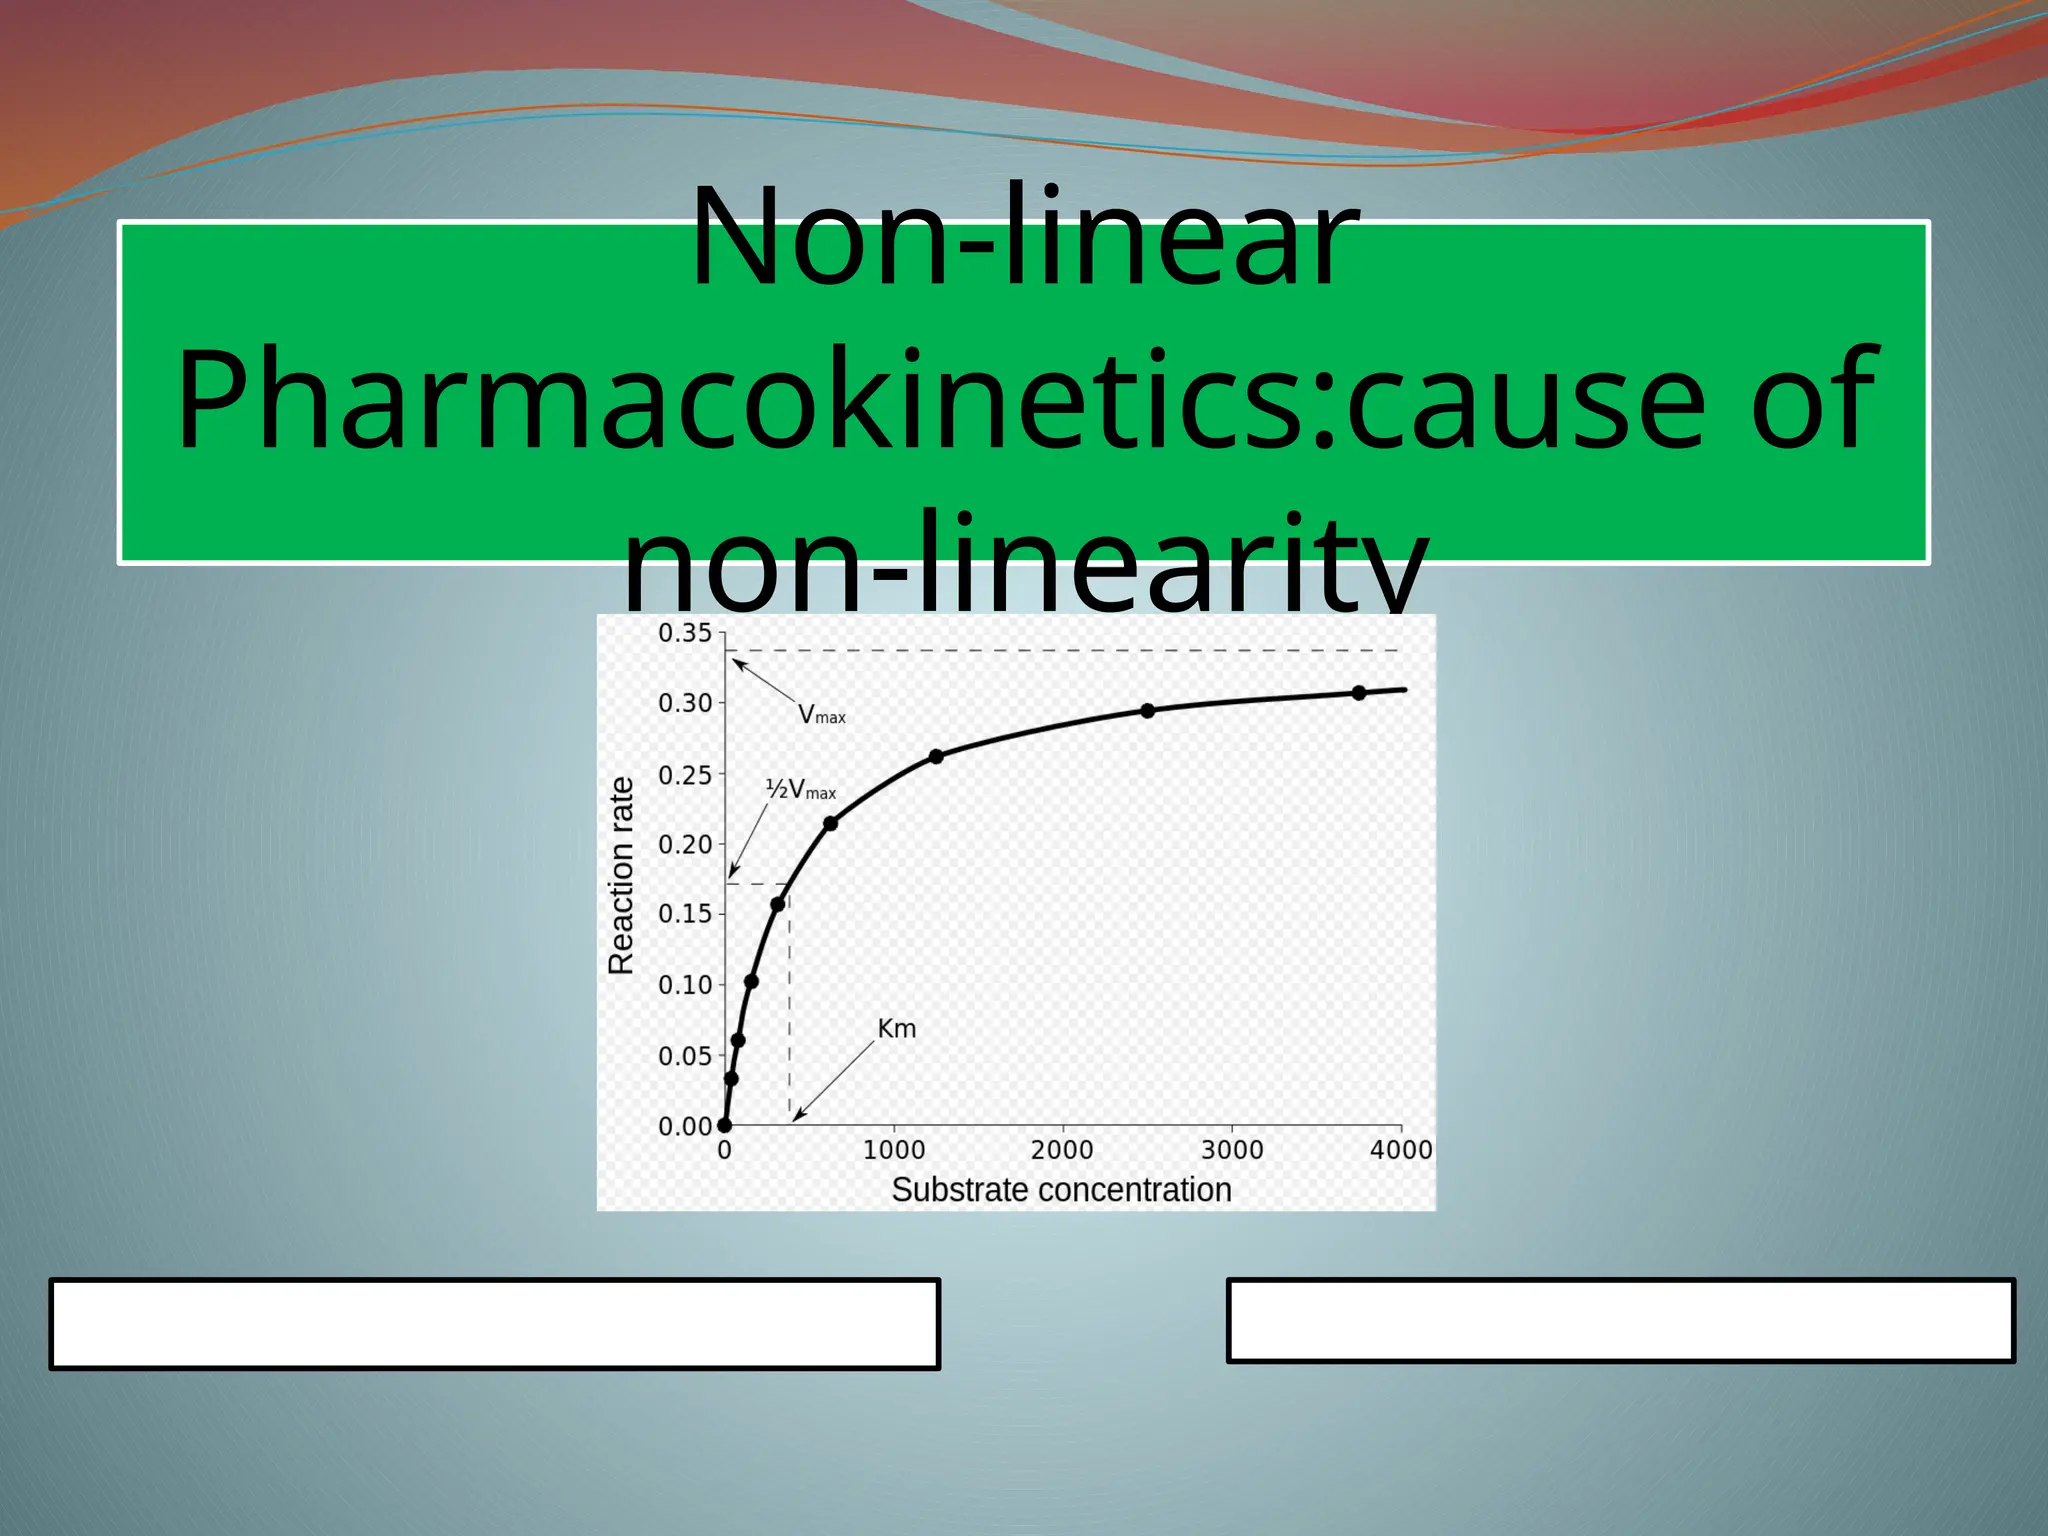
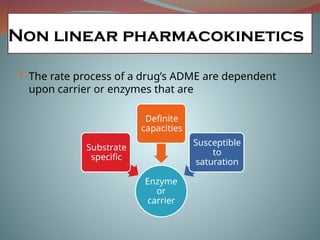
Non linear pharmacokinetics
The rate process of a drug’s ADME are dependent
upon carrier or enzymes that are
Enzyme
or
carrier
Substrate
specific
Definite
capacities
Susceptible
to
saturation
5.
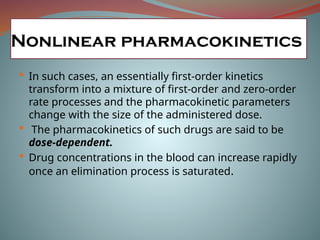
In suchcases, an essentially first-order kinetics
transform into a mixture of first-order and zero-order
rate processes and the pharmacokinetic parameters
change with the size of the administered dose.
The pharmacokinetics of such drugs are said to be
dose-dependent.
Drug concentrations in the blood can increase rapidly
once an elimination process is saturated.
Nonlinear pharmacokinetics
6.
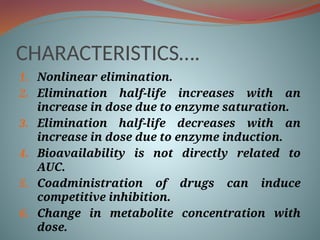
CHARACTERISTICS….
1. Nonlinear elimination.
2.Elimination half-life increases with an
increase in dose due to enzyme saturation.
3. Elimination half-life decreases with an
increase in dose due to enzyme induction.
4. Bioavailability is not directly related to
AUC.
5. Coadministration of drugs can induce
competitive inhibition.
6. Change in metabolite concentration with
dose.
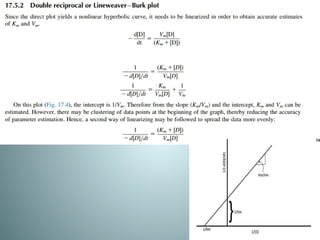
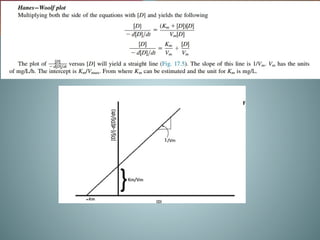
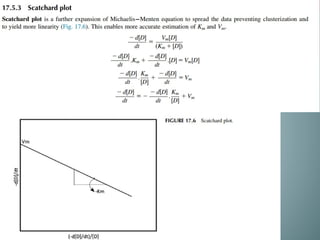
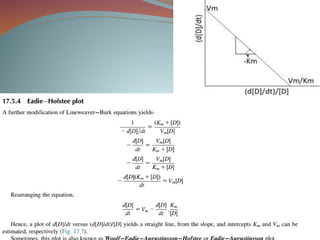
7.
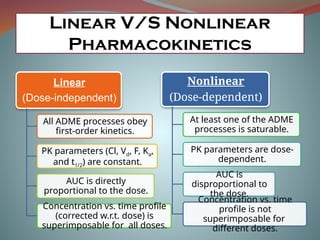
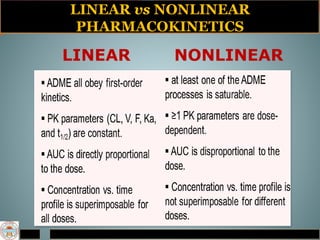
Linear V/S Nonlinear
Pharmacokinetics
Linear
(Dose-independent)
AllADME processes obey
first-order kinetics.
PK parameters (Cl, Vd, F, Ka,
and t1/2) are constant.
AUC is directly
proportional to the dose.
Concentration vs. time profile
(corrected w.r.t. dose) is
superimposable for all doses.
Nonlinear
(Dose-dependent)
At least one of the ADME
processes is saturable.
PK parameters are dose-
dependent.
AUC is
disproportional to
the dose.
Concentration vs. time
profile is not
superimposable for
different doses.
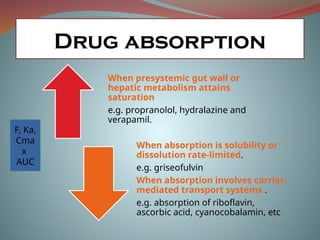
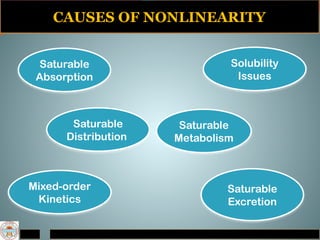
When presystemic gutwall or
hepatic metabolism attains
saturation
e.g. propranolol, hydralazine and
verapamil.
When absorption is solubility or
dissolution rate-limited.
e.g. griseofulvin
When absorption involves carrier-
mediated transport systems .
e.g. absorption of riboflavin,
ascorbic acid, cyanocobalamin, etc
F, Ka,
Cma
x
AUC
Drug absorption
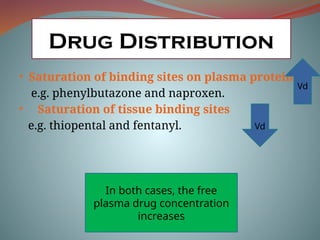
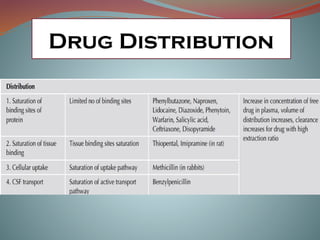
Drug Distribution
• Saturationof binding sites on plasma proteins
e.g. phenylbutazone and naproxen.
• Saturation of tissue binding sites
e.g. thiopental and fentanyl.
Vd
Vd
In both cases, the free
plasma drug concentration
increases
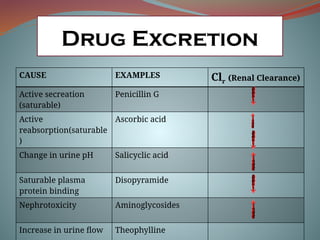
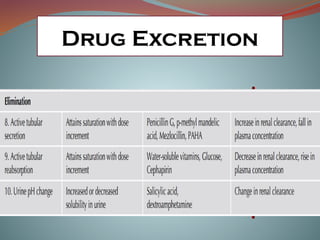
Drug Excretion
CAUSE EXAMPLESClr (Renal Clearance)
Active secreation
(saturable)
Penicillin G
Active
reabsorption(saturable
)
Ascorbic acid
Change in urine pH Salicyclic acid
Saturable plasma
protein binding
Disopyramide
Nephrotoxicity Aminoglycosides
Increase in urine flow Theophylline
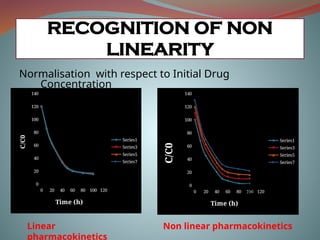
RECOGNITION OF NON
LINEARITY
Normalisationwith respect to Initial Drug
Concentration
0 20 40 60 80 100 120
0
20
40
60
80
100
120
140
Series1
Series3
Series5
Series7
Time (h)
C/C0
0 20 40 60 80 100 120
0
20
40
60
80
100
120
140
Series1
Series3
Series5
Series7
Time (h)
C/C0
500mg
100m
g
325m
g
250m
g
Linear
pharmacokinetics
Non linear pharmacokinetics
18.
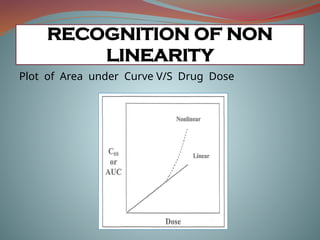
Plot of Areaunder Curve V/S Drug Dose
RECOGNITION OF NON
LINEARITY
19.
When concentration thatresults from the dose is not
proportional to that dose and/or the rate of elimination
of the
drug is not proportional to the concentration, the drug
is said
to exhibit non-linear kinetics
RECOGNITION OF NON
LINEARITY
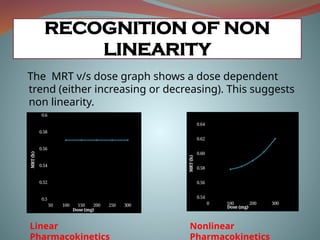
20.
The MRT v/sdose graph shows a dose dependent
trend (either increasing or decreasing). This suggests
non linearity.
RECOGNITION OF NON
LINEARITY
0 100 200 300
0.54
0.56
0.58
0.60
0.62
0.64
Dose (mg)
MRT
(h)
50 100 150 200 250 300
0.5
0.52
0.54
0.56
0.58
0.6
Dose (mg)
MRT
(h)
Linear
Pharmacokinetics
Nonlinear
Pharmacokinetics
21.
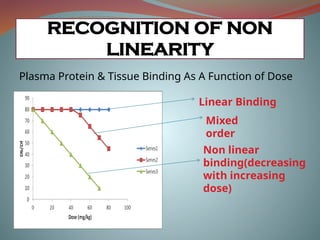
Plasma Protein &Tissue Binding As A Function of Dose
RECOGNITION OF NON
LINEARITY
Linear Binding
Mixed
order
Non linear
binding(decreasing
with increasing
dose)
22.
If the magnitudeof some or all of the parameters
change
with dose (and especially there are dose related trends)
then non-linear pharmacokinetic are highly probable
RECOGNITION OF NON
LINEARITY
23.
Effect of nonlinearityon AUC
Introduction of nonlinear pharmacokinetics
Linear vs nonlinear pharmacokinetics
Causes of nonlinearity
Tests for determining nonlinearity
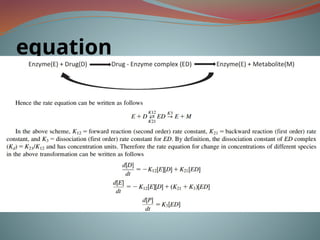
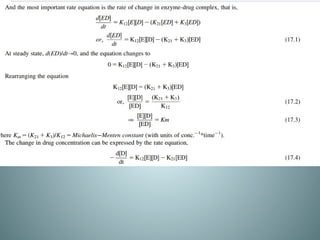
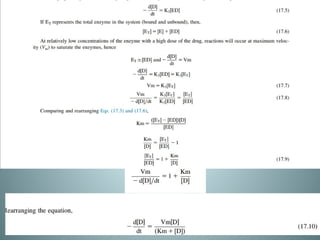
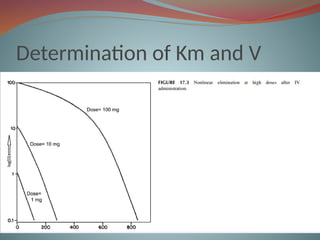
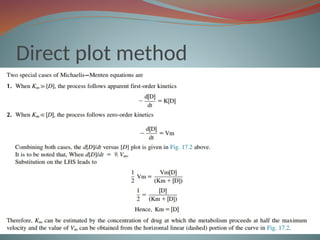
Michaelis-menten equation
Determination of Km & Vm
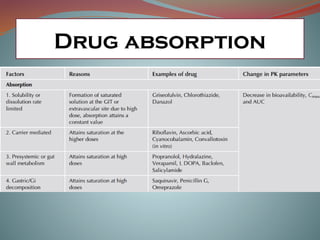
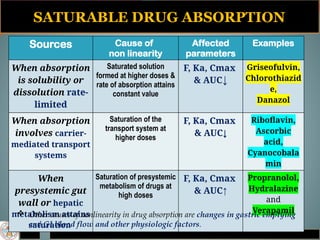
SATURABLE DRUG ABSORPTION
SourcesCause of
non linearity
Affected
parameters
Examples
When absorption
is solubility or
dissolution rate-
limited
Saturated solution
formed at higher doses &
rate of absorption attains
constant value
F, Ka, Cmax
& AUC↓
Griseofulvin,
Chlorothiazid
e,
Danazol
When absorption
involves carrier-
mediated transport
systems
Saturation of the
transport system at
higher doses
F, Ka, Cmax
& AUC↓
Riboflavin,
Ascorbic
acid,
Cyanocobala
min
When
presystemic gut
wall or hepatic
metabolism attains
saturation
Saturation of presystemic
metabolism of drugs at
high doses
F, Ka, Cmax
& AUC↑
Propranolol,
Hydralazine
and
Verapamil
Other causes of nonlinearity in drug absorption are changes in gastric emptying
and GI blood flow and other physiologic factors.
30.
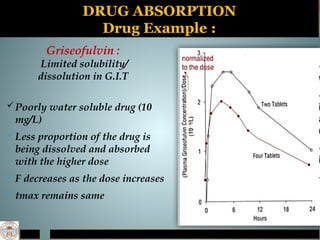
DRUG ABSORPTION
Drug Example:
Griseofulvin :
Limited solubility/
dissolution in G.I.T
Poorly water soluble drug (10
mg/L)
Less proportion of the drug is
being dissolved and absorbed
with the higher dose
F decreases as the dose increases
tmax remains same
31.
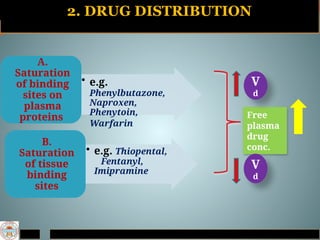
2. DRUG DISTRIBUTION
•e.g.
Phenylbutazone,
Naproxen,
Phenytoin,
Warfarin
A.
Saturation
of binding
sites on
plasma
proteins
• e.g. Thiopental,
Fentanyl,
Imipramine
B.
Saturation
of tissue
binding
sites
Free
plasma
drug
conc.
V
d
V
d
32.
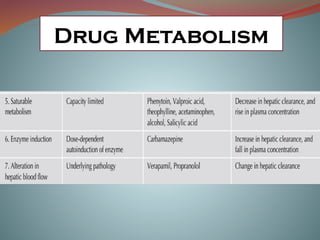
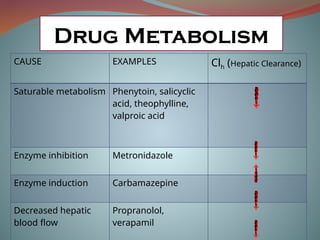
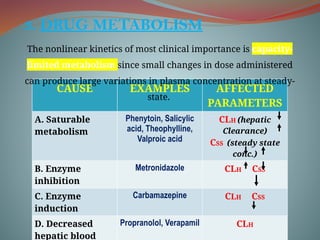
3. DRUG METABOLISM
CAUSEEXAMPLES AFFECTED
PARAMETERS
A. Saturable
metabolism
Phenytoin, Salicylic
acid, Theophylline,
Valproic acid
CLH (hepatic
Clearance)
CSS (steady state
conc.)
B. Enzyme
inhibition
Metronidazole CLH CSS
C. Enzyme
induction
Carbamazepine CLH CSS
D. Decreased
hepatic blood
Propranolol, Verapamil CLH
The nonlinear kinetics of most clinical importance is capacity-
limited metabolism since small changes in dose administered
can produce large variations in plasma concentration at steady-
state.
33.
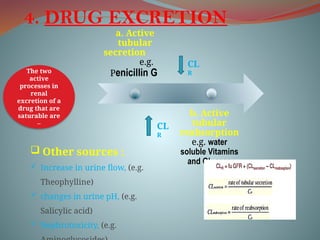
4. DRUG EXCRETION
a.Active
tubular
secretion
e.g.
Penicillin G
b. Active
tubular
reabsorption
e.g. water
soluble Vitamins
and Glucose
The two
active
processes in
renal
excretion of a
drug that are
saturable are
–
CL
R
CL
R
Other sources :
Increase in urine flow, (e.g.
Theophylline)
changes in urine pH, (e.g.
Salicylic acid)
Nephrotoxicity, (e.g.
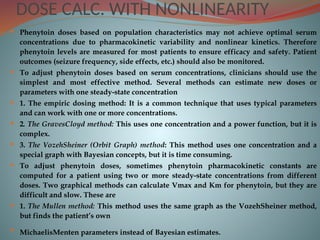
DOSE CALC. WITHNONLINEARITY
Phenytoin doses based on population characteristics may not achieve optimal serum
concentrations due to pharmacokinetic variability and nonlinear kinetics. Therefore
phenytoin levels are measured for most patients to ensure efficacy and safety. Patient
outcomes (seizure frequency, side effects, etc.) should also be monitored.
To adjust phenytoin doses based on serum concentrations, clinicians should use the
simplest and most effective method. Several methods can estimate new doses or
parameters with one steady-state concentration
1. The empiric dosing method: It is a common technique that uses typical parameters
and can work with one or more concentrations.
2. The GravesCloyd method: This uses one concentration and a power function, but it is
complex.
3. The VozehSheiner (Orbit Graph) method: This method uses one concentration and a
special graph with Bayesian concepts, but it is time consuming.
To adjust phenytoin doses, sometimes phenytoin pharmacokinetic constants are
computed for a patient using two or more steady-state concentrations from different
doses. Two graphical methods can calculate Vmax and Km for phenytoin, but they are
difficult and slow. These are
1. The Mullen method: This method uses the same graph as the VozehSheiner method,
but finds the patient’s own
MichaelisMenten parameters instead of Bayesian estimates.
49.
Conclusion
Nonlinear pharmacokineticsis a complex but important topic in pharmacology and
pharmacokinetics, as it affects the relationship between the dose, concentration,
and effect of many drugs. In this chapter, we have covered the following aspects of
nonlinear pharmacokinetics:
● The general concepts and characteristics of nonlinear pharmacokinetics, such as
the deviation from the first-order
kinetics, the dose-dependent changes in pharmacokinetic parameters, and the
increased variability and unpredictability of drug response.
● The factors that can cause nonlinearity in drug absorption, distribution,
metabolism, or excretion, such as saturable
enzyme kinetics, capacity-limited protein binding, autoinduction or inhibition of
drug metabolism, and nonlinear
absorption or elimination processes.
● The MichaelisMenten equation and its derivation from the enzyme kinetics
theory, and the methods to determine the K m and Vmax values for a drug that
follows the MichaelisMenten kinetics, such as graphical methods, empirical
methods.


![Nonlinear pharmacokinetics.pptx1[1]](https://cdn.slidesharecdn.com/ss_thumbnails/nonlinearpharmacokinetics-201215071246-thumbnail.jpg?width=640&height=640&fit=bounds)