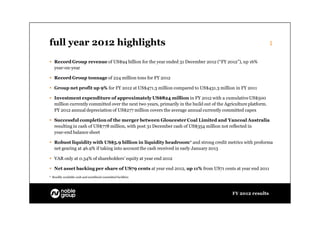
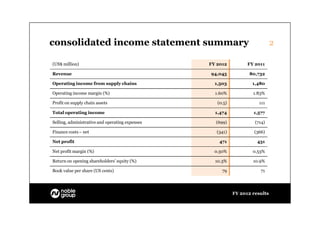
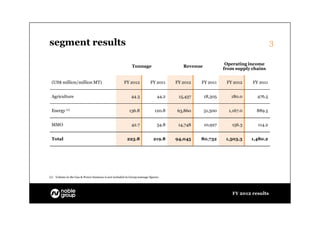
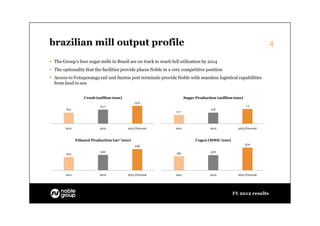
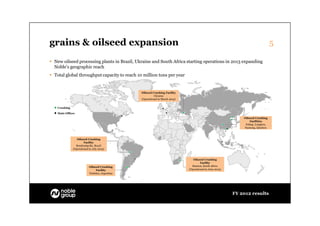
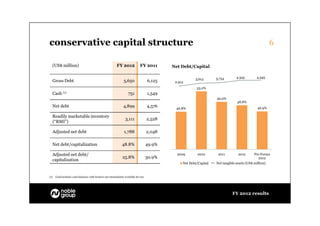
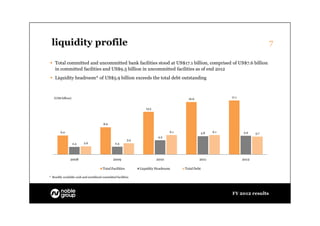
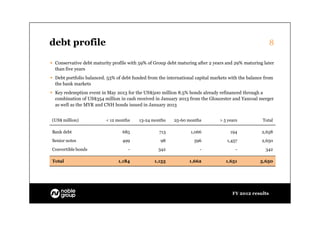
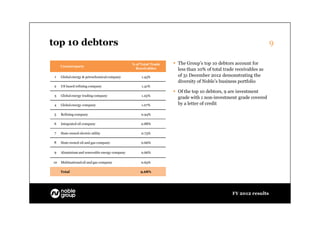
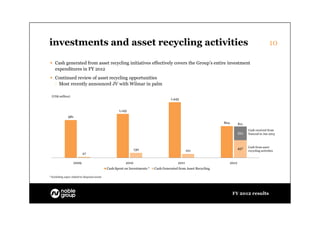
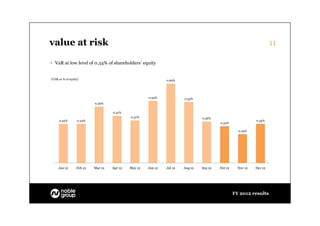
anticipating the needs of
           tomorrow with a clear
           focus on where the
           business is today.


tomorrow
today


                    FY 2012 results
                    FY 2012 results
full year 2012 highlights                                                                                        1

 Record Group revenue of US$94 billion for the year ended 31 December 2012 (“FY 2012”), up 16%
  year-on-year

 Record Group tonnage of 224 million tons for FY 2012

 Group net profit up 9% for FY 2012 at US$471.3 million compared to US$431.3 million in FY 2011

 Investment expenditure of approximately US$824 million in FY 2012 with a cumulative US$500
  million currently committed over the next two years, primarily in the build out of the Agriculture platform.
  FY 2012 annual depreciation of US$277 million covers the average annual currently committed capex

 Successful completion of the merger between Gloucester Coal Limited and Yancoal Australia
  resulting in cash of US$778 million, with post 31 December cash of US$354 million not reflected in
  year-end balance sheet

 Robust liquidity with US$5.9 billion in liquidity headroom* and strong credit metrics with proforma
  net gearing at 46.9% if taking into account the cash received in early January 2013

 VAR only at 0.34% of shareholders’ equity at year end 2012

 Net asset backing per share of US79 cents at year end 2012, up 11% from US71 cents at year end 2011
* Readily available cash and unutilized committed facilities


                                                                                            FY 2012 results
consolidated income statement summary                                         2

(US$ million)                                    FY 2012          FY 2011

Revenue                                          94,045            80,732

Operating income from supply chains                1,503            1,480

Operating income margin (%)                        1.60%            1.83%

Profit on supply chain assets                       (0.5)              111

Total operating income                             1,474            1,577

Selling, administrative and operating expenses     (699)             (714)

Finance costs – net                                 (341)            (366)

Net profit                                           471              431

Net profit margin (%)                              0.50%            0.53%

Return on opening shareholders’ equity (%)         10.3%            10.9%

Book value per share (US cents)                       79                71


                                                            FY 2012 results
segment results                                                                                                                 3

                                                                                                           Operating income
                                                           Tonnage                     Revenue
                                                                                                          from supply chains


 (US$ million/million MT)                             FY 2012            FY 2011    FY 2012   FY 2011      FY 2012    FY 2011


 Agriculture                                               44.3              44.2    15,437      18,305      180.0      476.5


 Energy (1)                                              136.8              120.8   63,860       51,500     1,167.0     889.5


 MMO                                                       42.7              54.8    14,748      10,927      156.3      114.2


 Total                                                  223.8              219.8    94,045    80,732       1,503.3    1,480.2


(1) Volume in the Gas & Power business is not included in Group tonnage figures


                                                                                                             FY 2012 results
brazilian mill output profile                                                                                       4

 The Group’s four sugar mills in Brazil are on track to reach full utilization by 2014
 The optionality that the facilities provide places Noble in a very competitive position
 Access to Votuporanga rail and Santos port terminals provide Noble with seamless logistical capabilities
  from land to sea


                   Crush (million tons)                                 Sugar Production (million tons)
                                              13.6
                           10.7                                                                           1.1
        8.5                                                                           0.8
                                                                  0.7


        2011               2012           2013 Forecast          2011                2012           2013 Forecast


               Ethanol Production (m3 ’000)                                   Cogen (MWh ’000)
                                              445                                                         570

                           322                                   351                  378
        274


        2011               2012           2013 Forecast          2011                2012           2013 Forecast


                                                                                                 FY 2012 results
grains & oilseed expansion                                                                                                          5

 New oilseed processing plants in Brazil, Ukraine and South Africa starting operations in 2013 expanding
  Noble’s geographic reach
 Total global throughput capacity to reach 10 million tons per year


                                                 Oilseed Crushing Facility
                                                          Ukraine
                                                 (Operational in March 2013)


    Crushing

    Main Offices
                                                                                                                Oilseed Crushing
                                                                                                                    Facilities
                                                                                                                 Fuling. Longkou,
                                                                                                                Nantong, Qinzhou


                  Oilseed Crushing
                       Facility
                 Rondonópolis, Brazil
               (Operational in July 2013)


                                                                                  Oilseed Crushing
                                                                                        Facility
                            Oilseed Crushing                                     Stanton, South Africa
                                 Facility                                      (Operational in June 2013)
                            Timbúes, Argentina


                                                                                                            FY 2012 results
conservative capital structure                                                                                                                      6

  (US$ million)                                          FY 2012            FY 2011        Net Debt/Capital

                                                                                                                   3,754       4,345        4,345
                                                                                                       3,613
  Gross Debt                                                   5,650               6,125    2,914
                                                                                                        53.2%
  Cash      (1)                                                   751              1,549
                                                                                                                   49.9%
                                                                                                                                48.8%
  Net debt                                                    4,899                4,576    46.8%                                           46.9%

  Readily marketable inventory
                                                                3,111              2,528
  (“RMI”)

  Adjusted net debt                                            1,788               2,048

  Net debt/capitalization                                    48.8%                 49.9%

  Adjusted net debt/                                                                         2009        2010       2011        2012        Pro Forma
                                                              25.8%                30.9%                                                       2012
  capitalization
                                                                                                Net Debt/Capital   Net tangible assets (US$ million)


(1)   Cash includes cash balances with brokers not immediately available for use


                                                                                                                             FY 2012 results
liquidity profile                                                                                                                   7

 Total committed and uncommitted bank facilities stood at US$17.1 billion, comprised of US$7.6 billion
  in committed facilities and US$9.5 billion in uncommitted facilities as of end 2012
 Liquidity headroom* of US$5.9 billion exceeds the total debt outstanding


   (US$ billion)                                                                                                 17.1
                                                                                          16.6


                                                                    13.5


                                        8.6

        6.0                                                                       6.1                5.8   6.1          5.9    5.7
                                                                           4.5
                                                           3.5
                   2.4    2.6                    2.4


               2008                             2009                       2010                  2011                   2012

                                        Total Facilities         Liquidity Headroom     Total Debt

* Readily available cash and unutilized committed facilities


                                                                                                                 FY 2012 results
debt profile                                                                                            8

 Conservative debt maturity profile with 59% of Group debt maturing after 2 years and 29% maturing later
  than five years
 Debt portfolio balanced. 53% of debt funded from the international capital markets with the balance from
  the bank markets
 Key redemption event in May 2013 for the US$500 million 8.5% bonds already refinanced through a
  combination of US$354 million in cash received in January 2013 from the Gloucester and Yancoal merger
  as well as the MYR and CNH bonds issued in January 2013


(US$ million)             < 12 months     13-24 months    25-60 months          > 5 years            Total

Bank debt                         685              713            1,066              194            2,658
Senior notes                      499               98              596             1,457           2,650
Convertible bonds                    -             342                 -                -             342

Total                           1,184            1,153            1,662            1,651           5,650


                                                                                      FY 2012 results
top 10 debtors                                                                                                   9

                                              % of Total Trade    The Group’s top 10 debtors account for
     Counterparty
                                                Receivables        less than 10% of total trade receivables as
 1   Global energy & petrochemical company         1.43%           of 31 December 2012 demonstrating the
                                                                   diversity of Noble’s business portfolio
 2   US based refining company                     1.41%
                                                                  Of the top 10 debtors, 9 are investment
 3   Global energy trading company                 1.25%
                                                                   grade with 1 non-investment grade covered
 4   Global energy company                         1.07%           by a letter of credit

 5   Refining company                              0.94%

 6   Integrated oil company                        0.88%

 7   State owned electric utility                  0.73%

8    State owned oil and gas company               0.66%

 9   Aluminium and renewable energy company        0.66%

10   Multinational oil and gas company             0.65%

     Total                                        9.68%


                                                                                              FY 2012 results
investments and asset recycling activities                                                                                                             10

 Cash generated from asset recycling initiatives effectively covers the Group’s entire investment
  expenditures in FY 2012
 Continued review of asset recycling opportunities
  - Most recently announced JV with Wilmar in palm

  (US$ million)
                                                                                       1,445


                                                      1,143
               981
                                                                                                                   824          811
                                                                                                                                      Cash received from
                                                                                                                                354   Yancoal in Jan 2013


                                                                                                                                457   Cash from asset
                                                                 130                              101                                 recycling activities
                           27

                    2009                                  2010                             2011                          2012
                                               Cash Spent on Investments *   Cash Generated from Asset Recycling

* Excluding capex related to disposed assets


                                                                                                                          FY 2012 results
value at risk                                                                                                          11

 VaR at low level of 0.34% of shareholders’ equity


(VAR as % of equity)                                           0.69%


                                                      0.54%             0.53%
                           0.49%


                                    0.41%
                                             0.37%                               0.36%
     0.34%        0.34%                                                                                       0.34%
                                                                                          0.32%

                                                                                                     0.25%


     Jan 12       Feb 12   Mar 12   Apr 12   May 12   Jun 12   Jul 12   Aug 12   Sep 12   Oct 12     Nov 12   Dec 12


                                                                                                   FY 2012 results
thank you!


             FY 2012 results

Noble Group Q4 2012 results presentation

  • 1.
    anticipating the needsof tomorrow with a clear focus on where the business is today. tomorrow today FY 2012 results FY 2012 results
  • 2.
    full year 2012highlights 1  Record Group revenue of US$94 billion for the year ended 31 December 2012 (“FY 2012”), up 16% year-on-year  Record Group tonnage of 224 million tons for FY 2012  Group net profit up 9% for FY 2012 at US$471.3 million compared to US$431.3 million in FY 2011  Investment expenditure of approximately US$824 million in FY 2012 with a cumulative US$500 million currently committed over the next two years, primarily in the build out of the Agriculture platform. FY 2012 annual depreciation of US$277 million covers the average annual currently committed capex  Successful completion of the merger between Gloucester Coal Limited and Yancoal Australia resulting in cash of US$778 million, with post 31 December cash of US$354 million not reflected in year-end balance sheet  Robust liquidity with US$5.9 billion in liquidity headroom* and strong credit metrics with proforma net gearing at 46.9% if taking into account the cash received in early January 2013  VAR only at 0.34% of shareholders’ equity at year end 2012  Net asset backing per share of US79 cents at year end 2012, up 11% from US71 cents at year end 2011 * Readily available cash and unutilized committed facilities FY 2012 results
  • 3.
    consolidated income statementsummary 2 (US$ million) FY 2012 FY 2011 Revenue 94,045 80,732 Operating income from supply chains 1,503 1,480 Operating income margin (%) 1.60% 1.83% Profit on supply chain assets (0.5) 111 Total operating income 1,474 1,577 Selling, administrative and operating expenses (699) (714) Finance costs – net (341) (366) Net profit 471 431 Net profit margin (%) 0.50% 0.53% Return on opening shareholders’ equity (%) 10.3% 10.9% Book value per share (US cents) 79 71 FY 2012 results
  • 4.
    segment results 3 Operating income Tonnage Revenue from supply chains (US$ million/million MT) FY 2012 FY 2011 FY 2012 FY 2011 FY 2012 FY 2011 Agriculture 44.3 44.2 15,437 18,305 180.0 476.5 Energy (1) 136.8 120.8 63,860 51,500 1,167.0 889.5 MMO 42.7 54.8 14,748 10,927 156.3 114.2 Total 223.8 219.8 94,045 80,732 1,503.3 1,480.2 (1) Volume in the Gas & Power business is not included in Group tonnage figures FY 2012 results
  • 5.
    brazilian mill outputprofile 4  The Group’s four sugar mills in Brazil are on track to reach full utilization by 2014  The optionality that the facilities provide places Noble in a very competitive position  Access to Votuporanga rail and Santos port terminals provide Noble with seamless logistical capabilities from land to sea Crush (million tons) Sugar Production (million tons) 13.6 10.7 1.1 8.5 0.8 0.7 2011 2012 2013 Forecast 2011 2012 2013 Forecast Ethanol Production (m3 ’000) Cogen (MWh ’000) 445 570 322 351 378 274 2011 2012 2013 Forecast 2011 2012 2013 Forecast FY 2012 results
  • 6.
    grains & oilseedexpansion 5  New oilseed processing plants in Brazil, Ukraine and South Africa starting operations in 2013 expanding Noble’s geographic reach  Total global throughput capacity to reach 10 million tons per year Oilseed Crushing Facility Ukraine (Operational in March 2013) Crushing Main Offices Oilseed Crushing Facilities Fuling. Longkou, Nantong, Qinzhou Oilseed Crushing Facility Rondonópolis, Brazil (Operational in July 2013) Oilseed Crushing Facility Oilseed Crushing Stanton, South Africa Facility (Operational in June 2013) Timbúes, Argentina FY 2012 results
  • 7.
    conservative capital structure 6 (US$ million) FY 2012 FY 2011 Net Debt/Capital 3,754 4,345 4,345 3,613 Gross Debt 5,650 6,125 2,914 53.2% Cash (1) 751 1,549 49.9% 48.8% Net debt 4,899 4,576 46.8% 46.9% Readily marketable inventory 3,111 2,528 (“RMI”) Adjusted net debt 1,788 2,048 Net debt/capitalization 48.8% 49.9% Adjusted net debt/ 2009 2010 2011 2012 Pro Forma 25.8% 30.9% 2012 capitalization Net Debt/Capital Net tangible assets (US$ million) (1) Cash includes cash balances with brokers not immediately available for use FY 2012 results
  • 8.
    liquidity profile 7  Total committed and uncommitted bank facilities stood at US$17.1 billion, comprised of US$7.6 billion in committed facilities and US$9.5 billion in uncommitted facilities as of end 2012  Liquidity headroom* of US$5.9 billion exceeds the total debt outstanding (US$ billion) 17.1 16.6 13.5 8.6 6.0 6.1 5.8 6.1 5.9 5.7 4.5 3.5 2.4 2.6 2.4 2008 2009 2010 2011 2012 Total Facilities Liquidity Headroom Total Debt * Readily available cash and unutilized committed facilities FY 2012 results
  • 9.
    debt profile 8  Conservative debt maturity profile with 59% of Group debt maturing after 2 years and 29% maturing later than five years  Debt portfolio balanced. 53% of debt funded from the international capital markets with the balance from the bank markets  Key redemption event in May 2013 for the US$500 million 8.5% bonds already refinanced through a combination of US$354 million in cash received in January 2013 from the Gloucester and Yancoal merger as well as the MYR and CNH bonds issued in January 2013 (US$ million) < 12 months 13-24 months 25-60 months > 5 years Total Bank debt 685 713 1,066 194 2,658 Senior notes 499 98 596 1,457 2,650 Convertible bonds - 342 - - 342 Total 1,184 1,153 1,662 1,651 5,650 FY 2012 results
  • 10.
    top 10 debtors 9 % of Total Trade  The Group’s top 10 debtors account for Counterparty Receivables less than 10% of total trade receivables as 1 Global energy & petrochemical company 1.43% of 31 December 2012 demonstrating the diversity of Noble’s business portfolio 2 US based refining company 1.41%  Of the top 10 debtors, 9 are investment 3 Global energy trading company 1.25% grade with 1 non-investment grade covered 4 Global energy company 1.07% by a letter of credit 5 Refining company 0.94% 6 Integrated oil company 0.88% 7 State owned electric utility 0.73% 8 State owned oil and gas company 0.66% 9 Aluminium and renewable energy company 0.66% 10 Multinational oil and gas company 0.65% Total 9.68% FY 2012 results
  • 11.
    investments and assetrecycling activities 10  Cash generated from asset recycling initiatives effectively covers the Group’s entire investment expenditures in FY 2012  Continued review of asset recycling opportunities - Most recently announced JV with Wilmar in palm (US$ million) 1,445 1,143 981 824 811 Cash received from 354 Yancoal in Jan 2013 457 Cash from asset 130 101 recycling activities 27 2009 2010 2011 2012 Cash Spent on Investments * Cash Generated from Asset Recycling * Excluding capex related to disposed assets FY 2012 results
  • 12.
    value at risk 11  VaR at low level of 0.34% of shareholders’ equity (VAR as % of equity) 0.69% 0.54% 0.53% 0.49% 0.41% 0.37% 0.36% 0.34% 0.34% 0.34% 0.32% 0.25% Jan 12 Feb 12 Mar 12 Apr 12 May 12 Jun 12 Jul 12 Aug 12 Sep 12 Oct 12 Nov 12 Dec 12 FY 2012 results
  • 13.
    thank you! FY 2012 results