Download as PDF, PPTX


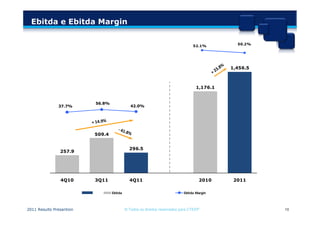

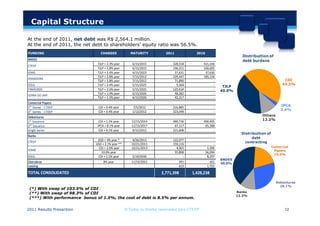

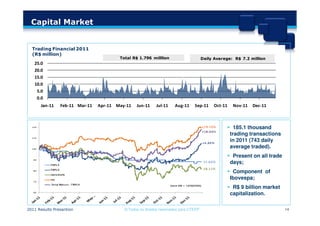


This document provides a summary of CTEEP's 2011 results. It discusses the company's expansion into new states, increases in gross operating revenue and net operating revenue from 2010 to 2011, maintenance and operating expenses from the fourth quarter of 2010 to the fourth quarter of 2011, EBITDA margins over 50% in 2011, and a net income of R$915.3 million in 2011 with earnings per share of R$6.00. Key financial metrics and investments are presented across various business areas from 2010 to 2011.


![Eletropaulo 1 q10_eng_final [modo de compatibilidade]](https://cdn.slidesharecdn.com/ss_thumbnails/eletropaulo1q10engfinalmododecompatibilidade-100517082821-phpapp01-thumbnail.jpg?width=640&height=640&fit=bounds)


