The document summarizes Seadrill's second quarter 2013 conference call. Key highlights include:
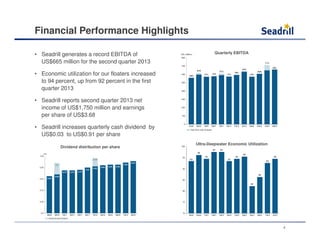
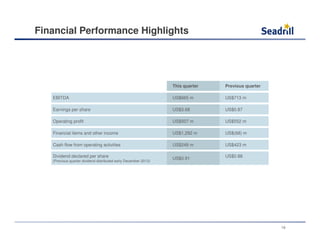
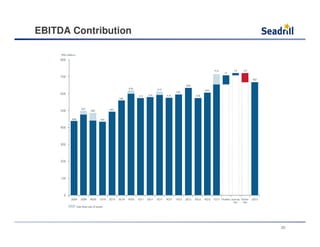
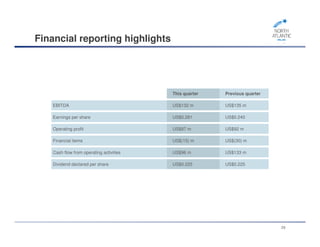
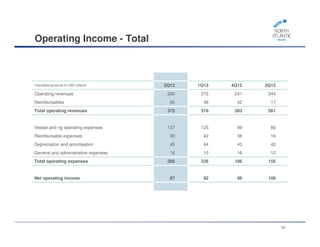
- Seadrill generated a record $665 million in EBITDA for Q2 2013.
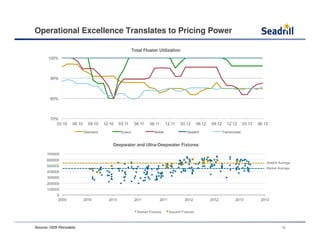
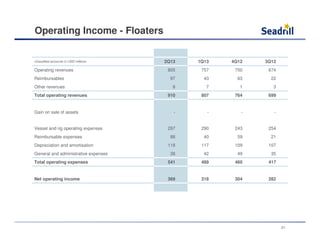
- Economic utilization of floaters increased to 94% from 92% last quarter.
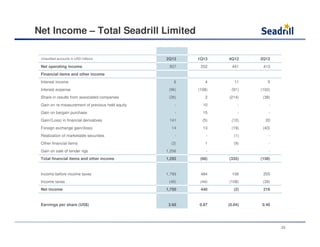
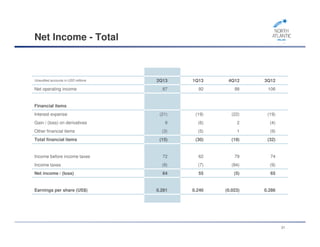
- Net income was $1.75 billion and earnings per share was $3.68.
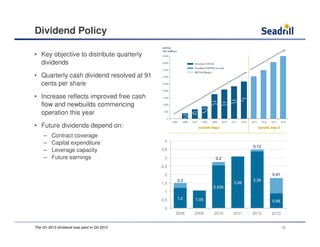
- The quarterly cash dividend was increased to $0.91 per share.