Download as PDF, PPTX
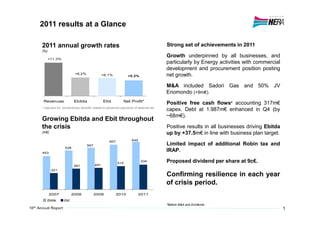
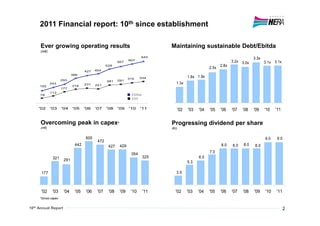
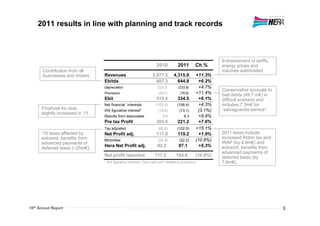
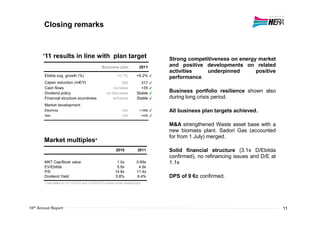

The annual report summarizes Hera Group's strong financial results for 2011, its 10th year in operation. Revenues grew 11.3% to €4.3 billion due to growth across all business lines. EBITDA increased 6.2% to €644.8 million and net profit rose 5.3% to €97.1 million. The results were in line with business plans and maintained the company's track record of resilient performance through the economic crisis.


