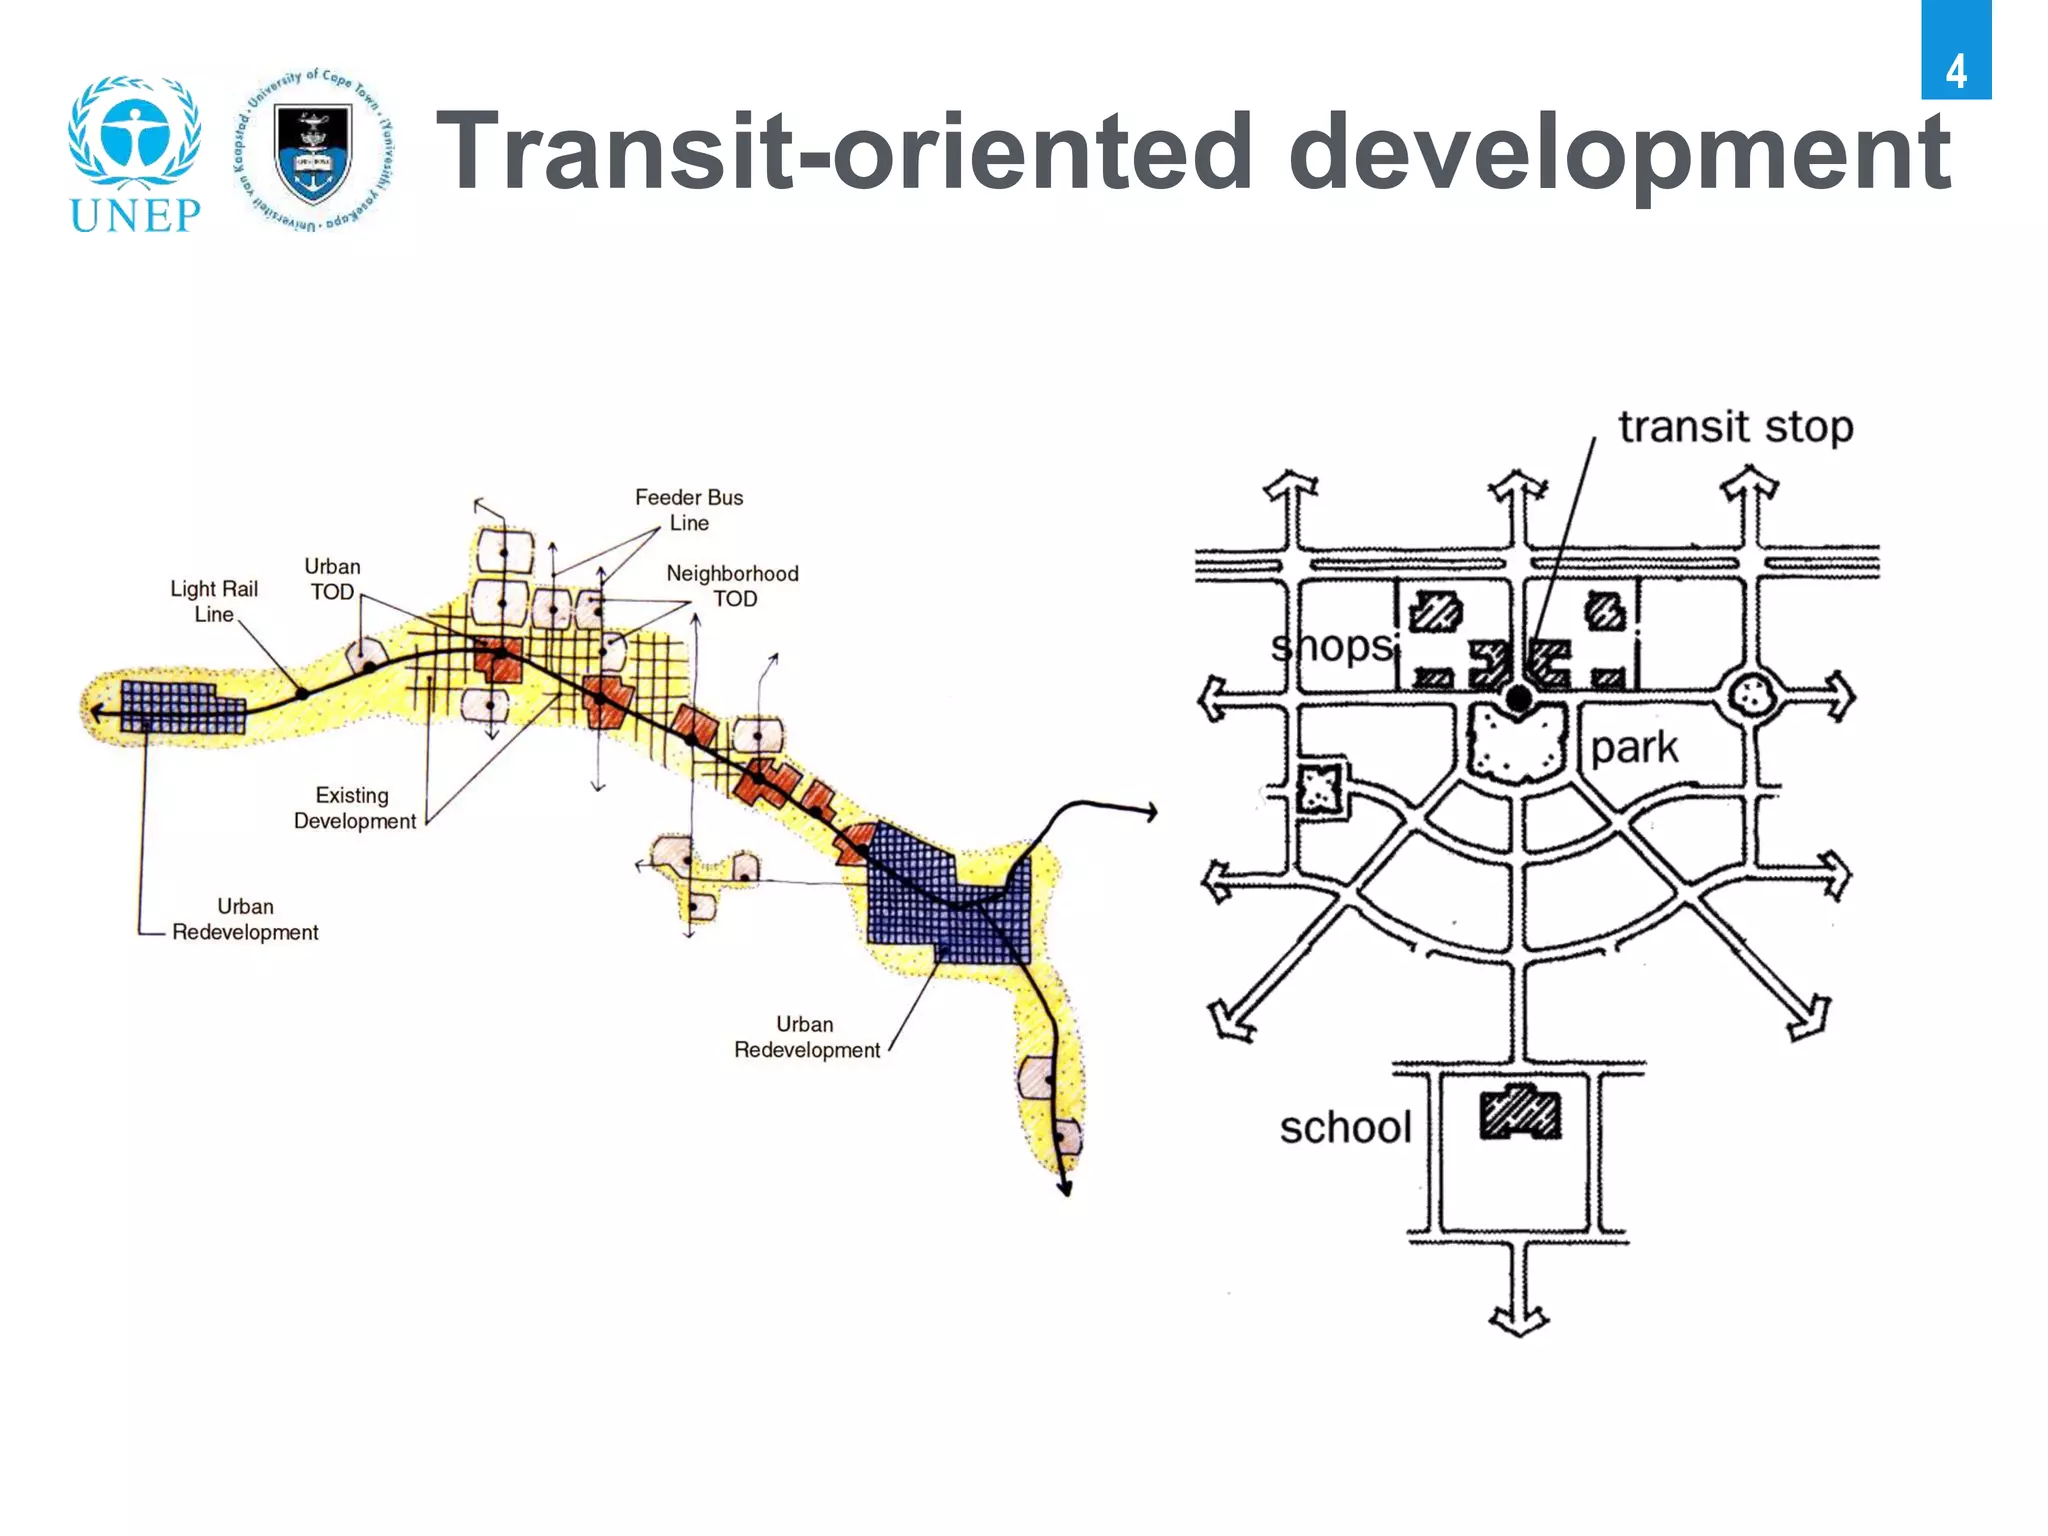
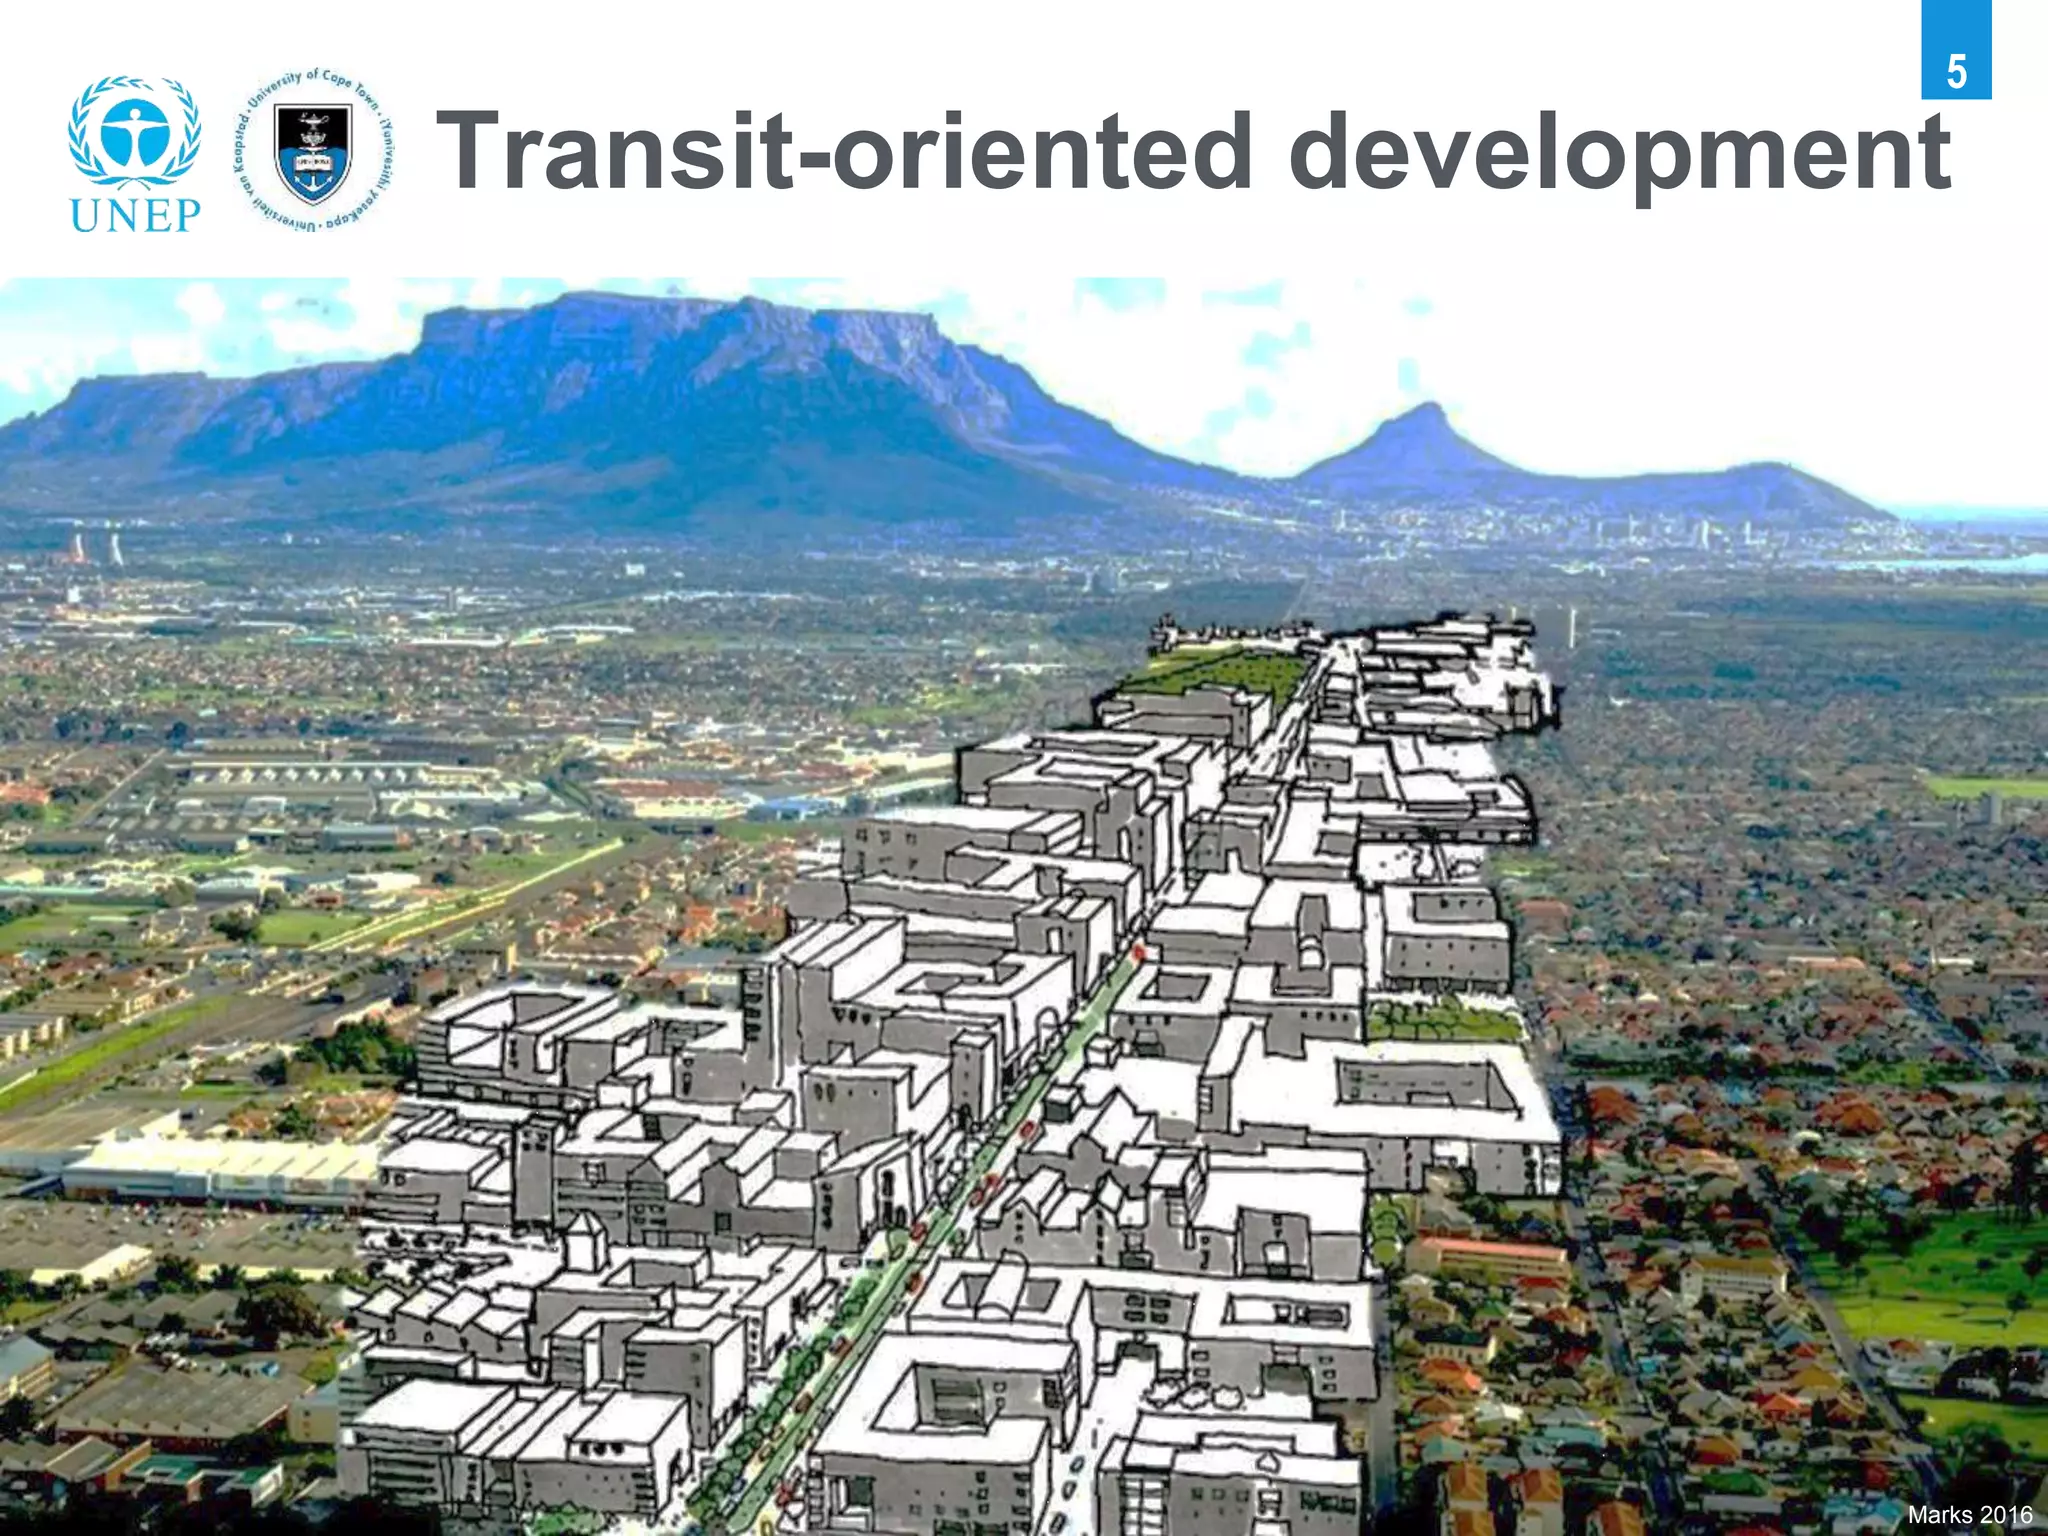
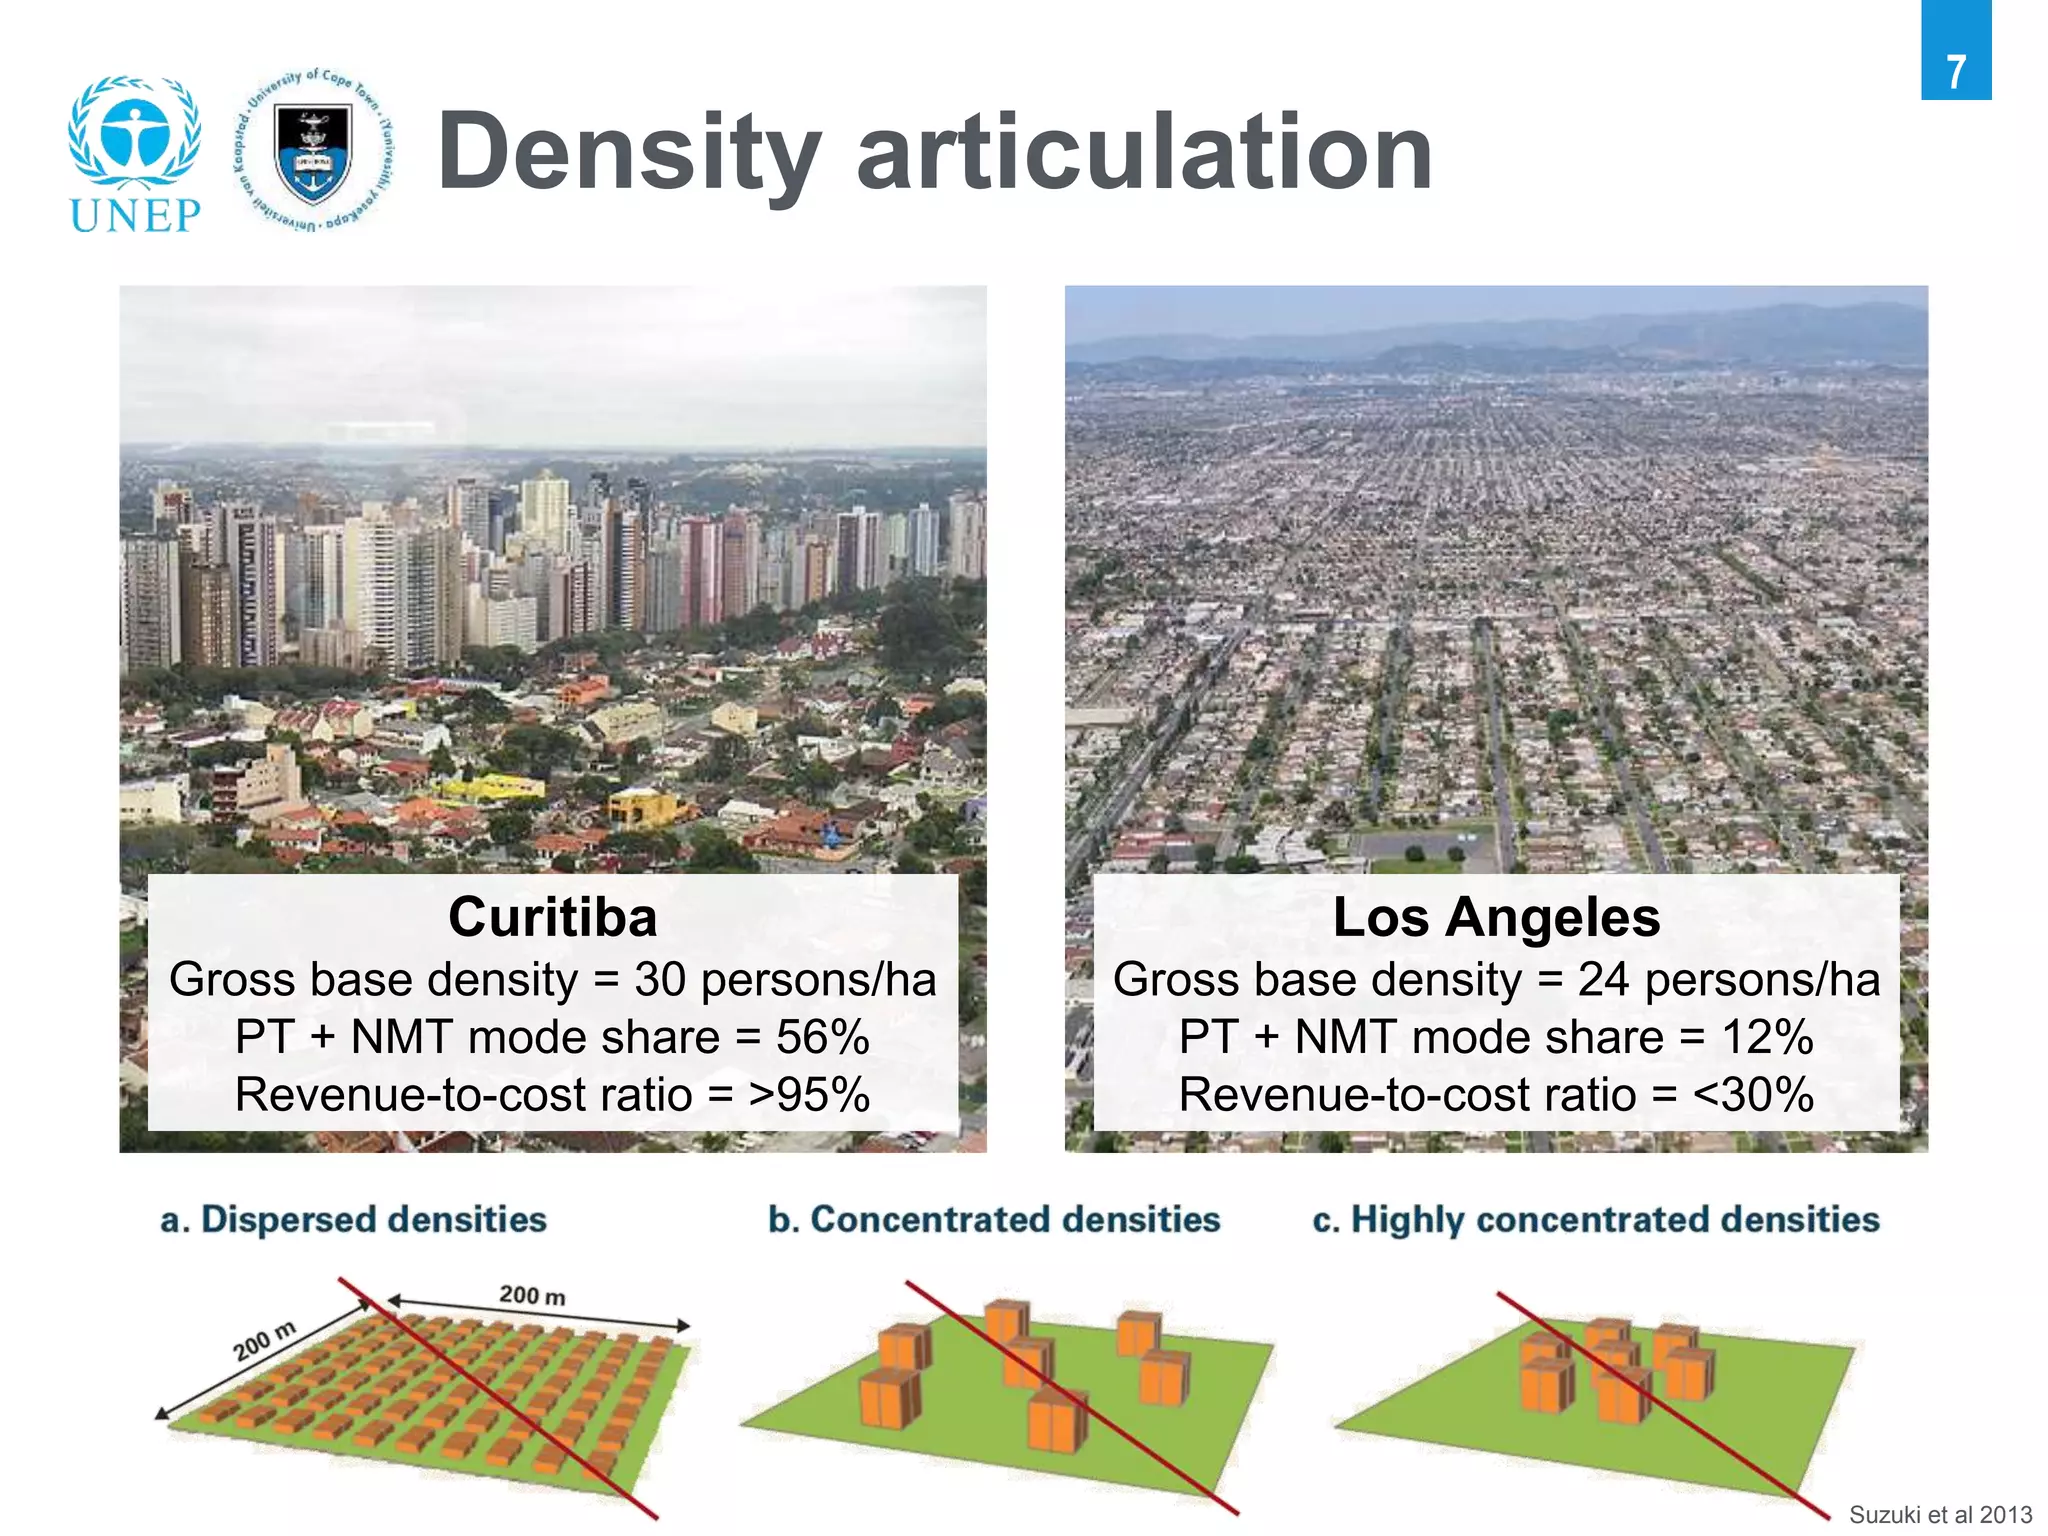
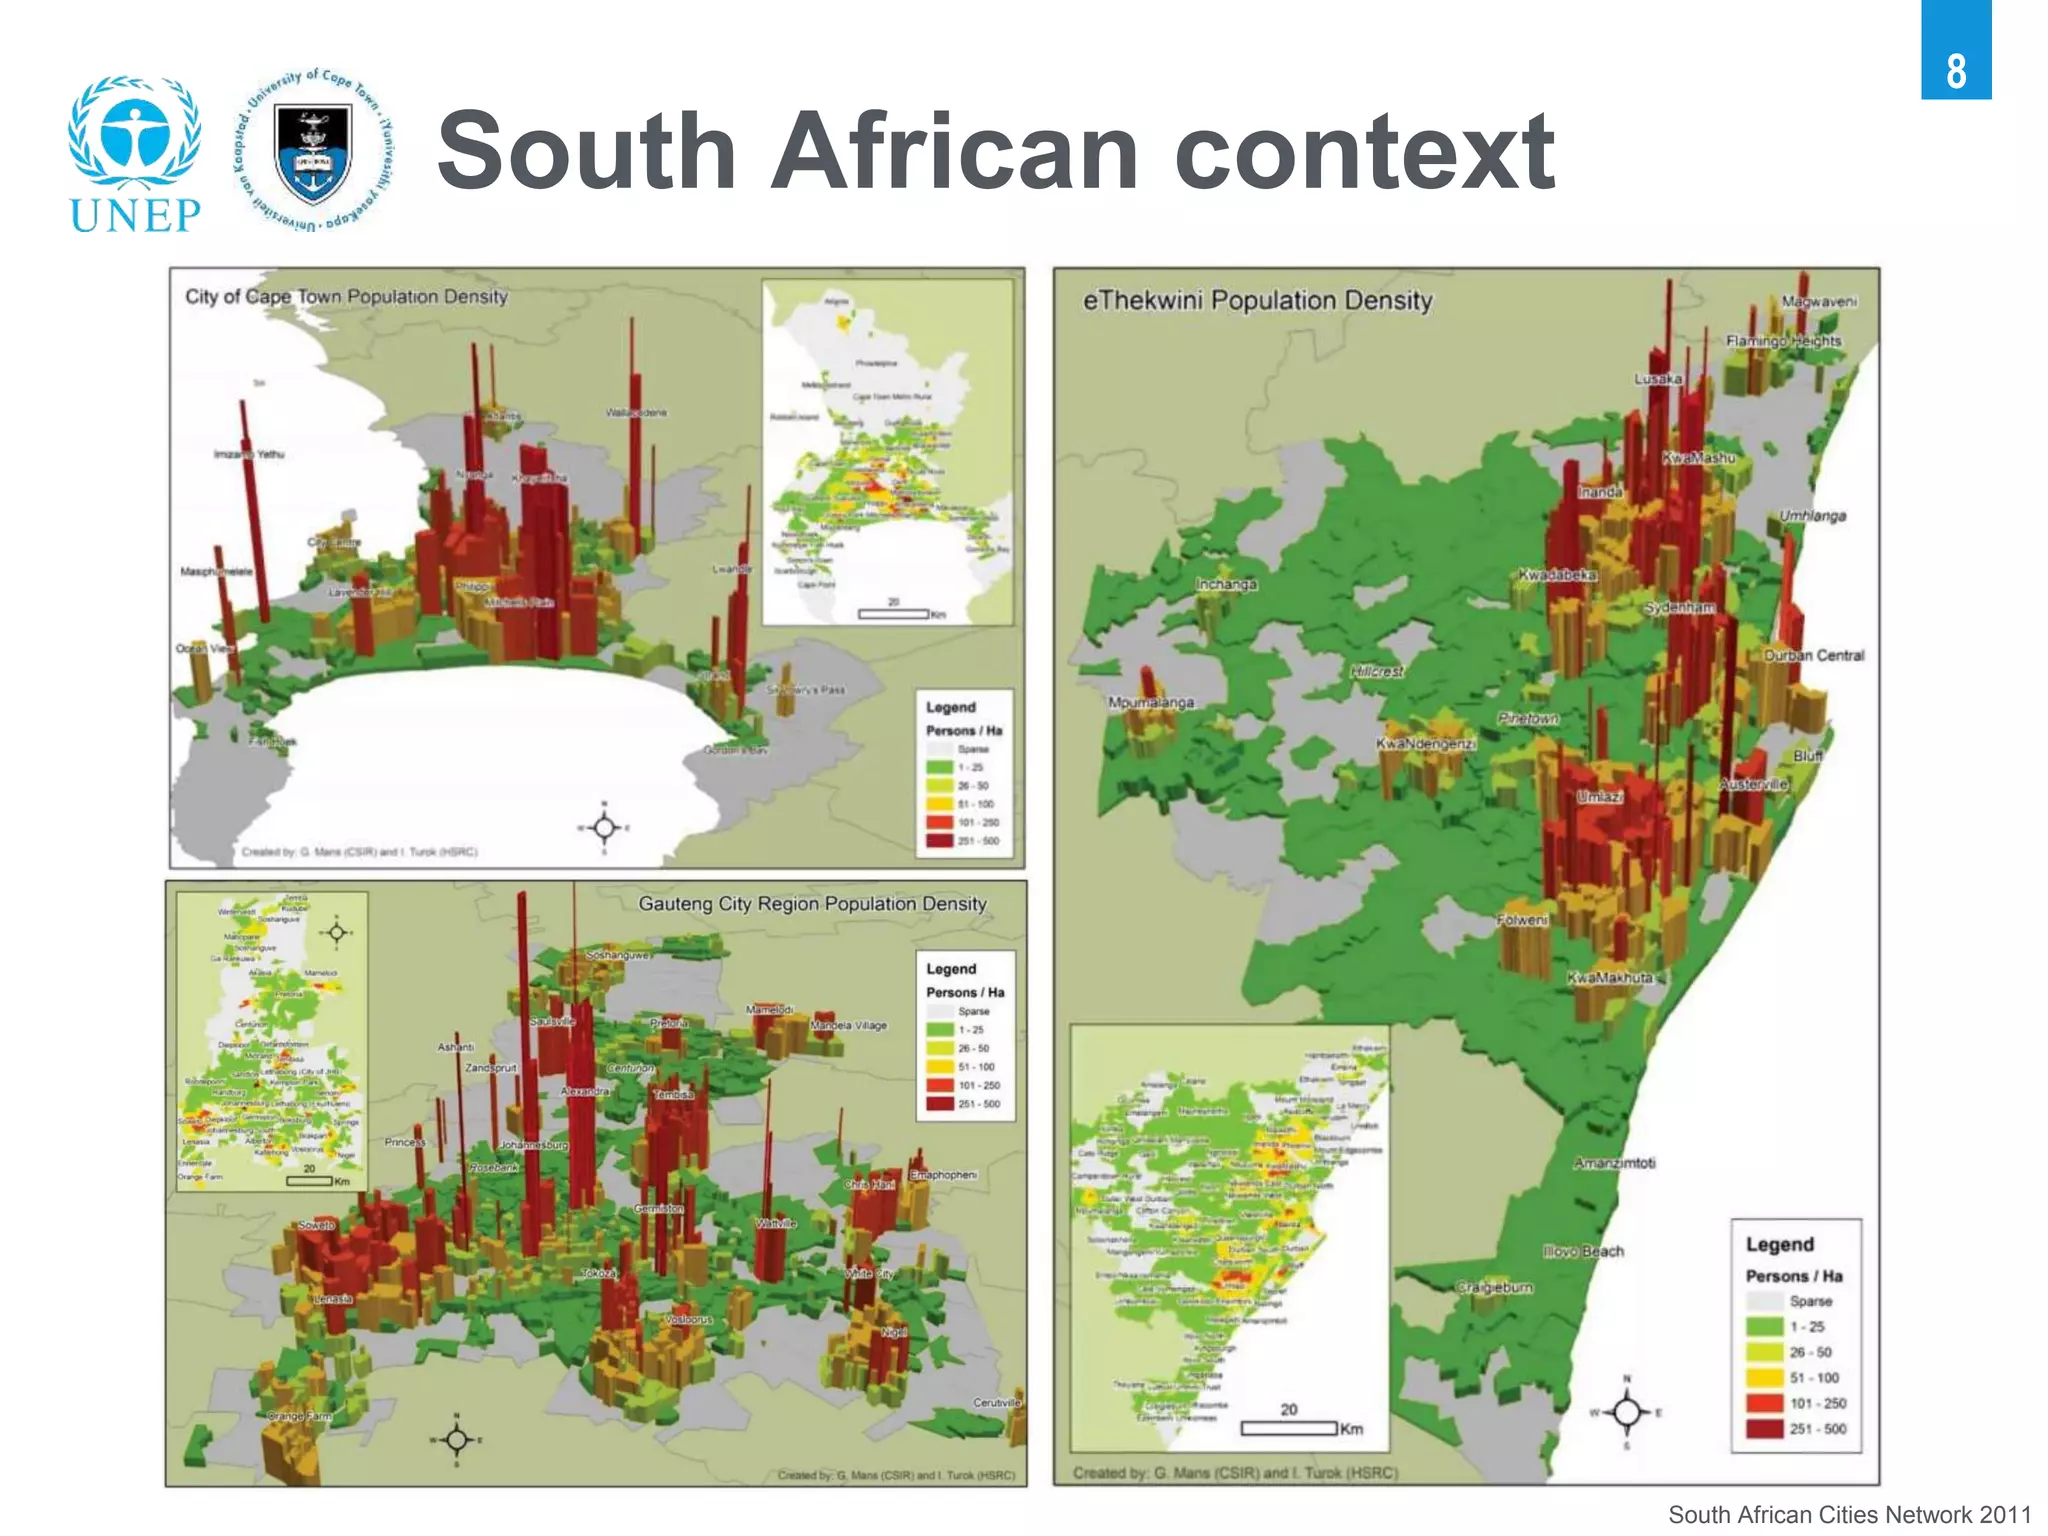
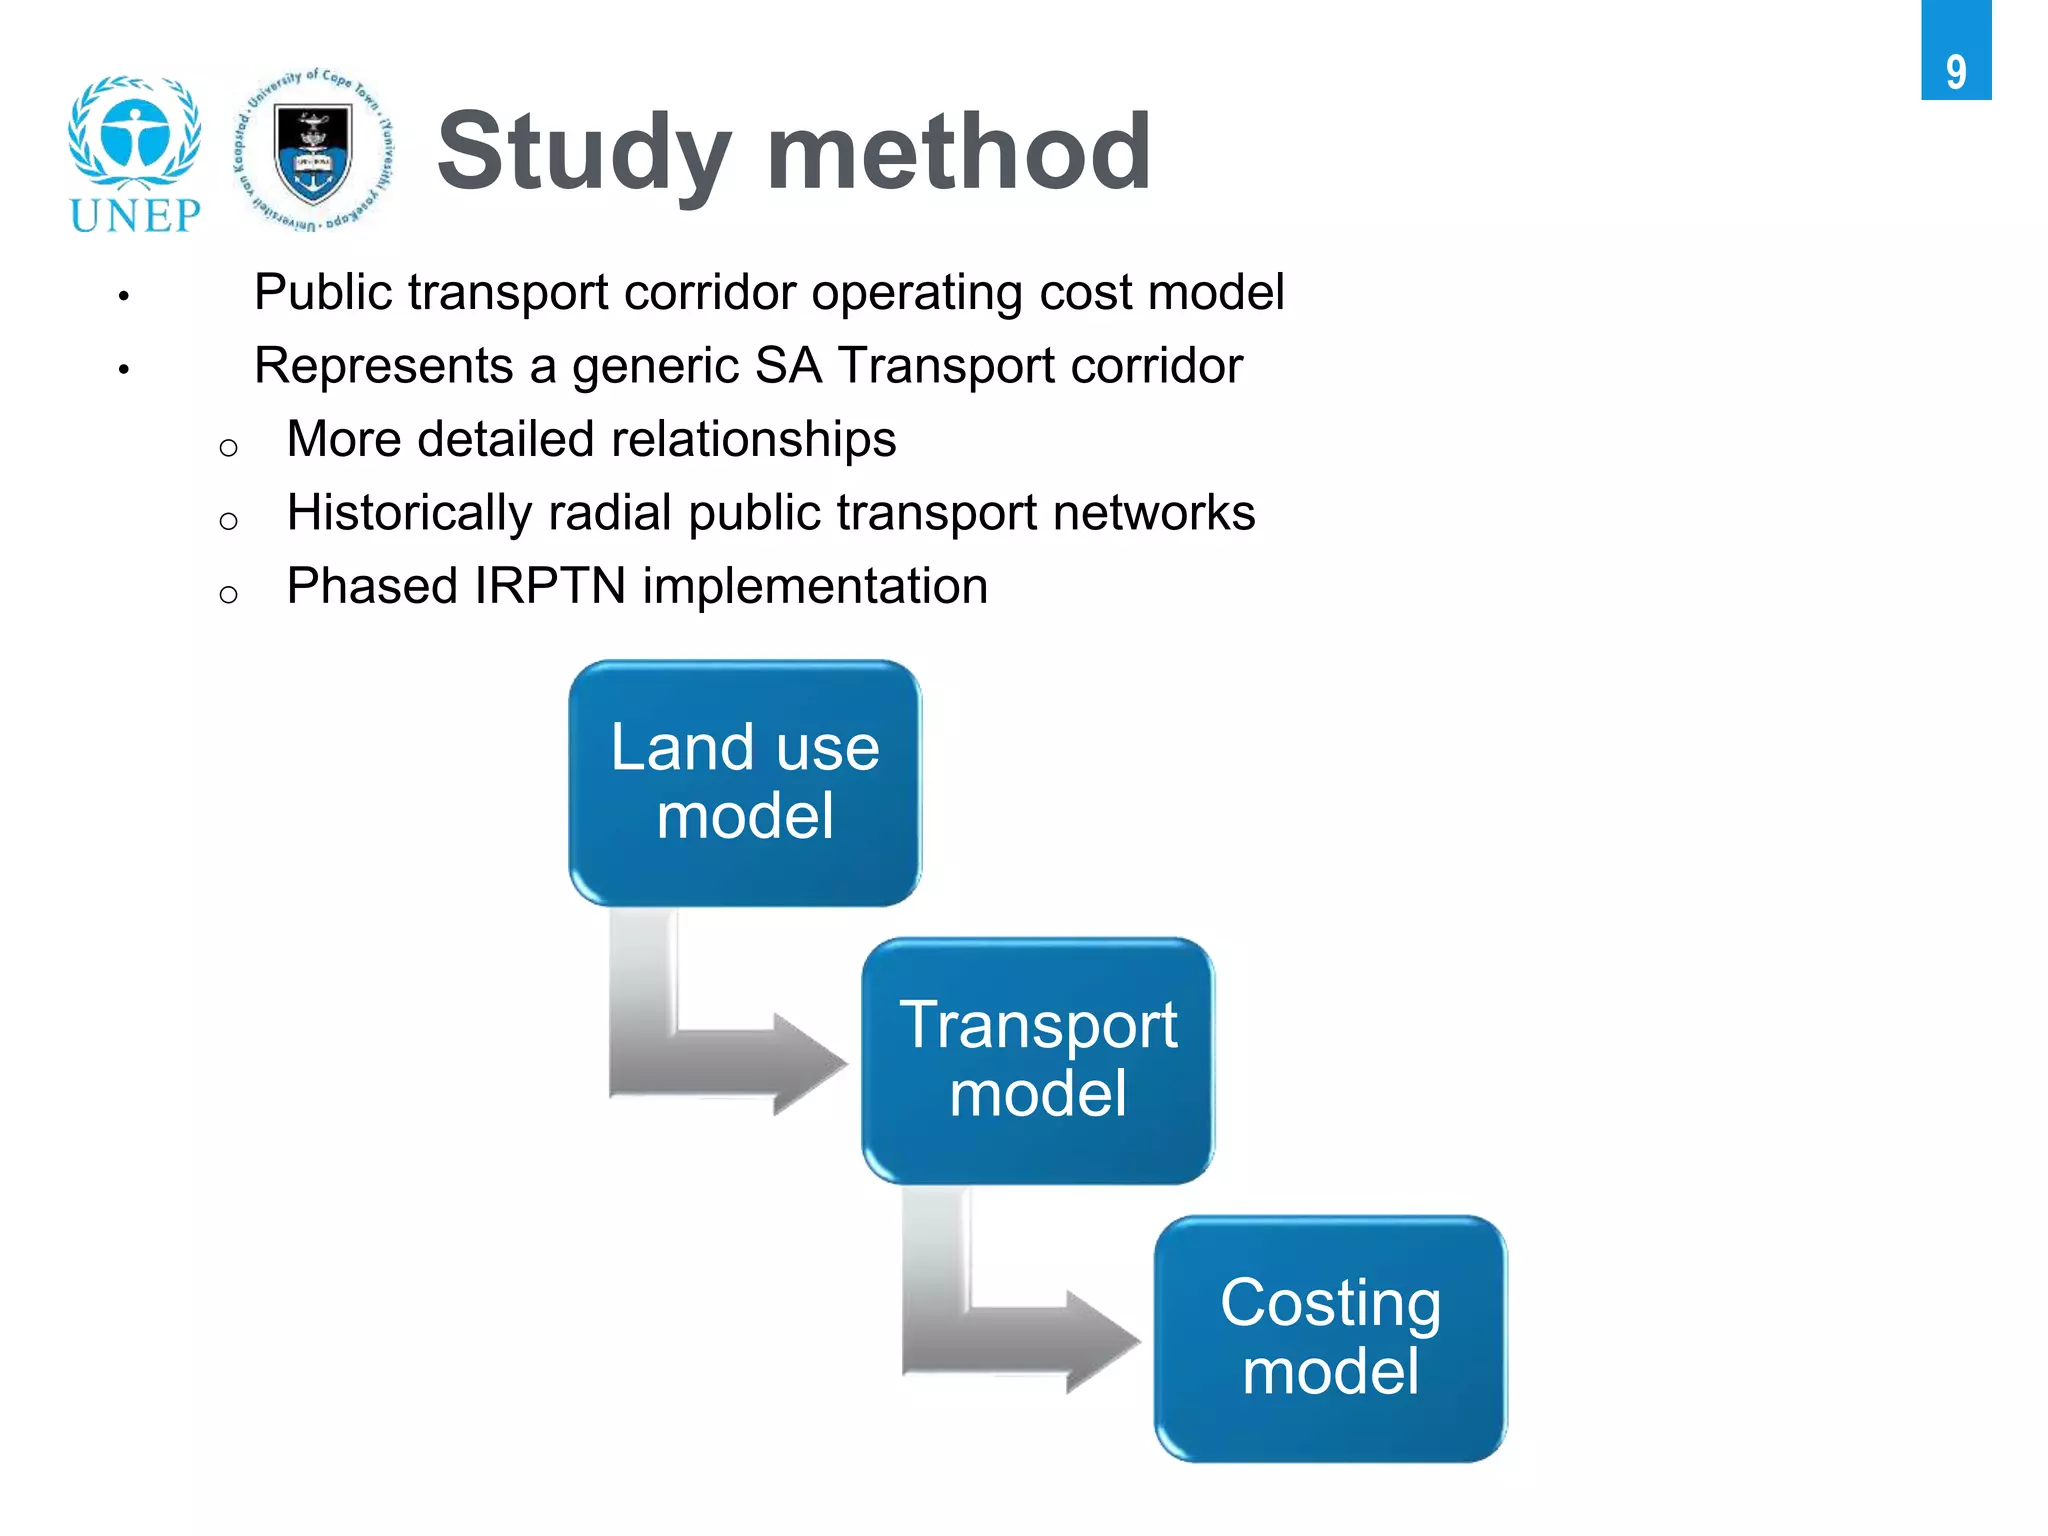
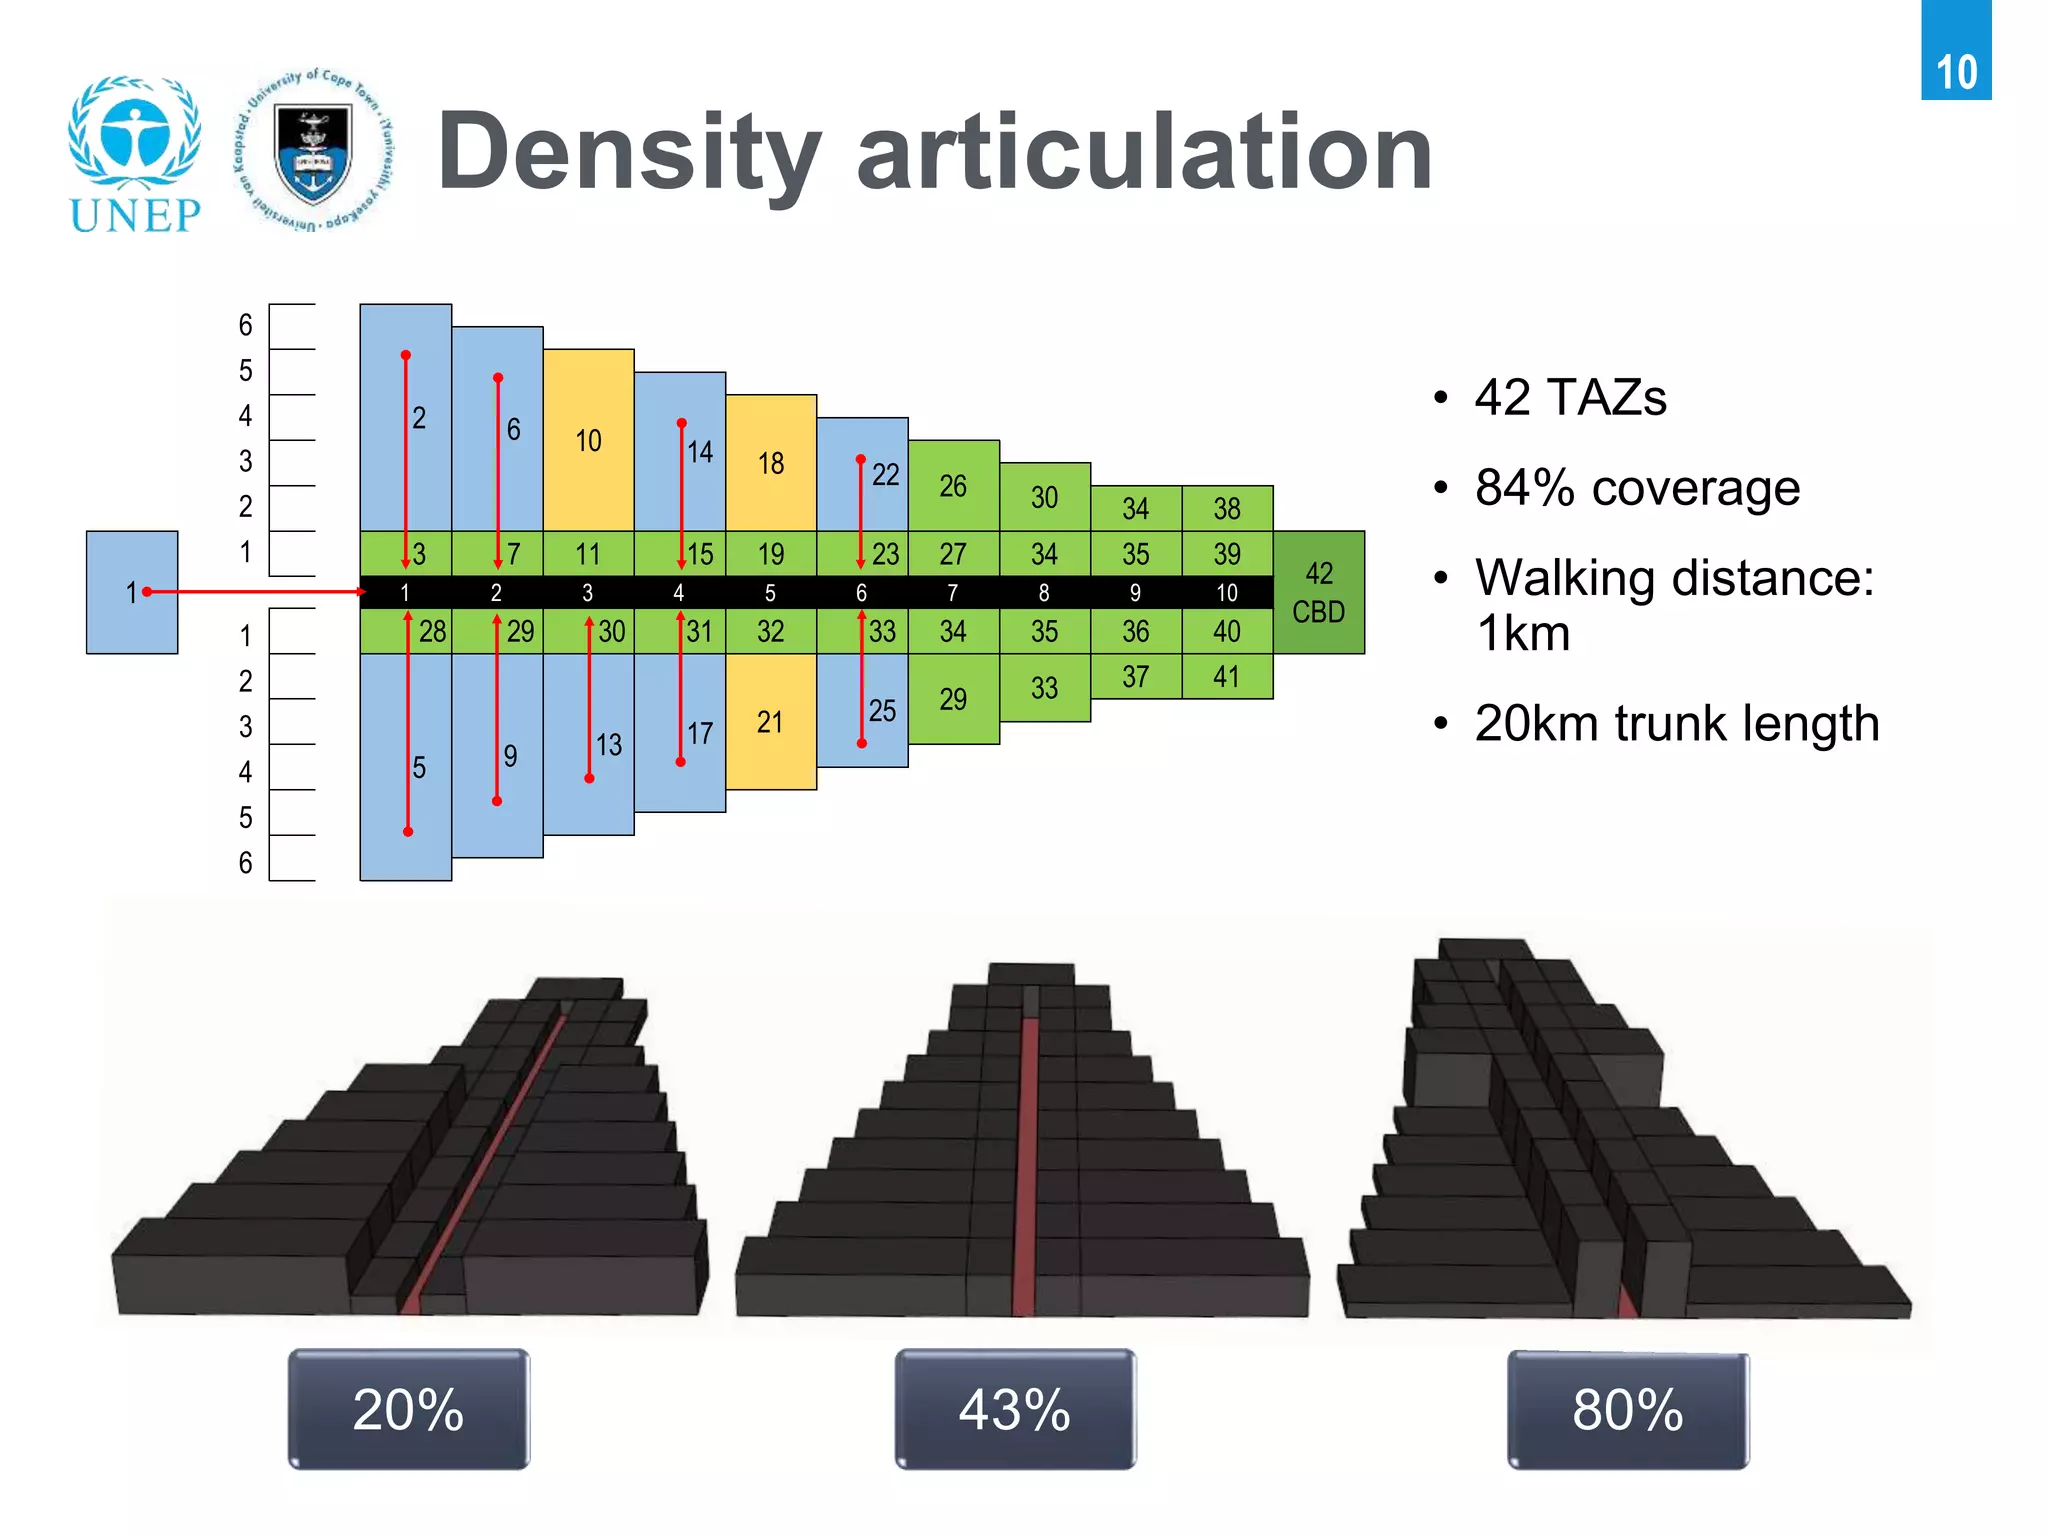
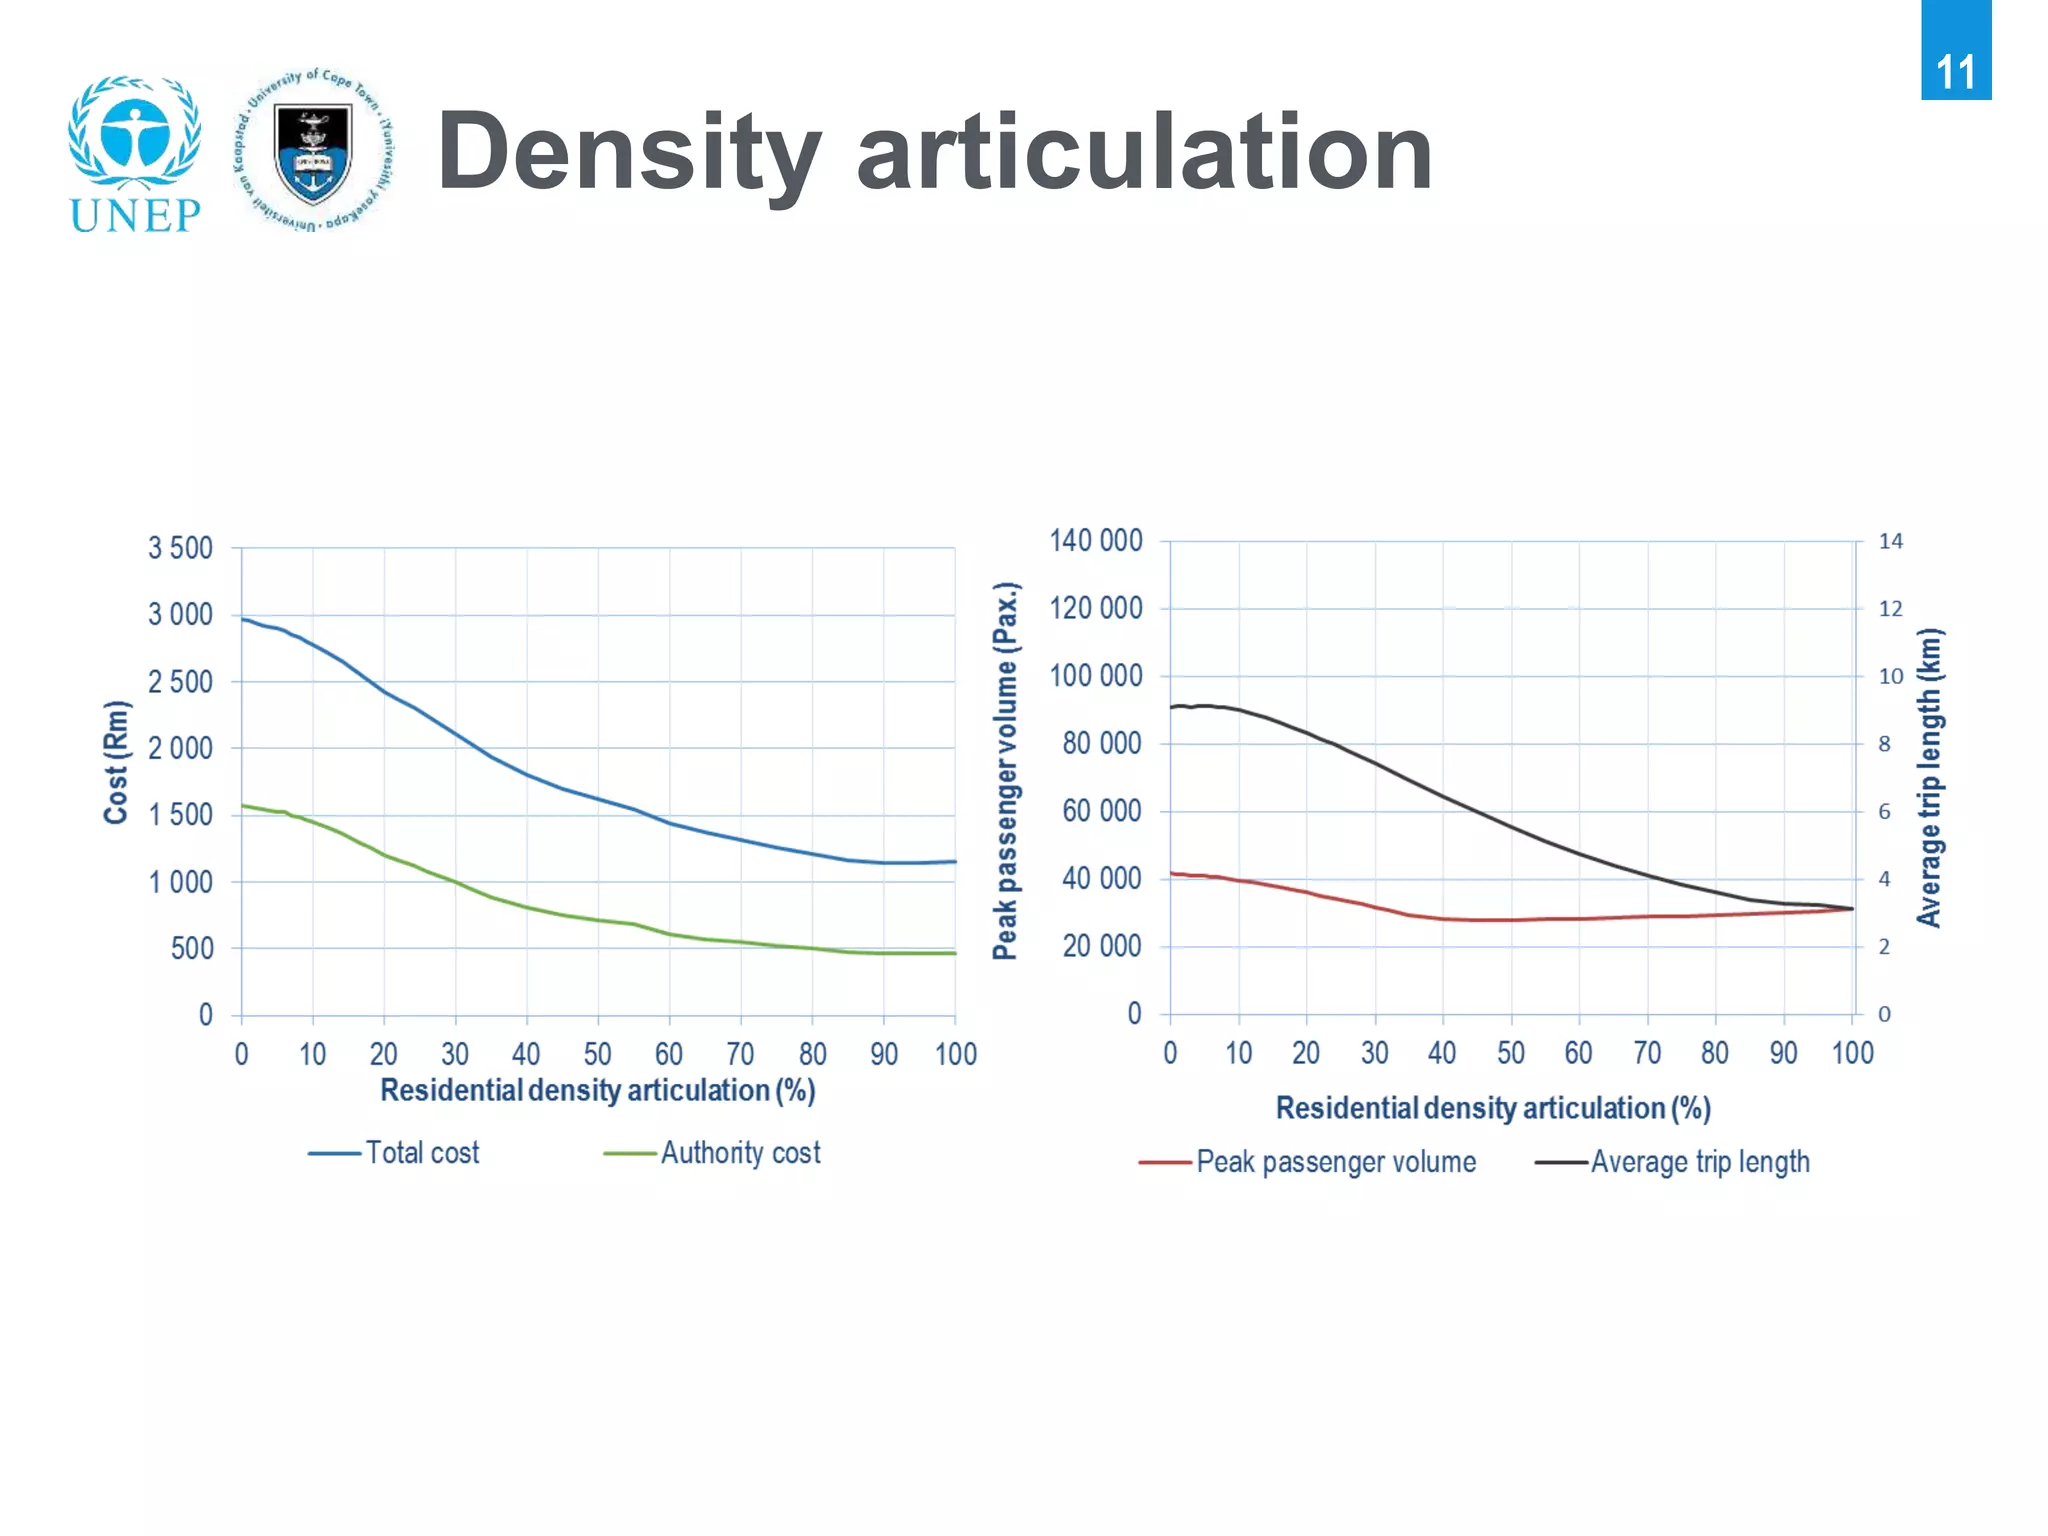
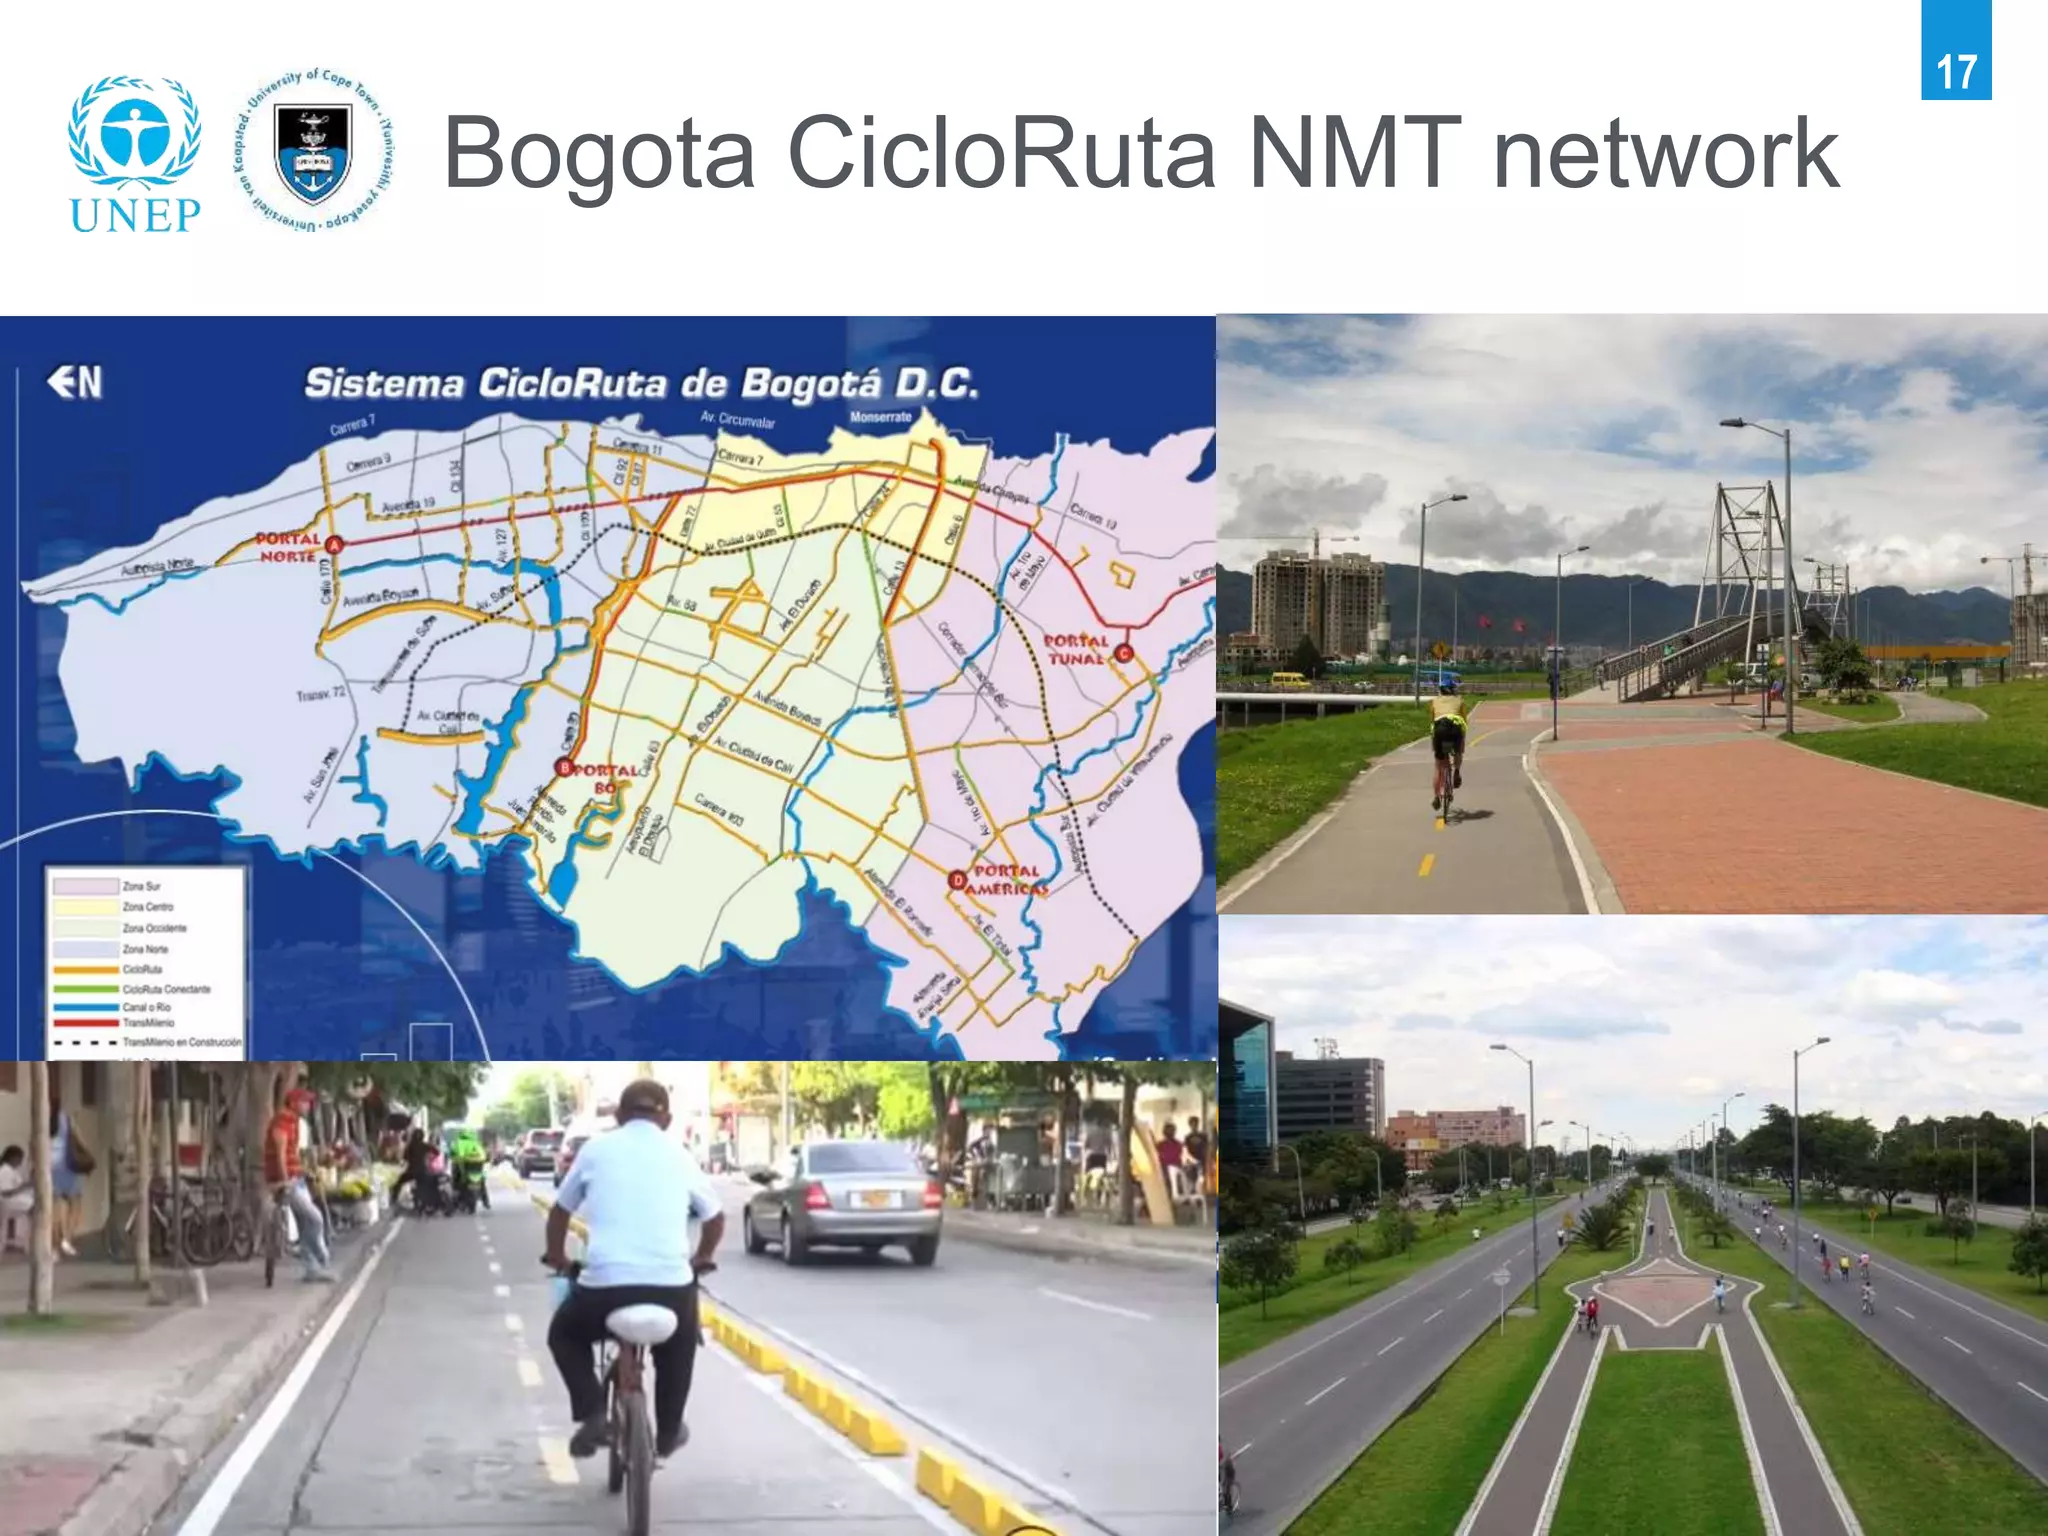
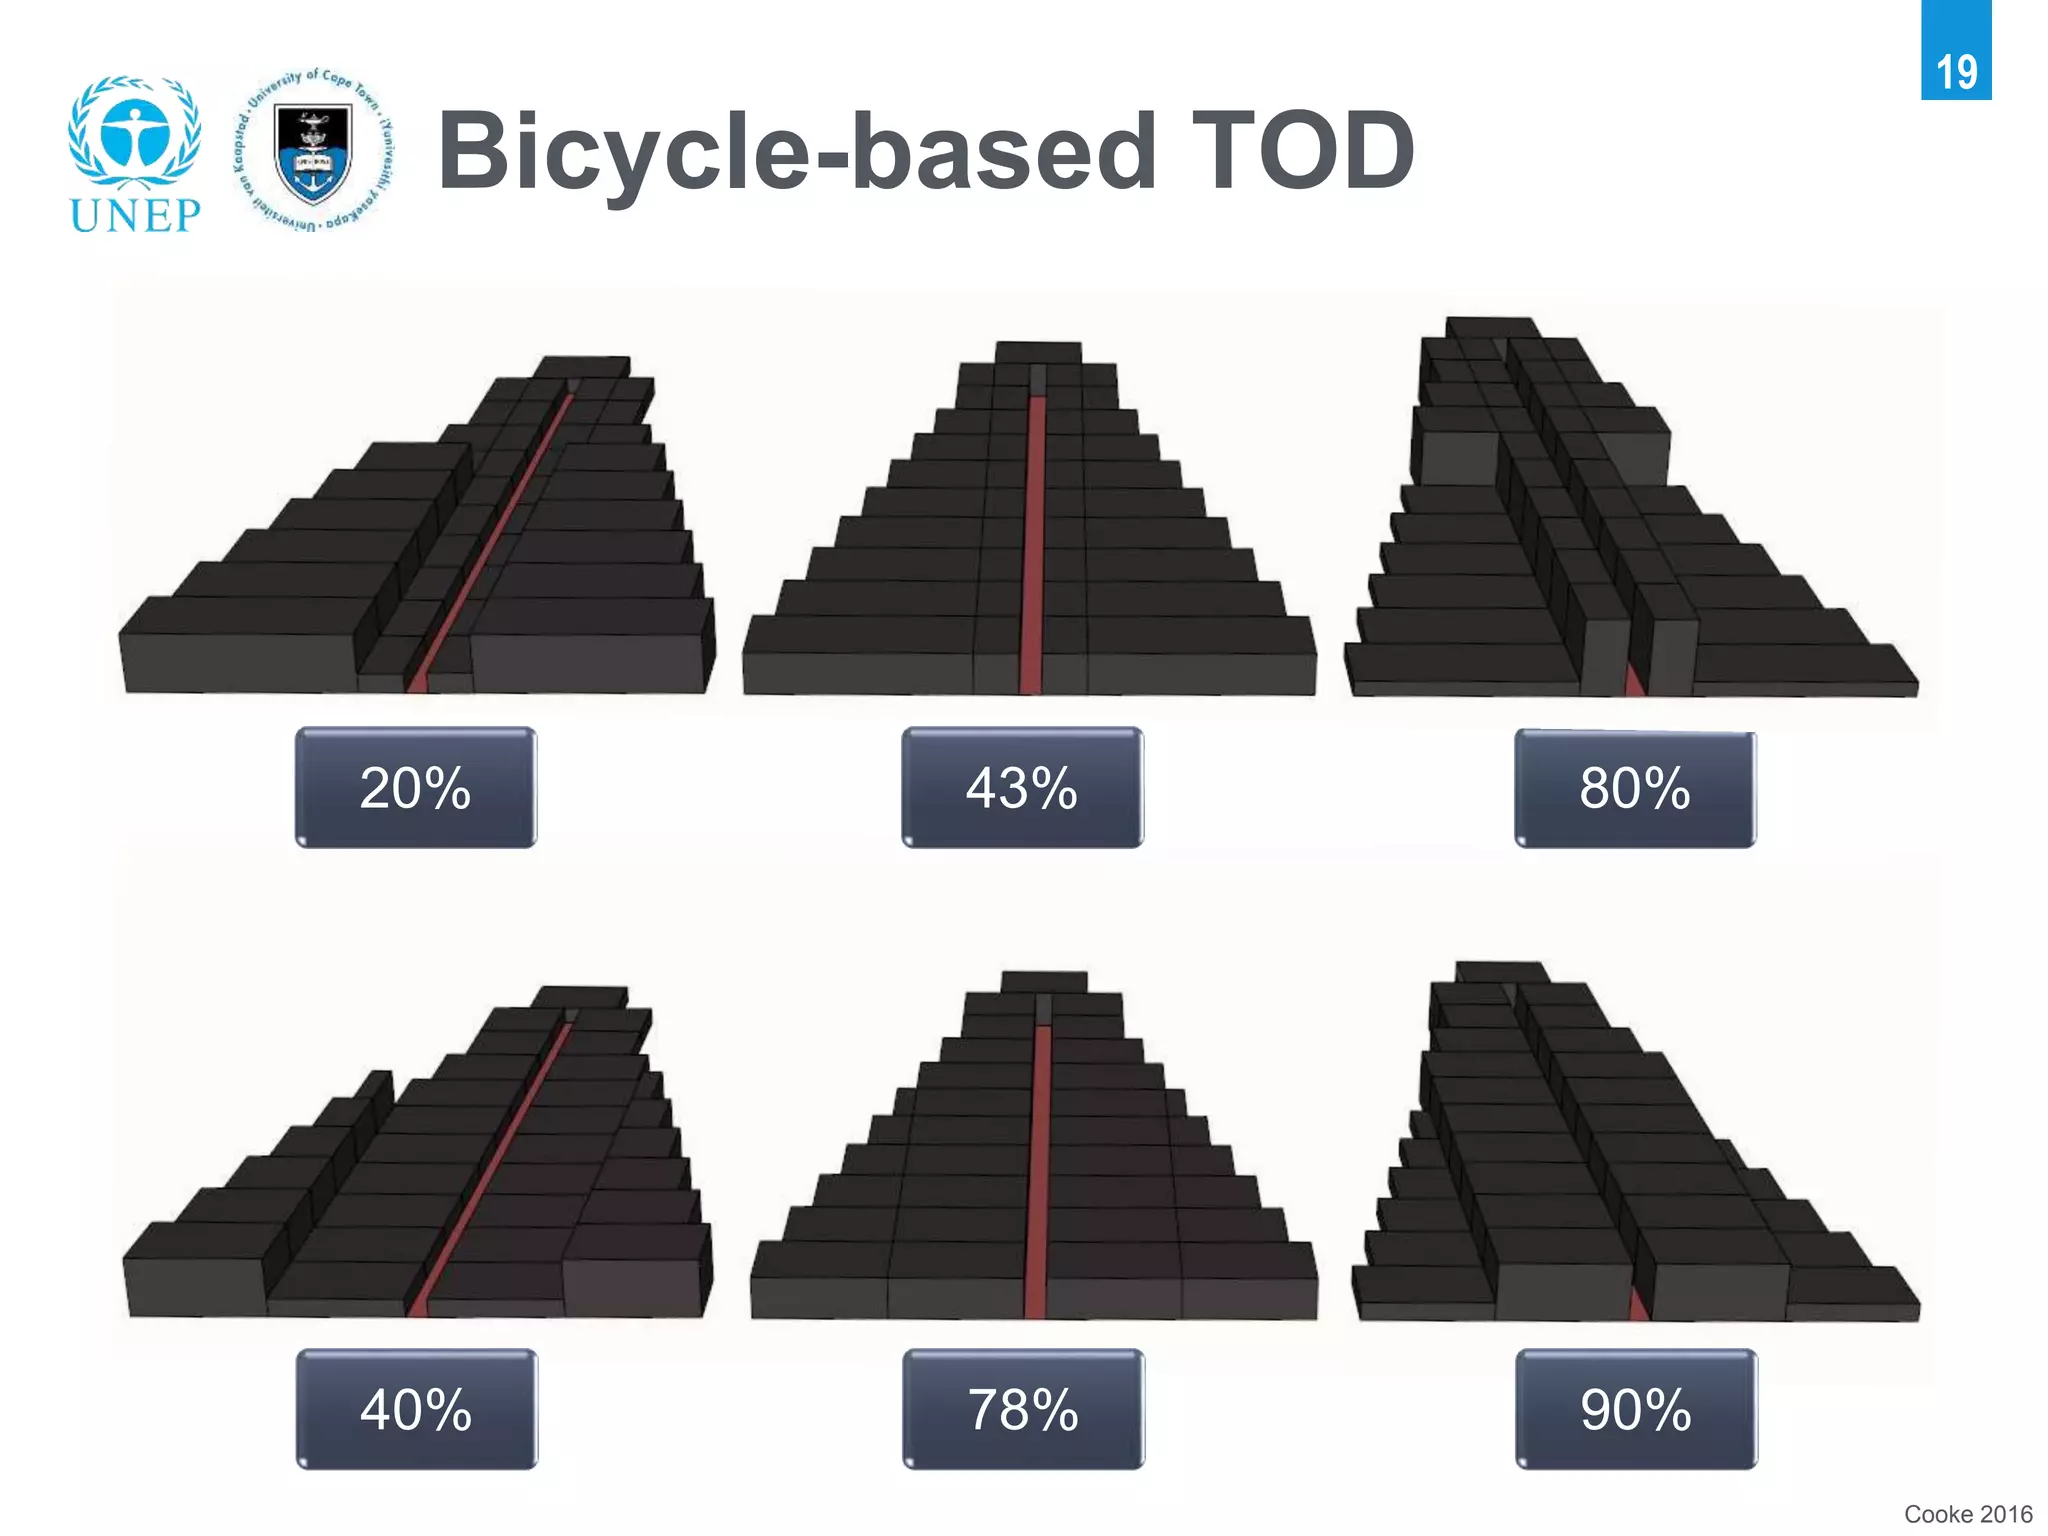
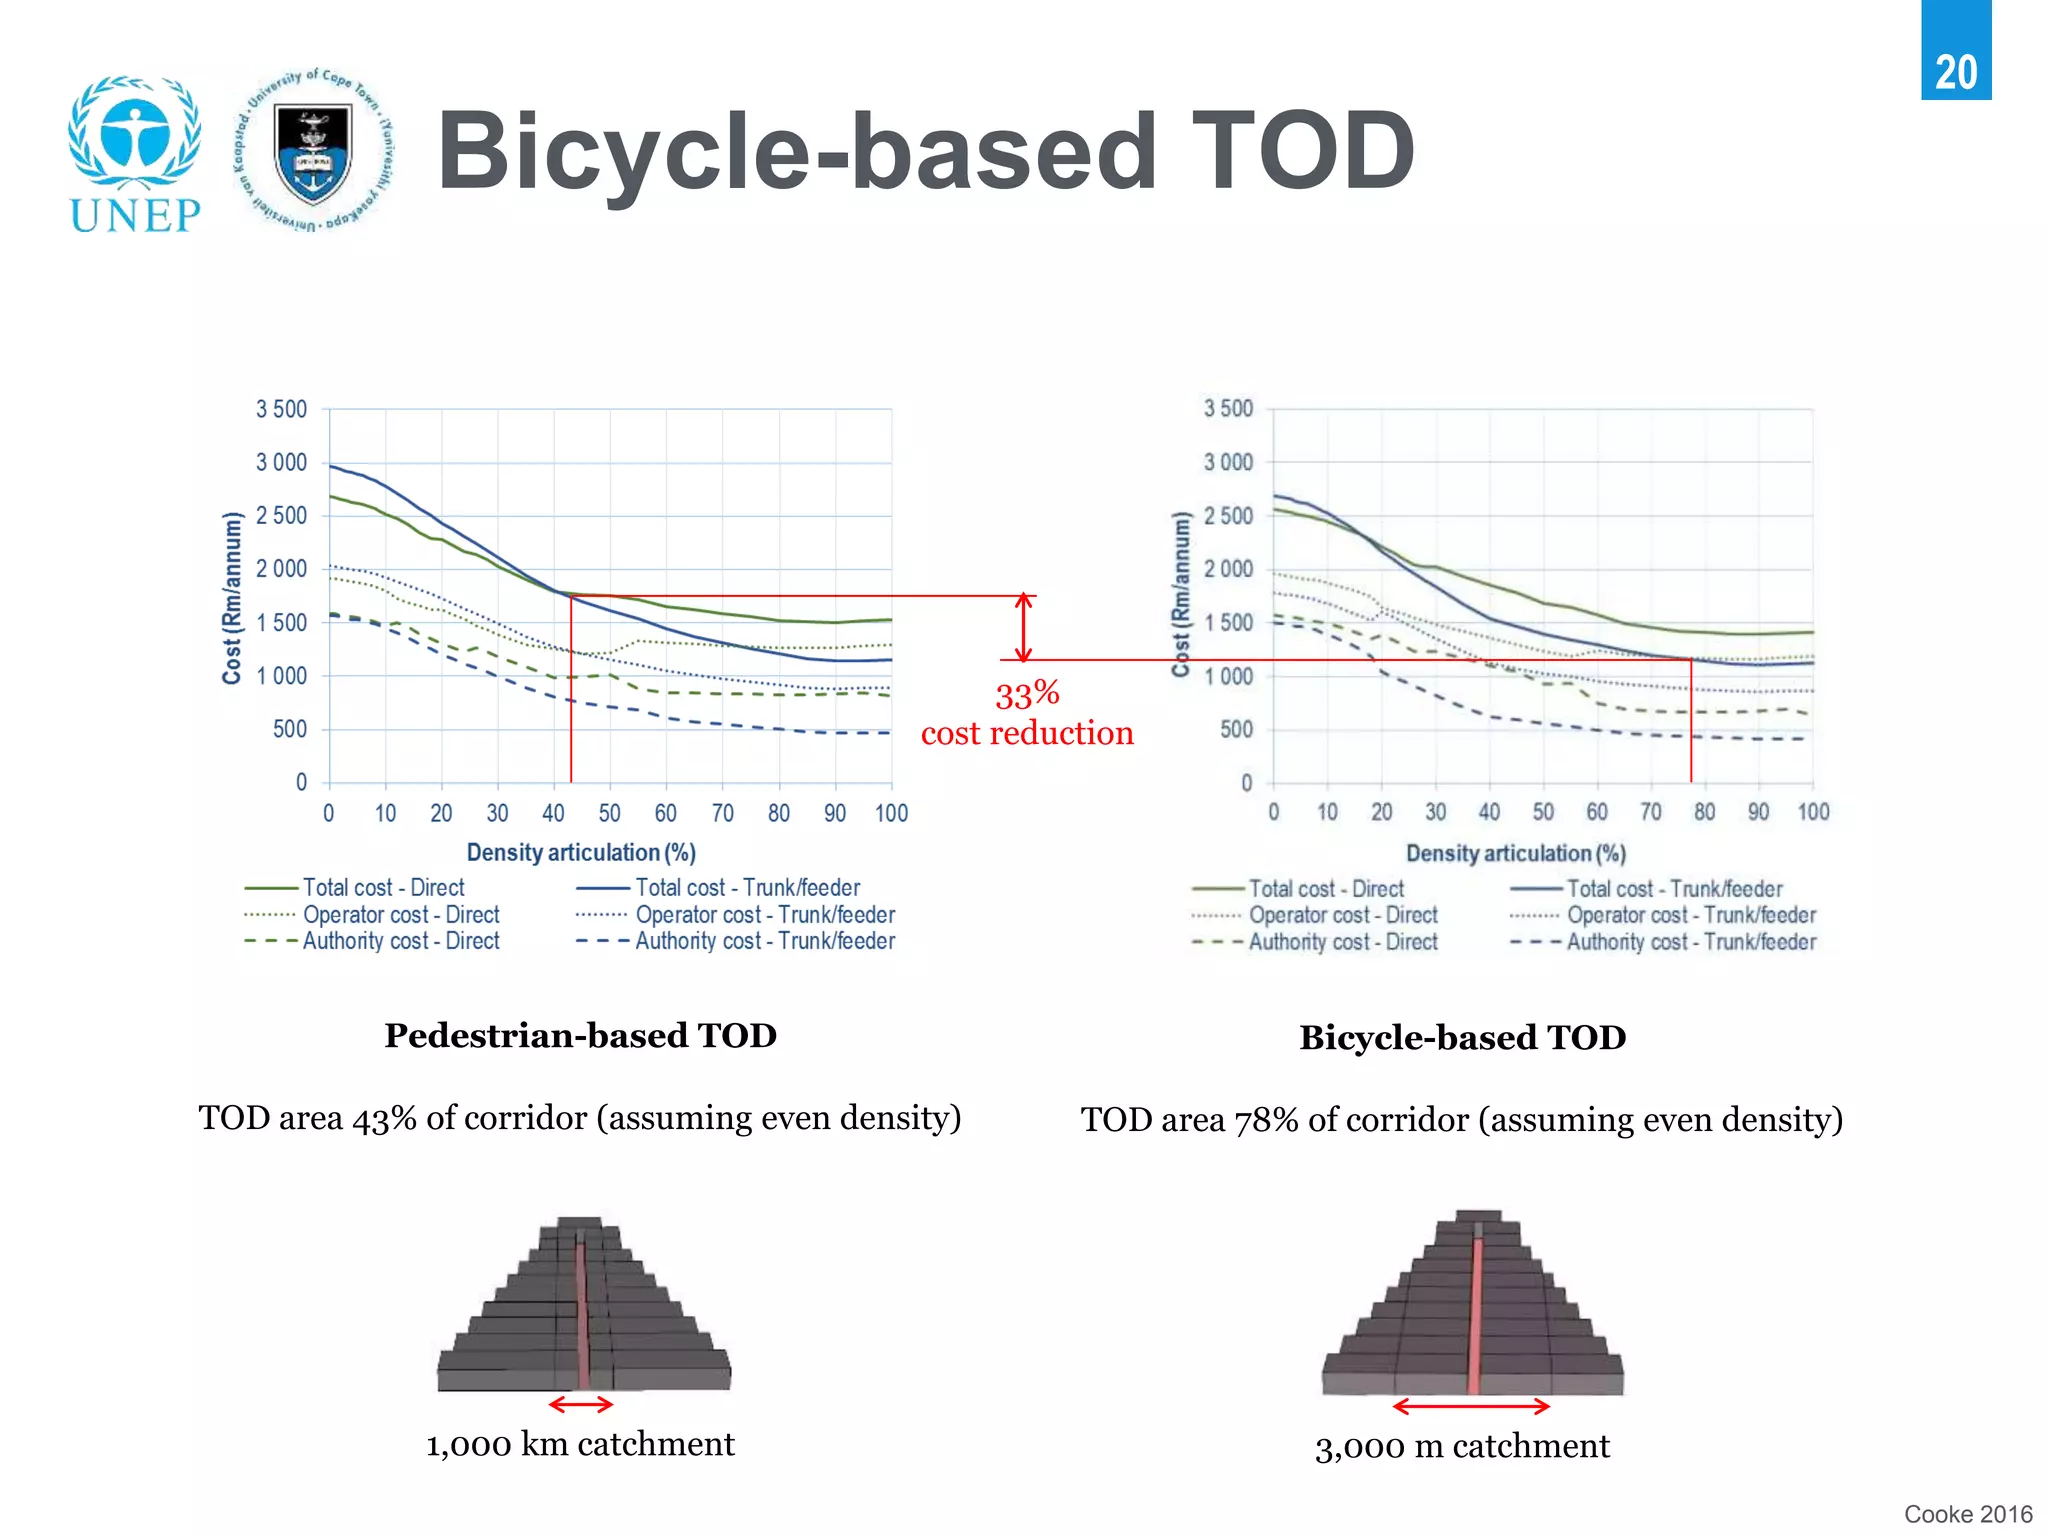
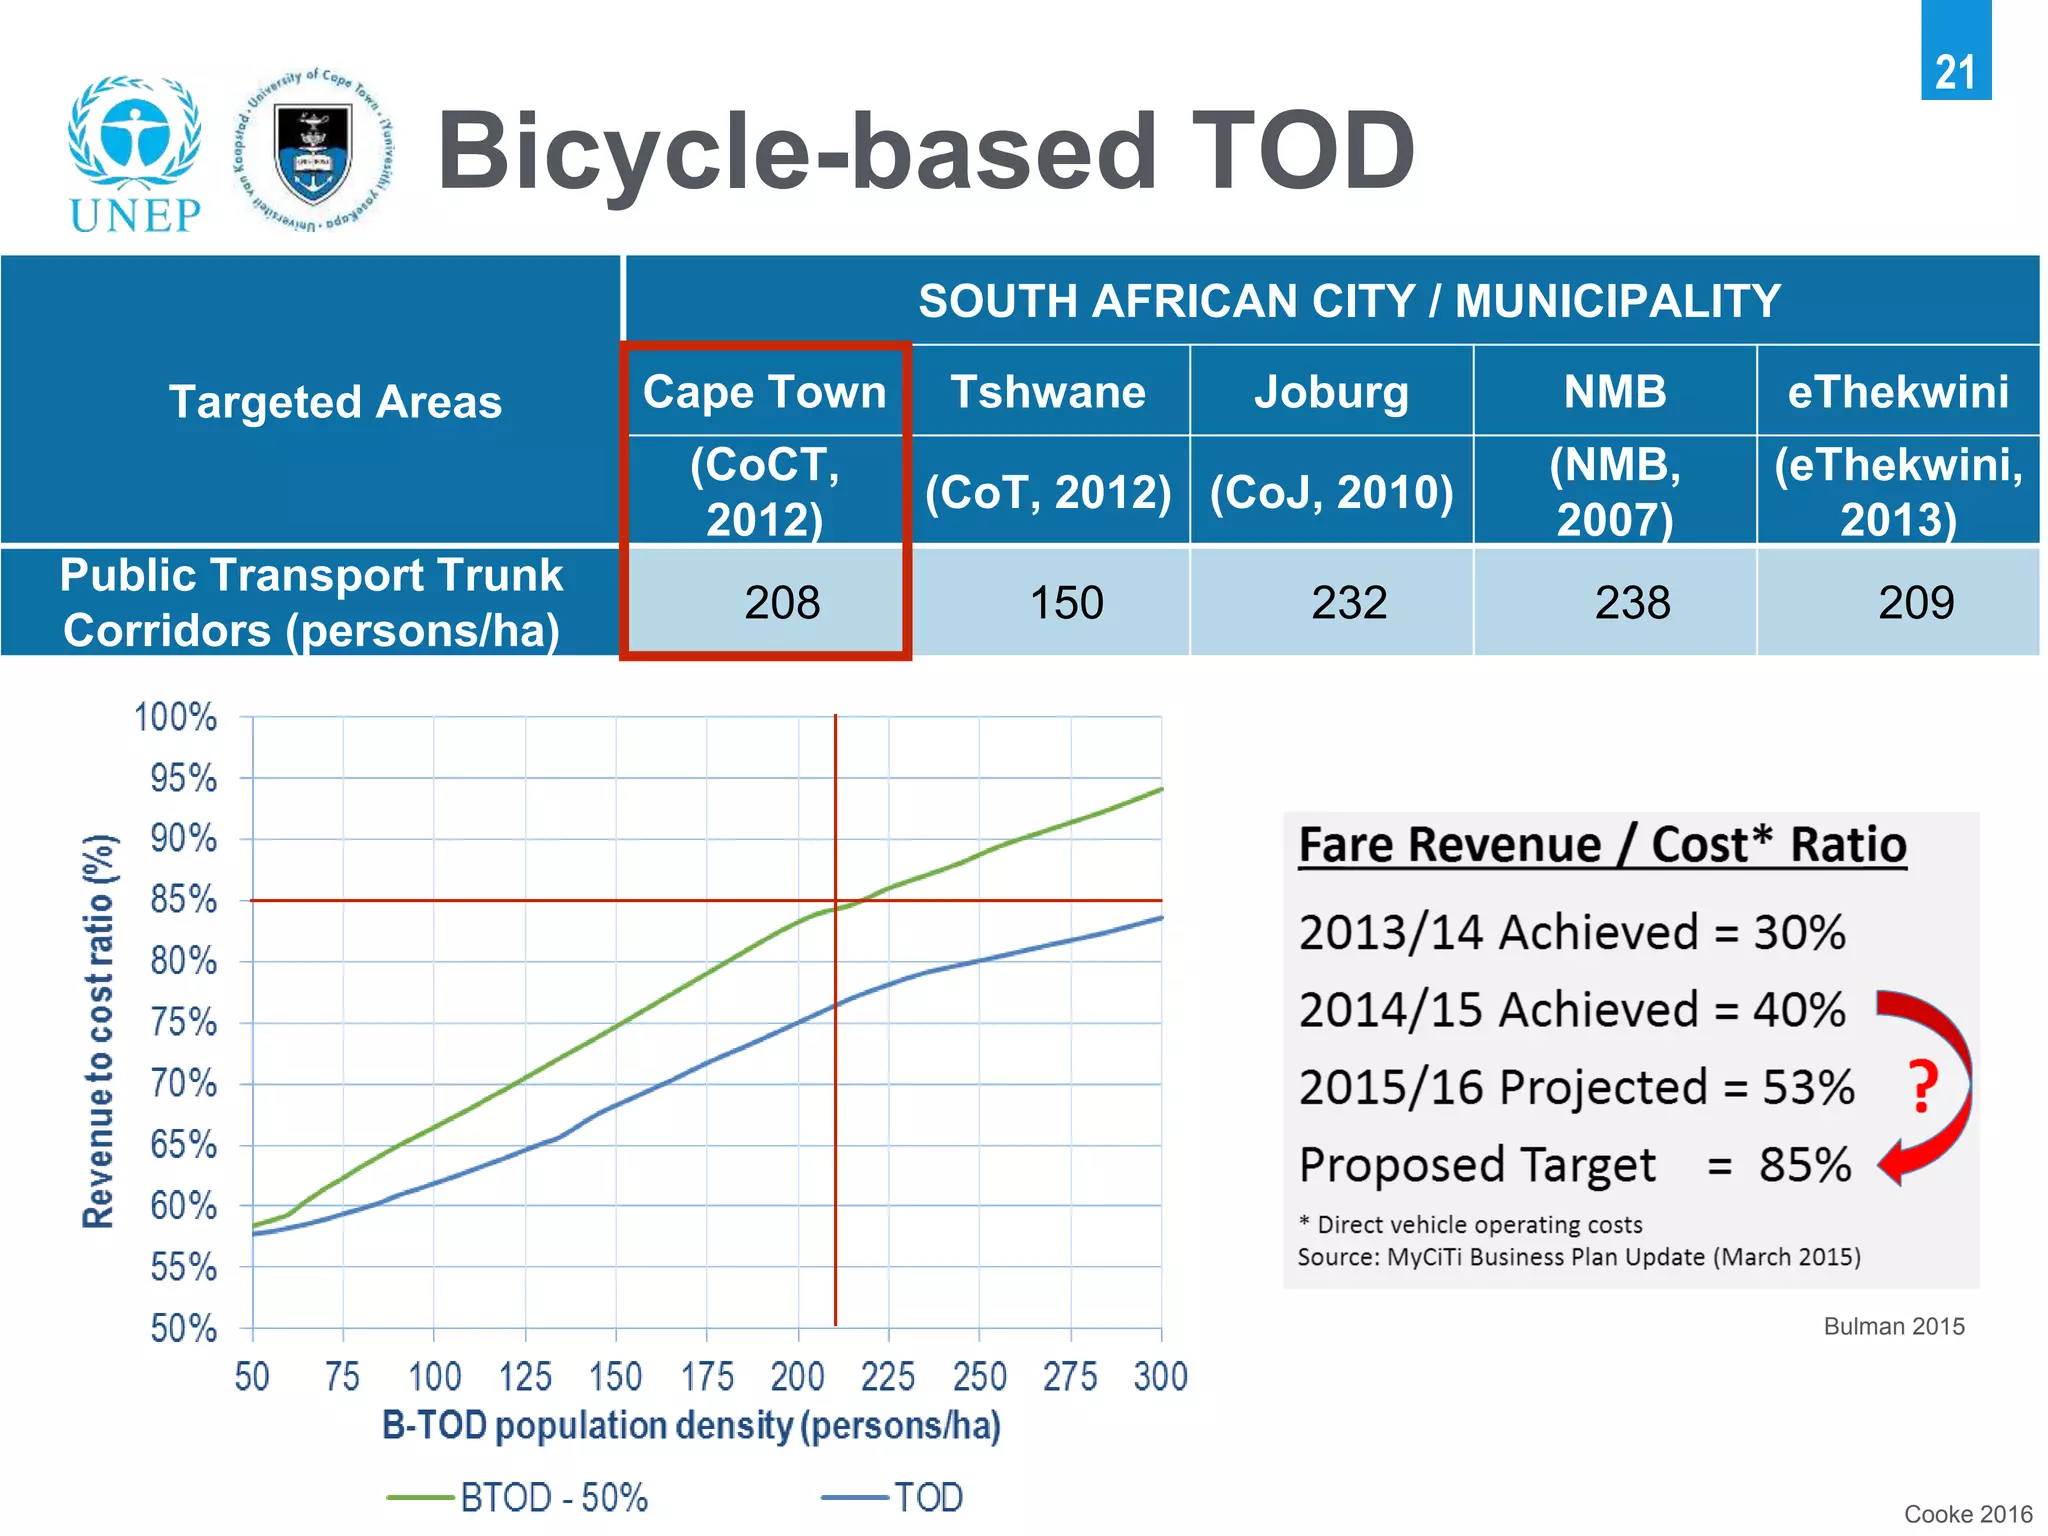
3A NMT WORKSHOP
NMT infrastructure: Bicycle-based
Transit Oriented Development (B-TOD)
SEAN COOKE
35th Southern African Transport
Conference
2
Bicycle-based Transit
Oriented Development (B-TOD)
Transit oriented development (TOD)
Density articulation
NMT integration
Bicycle-based TOD
Conclusion
01 TRANSIT ORIENTED
DEVELOPMENT
4
Transit-oriented development
5
Marks 2016
Transit-oriented development
02 DENSITY
ARTICULATION
7
Suzuki et al 2013
Density articulation
Los Angeles
Gross base density = 24 persons/ha
PT + NMT mode share = 12%
Revenue-to-cost ratio = <30%
Curitiba
Gross base density = 30 persons/ha
PT + NMT mode share = 56%
Revenue-to-cost ratio = >95%
South African Cities Network 2011
8
South African context
9
• Public transport corridor operating cost model
• Represents a generic SA Transport corridor
o More detailed relationships
o Historically radial public transport networks
o Phased IRPTN implementation
Study method
Land use
model
Transport
model
Costing
model
10
Density articulation
• 42 TAZs
• 84% coverage
• Walking distance:
1km
• 20km trunk length
42
CBD
10
1 40
2
5 9 13 17 21 25 29 33 41
3
4
5
6
26 302 38
1
1 39
37
1 2 3 4 5 6 7 8 9
28 29 30 31 32 33 34 35 36
34
3 7 11 15 19 23 27 34 35
2 6
5
10 14
4
18 223
6
20% 43% 80%
11
Density articulation
03 ROLE OF NMT IN
TOD
Daniels and Mulley 2011
Pedestrian access
13
5 min 10 min
Bicycle access
14
Adapted from Lee, Choi & Leem 2015
Lee, Choi & Leem 2015
Station Influence Area
15
30% 74%
04 BICYCLE-BASED
TOD
17
Bogota CicloRuta NMT network
18
Bicycle-based TOD
Adapted from Lee, Choi & Leem 2015
Cooke 2016
19
40% 78% 90%
Bicycle-based TOD
20% 43% 80%
Pedestrian-based TOD
TOD area 43% of corridor (assuming even density)
Cooke 2016
Bicycle-based TOD
20
Bicycle-based TOD
TOD area 78% of corridor (assuming even density)
1,000 km catchment 3,000 m catchment
33%
cost reduction
Cooke 2016
21
Bicycle-based TOD
Targeted Areas
SOUTH AFRICAN CITY / MUNICIPALITY
Cape Town Tshwane Joburg NMB eThekwini
(CoCT,
2012)
(CoT, 2012) (CoJ, 2010)
(NMB,
2007)
(eThekwini,
2013)
Public Transport Trunk
Corridors (persons/ha)
208 150 232 238 209
Bulman 2015
05 CONCLUSION
€ £
¥ $
Thank you
Sean Cooke
University of Cape Town
ckxsea001@myuct.ac.za

NMT infrastructure: bicycle based transit oriented development

Editor's Notes

  • #24 Thank you for your time, and welcome any questions you may have.