Download as PDF, PPTX

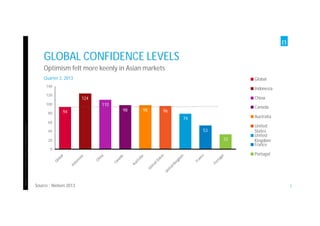
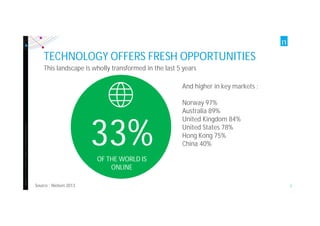
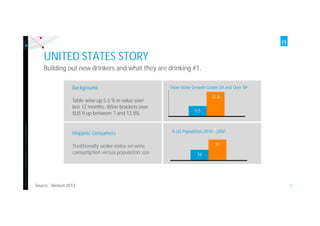
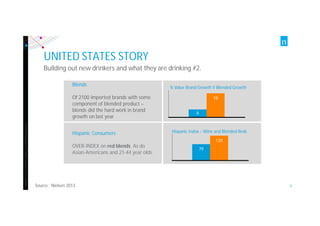
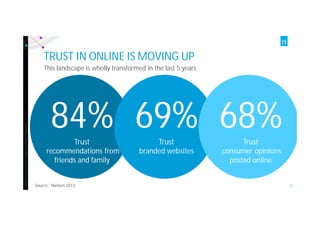

The document discusses global consumer trends, emphasizing the rapidly changing landscape driven by technology and online engagement. It highlights growth in wine consumption in the U.S., particularly among Hispanic consumers and younger demographics, alongside the importance of personal recommendations in consumer trust. Additionally, it points out opportunities for the wine industry backed by demographic shifts and urbanization in developing markets.


![How to sell wine online [REPORT]](https://cdn.slidesharecdn.com/ss_thumbnails/reporthow-to-sell-wine-online-130814055025-phpapp02-thumbnail.jpg?width=640&height=640&fit=bounds)


