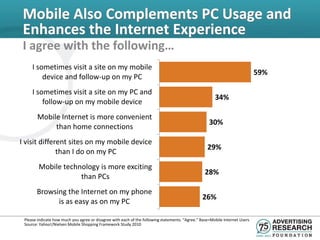
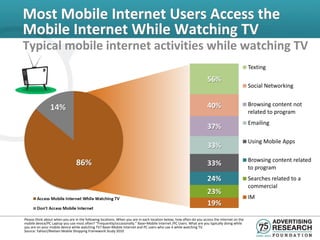
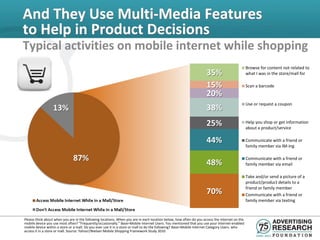
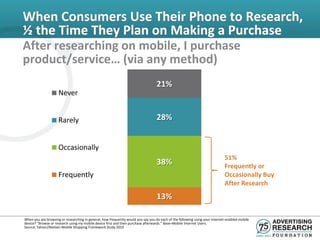
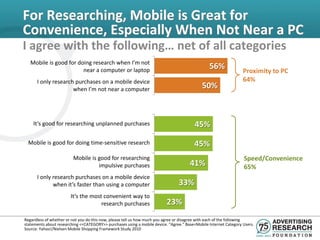
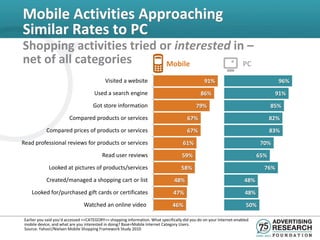
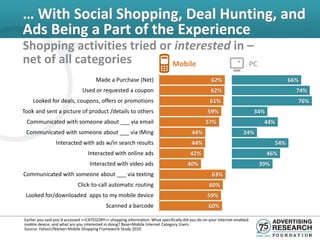
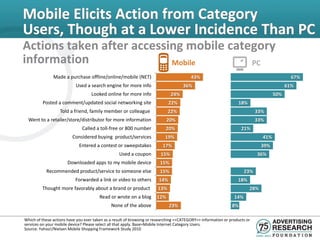
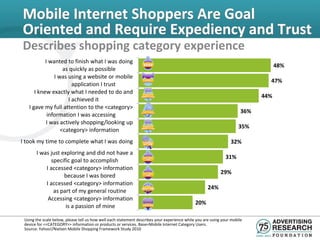
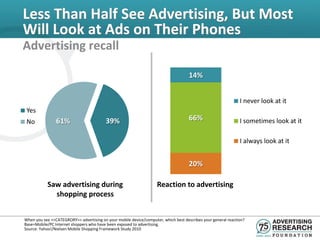
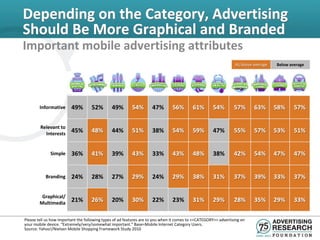
At the Advertising Research Foundation’s (ARF) 2011 annual re:think convention, a key issues forum presentation was held entitled SHOPPER INSIGHTS. Ashmeed Ali-Senior Manager at Yahoo! & David Gill-Vice President at The Nielsen Company discussed when Mobile Goes Shopping. This presentation explored how consumers use their mobiles to research products and advertising on mobile devices. Manila Austin-Director of Research at Communispace Corporation moderated the discussion.
Presentation by Maria Zhang for National Ski Areas Association Winter Conferences in Squaw and Killington, January & February 2012.
We’re in the middle of another massive technology revolution, bigger and faster than the Internet and PC revolutions of prior decades. This time, it’s mobile technology that is changing the way we consume, communicate, and buy. With 30% of the US population owning smartphones, and tablet sales skyrocketing, how do marketers adapt? Learn how to harness mobile trends to craft a smart and effective mobile strategy that drives measurable performance towards your goals and boosts your brand. We’ll cover planning, mobile marketing tools, emerging technologies, tracking performance, and keys to success for mobile marketing initiatives. Designed for exec, marketing, sales, and technical staff to incorporate actionable tips into current plans.
State Departments of Transportation: Social Media Usage in a BroadviewLloyd Brown
Understanding social media, first understand Internet usage. More and more, people access the Internet wirelessly through mobile devices. State DOTs are not only using social media, but changing how they use social media. Regardless, outreach plans still must have solid messaging, accountability and transparency.
LSS'11: Opening Keynote: Local Social 2011 – The Paradigm Shift Picks-up Spee...Local Social Summit
Opening Keynote: Local Social 2011 – The Paradigm Shift Picks-up Speed.
By Greg Sterling, Senior Analyst at Internet2Go/Opus Research, Principal at Sterling Market Intelligence, Contributing Editor at SEL. Greg starts with the The SoLoMo ‘Mandala’... Sacred image of the Social-Local-Mobile universe and a symbol of our collective search for beauty and wholeness in a world of chaos and disorder.
Key Themes:
- Hype-Local: Demand, Awareness Growing
- Mobile Momentum Continues
- Social Media, SMBs& the ‘Now What?’ Problem
- Local Data Tsunami
- Payments and Real-World Analytics
- From Clicks to Transactions
Associate Director for Research Kristen Purcell will share Pew Internet data on the rapid growth of mobile connectivity and social networking in the U.S., focusing on how information consumption patterns are changing in light of these two technological developments, at the annual Radiodays Europe conference in Barcelona, Spain.
How consumers use technology & its impact on their livesIOrangeDigital
Modern society thrives on technology, and the advancement of technology.
Technology connects the consumer to the world at any given time, and the demands, even expectancies of the consumer are ever increasing.
Join me as we take a more in depth approach to understanding the technological demands of the consumer and how it affects their lives.
I spoke about “Transparent Tech Trends of 2012” for the Indiana Library Federation’s Reference Division Conference (with its conference theme of Tech Trends in Libraries: Seeing the Forest for the Trees.) on August 7, 2012 at the Noblesville Branch of the Hamilton East Public Library in Indianapolis, Indiana.
Director Lee Rainie will provide a look at some of the most recent survey results obtained by the Pew Internet Project on mobile computing and the use of handheld devices.
eBuddy is web and mobile messaging for everyone, everywhere! eBuddy processes over 15 billion
messages per month and enables more than 33 million unique monthly visitors to chat in one
interface across all major IM networks including AIM, Facebook Chat, Google Talk, Hyves, ICQ,
MySpace, Windows Live Messenger and Yahoo! eBuddy is one of the world’s fastest growing mobile
IM applications with over 16 million unique monthly mobile users, and offers four, free mobile IM
versions: eBuddy for iPhone and iPod Touch, eBuddy for Android, eBuddy Mobile Messenger (J2ME)
and eBuddy Lite Messenger (mobile Web). The premium native application, eBuddy Pro for iPhone
and iPod Touch with additional exclusive features is for sale via iTunes. The eBuddy mobile
application uses a mobile Internet data connection over 3G, 2G or WiFi networks. eBuddy is the proud
winner of Mashable’s 2009 Open Web Awards for Best Mobile App.
The Evolution of Video Community (EOVC) is a cross-device behavior tracking program drawn from households across the nation. The passive data collection examines how Americans use services and devices to view video; movies, short-form content and TV shows (SVOD & OTT) and interact with providers of services or advertising.
The EOVC is driven by a multi-modal, passive data collection technology supported by ABS-based surveys and social media touch-points. The survey component gives Centris insight into household demographics, service providers and ownership of devices so the EOVC is as representative as possible.
Viviendo con Internet en América Latina - Microsoft AdvertisingWikonsumer Research
Fuente: Microsoft Advertising
Metodología: Basado en una encuesta realizada a un panel de opinión online, 6.054 encuestados de edades comprendidas entre 16-64 años respondieron preguntas sobre sus patrones de conducta web y sus preferencias de interacción online con las marcas.
El documento completo puede ser bajado de:
http://advertising.microsoft.com/latinoamerica/estudios/viviendo-con-internet
With smartphones becoming commonplace and new mobile devices such as tablets skyrocketing in popularity, the interest in mobile learning has begun to heat up as well. Many organizations see the promise of mobile learning, but actual implementations are still rare. Is now the time to take the plunge into mobile learning, or should you wait for a more stable mobile landscape to emerge?
In this presentation, you will:
• Learn the difference between mobility and portability when applied to learning activities.
• Explore the different devices suitable for different learning content types.
• Be provided a framework to begin thinking about the challenges and opportunities for mobile learning within your organization.
Networked Consumers: How networked and how important?Jim Jansen
The Professors Institute, a one and a half day conference for mid-Atlantic college and university professors of marketing and communications. It is hosted by the Direct Marketing Association of Washington Educational Foundation, a nonprofit foundation whose mission is to educate local professors on direct and interactive marketing so as to encourage students to enter the direct marketing industry.
Grace's articulation on Hyphen's early take into archiving and (at the same time) researching on the dioramas that Edhi Sunarso was commissioned during 1960s-2000s.
There are several speeches that intrigues me and somehow connect the things that I have been (and am currently) working on. These speeches are very powerful because these people are pretty certain of what they want (now). At the same time, these speeches are also very emotional because their future remains unknown and they know it. They are: President Sukarno's major address delivered before the 15th United Nations General Assembly (Friday, September 30, 1960); Lana Wachowski’s acceptance speech for Human Right Campaign Visibility Award (Saturday, October 20, 2012); Prof. Alice Howland’s speech as an earlyonset alzheimer from the film Still Alice (2014).
Global market trends, understanding how consumers' lives are changing: Michae...Ben Moroney
Michael Walton, Executive Director Consumer and Business Intelligence, Nielsen Pacific presented on global consumer trends including insights and data demonstrating how consumers’ lives are changing and the impact this will have on wine as a category. Michael explored trends including premiumisation, the impact of social media and how consumers choose wines to purchase.
Maximizing Profits through Shopper Insights in Convenience (CSFA Presentation)Robin Brown
A presentation given to the Canadian Snack Food Association on Shopper Insights from Convenience Shopper Canada - Canada's only ongoing study of shopper behaviour in convenience channels
Influence of word of mouth communication towards indonesian online shopper pu...Eka Yuliana
Word-of-mouth (WOM) gives the consumer perceptions to engage in retail online shopping can include both utilitarian and hedonic shopping dimensions. To cater to these consumers, online retailers can create a cognitively and esthetically rich shopping environment, through sophisticated levels of communication, as the personal influence, online community, and also by sharing they experience. Since the effect of Word-of-mouth communications on marketing and has proven to stimulate online consumer’s perceptions, 374 person of House of Taaj Facebook users in all over Indonesia, in which 280 female (75%) and 94 male (25%) has expressed their perceptions toward online purchase intention, and Word-of-mouth. This research presumes that Word-of-mouth from another online consumers, share information and features can influence online shopping intention and entice them to modify or even transform their original shopping predispositions by providing them with attractive and enhanced interactive features and controls of buying. To achieve the research objectives and the test hypotheses, factor analysis, and linear regression are used to analyze the significant level of each variable indicator of this study.
The result of the test may conclude that the Facebook users perceived more intention to search information by online, caused of the effectiveness of time using online community to search information and review the other experience. A more positive online shopping experience led to consumers’ positive perceptions for online purchase intention. Thus, this study may conclude that indicator variable of perception that really influence the Facebook users online purchase intentions are their perception towards the effectiveness of time that they can be used to evaluate, and find information by online, and the best indicator is their online community that can deliver and influence Facebookers online purchase intention.
2017 Consumer Products Industry Outlook by DELOITTEthierry jolaine
2017 Consumer Products Industry Outlook
Our latest consumer products industry overview provides a closer look at the trends that are disrupting the industry and changing the way they go to market.
MRCB 2013 Instituto de Empresa Data Visualization 5 Slides ExerciseADICT Active Retail
Good tips to remember when building a great presentation related to market reseach. This document includes the students' compilation from the 1st edition of MRCB (Market Research Consumer Behaviour) Master at IE (Instituto de Empresa - Madrid, Spain). The exercise consisted in creating a 5 slides presentation with the same set of data for all the students.
You'll find everything you need to know here, from the latest technology and best practice, to surprising statistics.
Mobile marketing is big news for B2B. We've all got around-the-clock internet access at our fingertips now. We can check emails, browse websites and book meetings - at work, at home or on the move. Consequently, PC is no longer the principal business tool. Indeed 70% of today's under-40s consider mobile their primary communication tool. What's more, mobile internet access has overtaken desktop internet access.
Baidu - Explore The Mobile World in Indonesia - 2014Baidu Indonesia
Baidu releases a report based on the results of the company exploration on the mobile world trends in Indonesia. The exploration result was obtained from the surveys and interviews conducted by the company since 2 September to 31 October 2014. This activity aims to gain insights into the current situation and trends in Indonesian mobile market, as well as to gain in-depth description of the mobile phone users in Indonesia.
This report (in Indonesian) is also available in HTML5 version: http://goo.gl/HAIY2K
This presentation looks at the growing popularity of mobile phones and their impact on marketing. It looks at the increased emergence of applications across platforms, the merging of social and mobile, the bridging of offline and online worlds via mobile devices, mobile marketing case studies and some tips on getting started with mobile marketing.
With Internet usage shifting from desktop to mobile, Yahoo needed to get ahead of this trend, understand who was driving it, why, how fast it was occurring, and what advice to give digital marketers as a result. To answer these questions, Vital Findings used in-depth interviews, device tracking, and quantitative research in the US, UK, France, and Germany. Presented at THINK LA, INTERACT, the Razorfish Global Tech Summit, and showcased on Yahoo’s online advertiser resource center globally.
Find your niche in the mobile market with a model that clarifies the relationship between your business objective, new technologies, and the audience you wish to reach.
After iterating on our own mobile concepts with lackluster results, we committed to gaining a realistic understanding of consumer behavior. Our studies included field tests, prototyping, lots of reading, and interviews with both in-aisle smart phone users and the corporate businesspeople trying to influence them.
We are pleased to share our findings and recommend a practical approach to mobile strategy. Bring your ideas and learn how your app, mobile website, or other endeavor fits into the mobile equation.
Insights from Coalition for Innovative Media Measurement (CIMM) were presented at Advertising Research Foundation’s (ARF) AM 6.0 conference, held in 2011. Through the use of eDiaries and the example of moms, a presentation was given on the value of USA touchpoints to increase ROI. Presenters included Jane Clarke-Managing Director of Coalition for Innovative Media Measurement & Jim Spaeth-Partner at Media Behavior Institute.
As part of the emerging new topics series, a presentation entitled UX: The User Experience Cross-Screen, was given at the Advertising Research Foundation’s (ARF) AM 6.0 conference held in 2011. A research study including questions, methods, and findings on cross-screen users was presented. The presentation was given by, Richard Zackon-Facilitator for Council for Research Excellence & Rick Ducey- Chief Strategy Officer at BIA/Kelsey.
A presentation on new ad models, was given at the Advertising Research Foundation’s (ARF) AM 6.0 conference held in 2011. Dr. Duane Varan-Executive Director at Audience Research Labs Murdoch University gave the presentation. Varan presented studies done by the Beyond 30 research program.
At the Advertising Research Foundation’s (ARF) AM 6.0 conference held in 2011, a Keynote presentation was given entitled Meeting the Challenges of Cross Media Research. Google presented three initiatives and how they are trying to help meet the challenges of cross media research. Keynote presenters from Google were Owen Charlebois-Global Manager, Advertising, Marketing and Media Research & ElissaLee, Ph.D.-Group Manager,Quantitative Measurement.
A presentation entitled Impact of Online and Television Advertising on Consumer Behavior, was given at the Advertising Research Foundation’s (ARF) AM 6.0 conference held in 2011. The presentation includes, the challenges to measuring cross-platform media impacts, comscore methods, case studies and results. Presenters included Joan FitzGerald-Vice President of comScore & Alan Vaughn- Statistical Analyst at comScore.
A presentation entitled Following the Sports Fan with Arbitron’s PPM, was given at the Advertising Research Foundation’s (ARF) AM 6.0 conference held in 2011. A study using Arbitron Portable People Meter™ (PPM™) service was presented. The presentation was given by Glenn Enoch- VP, Integrated Media Research at ESPN Inc., Kelly Johnson- Director, Media and Promotion Research at ESPN Inc., & Lung Huang- VP, National Account Services at Arbitron Inc.
A presentation entitled BrandLife – Showing the Client What to Do Visually and What to Avoid was given at the Advertising Research Foundation’s (ARF) AM 6.0 conference held in 2011. The Interpretation of visual Semiotic “Answers” is presented. The presentation is given by Steve Wolf- Commercial Director, Global Qualitative & SVP/Division Director at Synovate Qualitative.
At the Advertising Research Foundation’s (ARF) AM 6.0 conference held in 2011, a presentation was given on Facebook’s information platform. The job of research team at Facebook along with the topic of making research interesting to users is discussed. The presentation is given by Brad Smallwood-Head of Measurement and Insights at Facebook
A presentation entitled The Television Audience Redefined: An Update, was given at the Advertising Research Foundation’s (ARF) AM 6.0 conference held in 2011. Insights into the profiles of various consumers across a variety of media platforms, was presented. The presentation was given by David Poltrack-Chief Research Officer of CBS Corporation & President of CBS Vision.
A presentation entitled Measuring the Moving Screen: The Future of Tablet Measurement, was given at the Advertising Research Foundation’s (ARF) AM 6.0 conference held in 2011. A presentation was given on the profile tablet users as well as the findings regarding ad effectiveness on iPads vs iPhones and other devices. The presentation was given by Matt O’Grady- EVP, Media Audience Measurement at The Nielsen Company.
A presentation entitled MAXIMIZING MOMENTUM: Insights from Verizon, SMG & Cisco, was given at the Advertising Research Foundation’s (ARF) AM 6.0 conference. Insights on Brand building were presented. Presenters included Patrick McLean-Executive Director at Verizon Interactive, Helen Katz-SVP/Research Director at Starcom MediaVest Group, & Charlie Treadwell-Marketing Strategy Manager Corporate Affairs Marketing at Cisco.
A presentation entitled Integrated Social Media: Business Impact Study 2011, was given at the Advertising Research Foundation’s (ARF) AM 6.0 conference. The presentation explores the impact that social media has on sales. Presenters included Irfan Kamal- SVP, Digital/Social at Ogilvy & Dr. Walter Carl- Founder and Chief Research Officer at ChatThreads.
A presentation entitled Global Perspectives on Measurement Issues, was given at the Advertising Research Foundation’s (ARF) AM 6.0 conference held in 2011. Presenters included Horst Stipp-EVP, Global Business Strategy at the Advertising Research Foundation & LuizG. Duarte, Ph.D.-Corporate Research at DIRECTV Latin America.
A presentation entitled Insights for the Future of Online Video Commercialization given at the Advertising Research Foundation’s (ARF) AM 6.0 conference held in 2011. Test on online commercial viewing done by TBS was presented. The presentation included the research design and methods used as well as the findings. The presentation was given by Stacey Lynn Schulman-SVP, Ad Sales & Sports Research at Turner Broadcasting Sales, Inc.
At the Advertising Research Foundation’s (ARF) 2011 annual re:think convention, a key issues forum presentation was held entitled New Shopper Journeys: The Influence of Digital Touchpoints. The presentation explores how digital has an effect on shopper’s behaviors. Presentation is given by Alex Charlton- Director at essential research, Mike Hess- EVP of Research at Carat N.A., & Beth Uyenco- Global Research Director at Microsoft.
At the Advertising Research Foundation’s (ARF) 2011 annual re:think convention, a key issues forum presentation was held entitled Supercharging the Path to Purchase: Using Word-of-Mouth to Drive More Consumers to Buy. The presentation looks at the effects of Word of Mouth advertising as it relates to female consumers. Presenters include Ed Keller-CEO of Keller Fay Group & Tony Cardinale-EVP, Brand Planning & Strategic Insights at NBC Universal.
At the Advertising Research Foundation’s (ARF) 2011 annual re:think convention, a key issues forum presentation was held entitled The Power of Relevancy The Biometric Impact of Online Advertising. The presentation includes topics such as measuring the biological impact, and the contextual and personal relevancy of ads. The presenters include Tony Marlow-Strategic Insights at YAHOO! & Brian Levine-President of Innerscope Research.
At the Advertising Research Foundation’s (ARF) 2011 annual re:think convention, a key issues forum presentation was held entitled Understanding the Relationship Between Social Media and TV Viewership. The presentation used a case study on the World cup to present findings. Presenters included, Jon Gibs-SVP at The Nielsen Company & David Coletti-VP at ESPN.
At the Advertising Research Foundation’s (ARF) 2011 annual re:think convention, a key issues forum presentation was held entitled Study of the Key Drivers of Online Content Consumption. An AOL sponsored study to better understand content usage was presented. Presenters included, Kristin Kovner- Senior Marketing Director at AOL, Bill Ziff-Levine-Principal & Co-Founder Data & Management at Counsel, Inc., & Jon Stewart- Research Director at Nielsen.
More from The Advertising Research Foundation (20)
3.0 Project 2_ Developing My Brand Identity Kit.pptxtanyjahb
A personal brand exploration presentation summarizes an individual's unique qualities and goals, covering strengths, values, passions, and target audience. It helps individuals understand what makes them stand out, their desired image, and how they aim to achieve it.
Premium MEAN Stack Development Solutions for Modern BusinessesSynapseIndia
Stay ahead of the curve with our premium MEAN Stack Development Solutions. Our expert developers utilize MongoDB, Express.js, AngularJS, and Node.js to create modern and responsive web applications. Trust us for cutting-edge solutions that drive your business growth and success.
Know more: https://www.synapseindia.com/technology/mean-stack-development-company.html
Cracking the Workplace Discipline Code Main.pptxWorkforce Group
Cultivating and maintaining discipline within teams is a critical differentiator for successful organisations.
Forward-thinking leaders and business managers understand the impact that discipline has on organisational success. A disciplined workforce operates with clarity, focus, and a shared understanding of expectations, ultimately driving better results, optimising productivity, and facilitating seamless collaboration.
Although discipline is not a one-size-fits-all approach, it can help create a work environment that encourages personal growth and accountability rather than solely relying on punitive measures.
In this deck, you will learn the significance of workplace discipline for organisational success. You’ll also learn
• Four (4) workplace discipline methods you should consider
• The best and most practical approach to implementing workplace discipline.
• Three (3) key tips to maintain a disciplined workplace.
Business Valuation Principles for EntrepreneursBen Wann
This insightful presentation is designed to equip entrepreneurs with the essential knowledge and tools needed to accurately value their businesses. Understanding business valuation is crucial for making informed decisions, whether you're seeking investment, planning to sell, or simply want to gauge your company's worth.
Implicitly or explicitly all competing businesses employ a strategy to select a mix
of marketing resources. Formulating such competitive strategies fundamentally
involves recognizing relationships between elements of the marketing mix (e.g.,
price and product quality), as well as assessing competitive and market conditions
(i.e., industry structure in the language of economics).
Recruiting in the Digital Age: A Social Media MasterclassLuanWise
In this masterclass, presented at the Global HR Summit on 5th June 2024, Luan Wise explored the essential features of social media platforms that support talent acquisition, including LinkedIn, Facebook, Instagram, X (formerly Twitter) and TikTok.
Event Report - SAP Sapphire 2024 Orlando - lots of innovation and old challengesHolger Mueller
Holger Mueller of Constellation Research shares his key takeaways from SAP's Sapphire confernece, held in Orlando, June 3rd till 5th 2024, in the Orange Convention Center.
Putting the SPARK into Virtual Training.pptxCynthia Clay
This 60-minute webinar, sponsored by Adobe, was delivered for the Training Mag Network. It explored the five elements of SPARK: Storytelling, Purpose, Action, Relationships, and Kudos. Knowing how to tell a well-structured story is key to building long-term memory. Stating a clear purpose that doesn't take away from the discovery learning process is critical. Ensuring that people move from theory to practical application is imperative. Creating strong social learning is the key to commitment and engagement. Validating and affirming participants' comments is the way to create a positive learning environment.
B2B payments are rapidly changing. Find out the 5 key questions you need to be asking yourself to be sure you are mastering B2B payments today. Learn more at www.BlueSnap.com.
1. SHOPPER INSIGHTS
Moderator
Manila Austin
Director of Research
Communispace Corporation
2.
3. Mobile Goes Shopping
With Yahoo! and Nielsen
Ashmeed Ali David Gill
Senior Manager Vice President
Yahoo! The Nielsen Company
4. Background
With the increased adoption of smartphones, faster network speed
and convenience factor, mobile presents a tremendous opportunity
for marketers to reach a captive, commerce-oriented audience while
they are shopping. Yahoo! commissioned a study with Nielsen to
create a framework around mobile Internet shopping behaviors to
better understand:
• Mobile Usage & Consumption Basics
• Mobile Shopping Penetration & Activities
• Mobile Impact on Purchases
• Mobile Advertising
Source: Yahoo!/Nielsen Mobile Shopping Framework Study 2010
5. Methodology
WHO 8,384 respondents ages 13-64
5,313 were Mobile Internet Category Users:
• Own a mobile device with access the Internet
• Access information related to at least one of 12 product categories
3,071 were PC Internet Category Users:
• Own a desktop/laptop/tablet PC with Internet access
• Access information related to at least one of 12 product categories
• PC Internet shoppers could not access any category information on a
mobile device but could still own a mobile phone
FOOD/
DIG CON ENT DINE C ELEC FIN TRAV APPARL HEALTH BEAUTY HOME AUTO
BEV
Mobile Base 937 678 663 451 570 370 370 272 282 283 227 210
PC Base NA 454 320 313 293 224 258 264 251 234 223 237
HOW 25-minute-online-survey
WHEN June 2010
Source: Yahoo!/Nielsen Mobile Shopping Framework Study 2010
6. We Asked Mobile Internet Users About
the Categories They Use…
• Automobiles or automobile parts or • Packaged food and beverage
accessories (such as repair (such as groceries, snack
info/tips, tires, tools, wheels, engines etc.) items, recipes, cooking tips, etc.)
• Beauty and personal care • Healthcare or medical related
(such as shampoo, make- (such as
up, perfume, grooming, beauty tips, etc.) services, remedies, medication, healthy
eating, etc.)
• Clothing apparel and fashion
accessories (such as style • Personal or vacation travel (such as airline
tips, jeans, shirts, outerwear, kids tickets, hotels, car rentals, etc.)
clothing, jewelry, footwear, sizing info etc.)
• Restaurants/Dining (such as casual, fast
• Consumer electronics and technology (such food, bakery/café’s, fine dining or local
as cell phones, digital restaurants in your area)
cameras, computers, gaming
consoles, GPS, etc.) • Home improvement
(such as tips, designing-
• Entertainment items and content (such as related, furnishings, accessories, repair
DVDs, games, music, concert/movie items, indoor/ outdoor, garden, etc.)
tickets, TV shows/clips, etc.)
• Digital content for my mobile phone
• Financial services (such as banking, paying (ringtones, apps, music)
bills, financial calculators etc.)
Source: Yahoo!/Nielsen Mobile Shopping Framework Study 2010
8. Mobile is Critical in Daily Life
I agree with the following…
My cell phone is critical in my daily life 68%
I can browse the Internet whenever
66%
I want thanks to my mobile device
I browse the Internet more often
46%
because I can use my mobile device
Please indicate how much you agree or disagree with each of the following statements. “Agree.” Base=Mobile Internet Users
Source: Yahoo!/Nielsen Mobile Shopping Framework Study 2010
9. Mobile Also Complements PC Usage and
Enhances the Internet Experience
I agree with the following…
I sometimes visit a site on my mobile
59%
device and follow-up on my PC
I sometimes visit a site on my PC and
34%
follow-up on my mobile device
Mobile Internet is more convenient
30%
than home connections
I visit different sites on my mobile device
29%
than I do on my PC
Mobile technology is more exciting
28%
than PCs
Browsing the Internet on my phone
26%
is as easy as on my PC
Please indicate how much you agree or disagree with each of the following statements. “Agree.” Base=Mobile Internet Users
Source: Yahoo!/Nielsen Mobile Shopping Framework Study 2010
10. Most Mobile Internet Users Access the
Mobile Internet While Watching TV
Typical mobile internet activities while watching TV
Texting
56%
Social Networking
40% Browsing content not
related to program
Emailing
37%
Using Mobile Apps
33%
Browsing content related
33% to program
24% Searches related to a
commercial
23%
IM
19%
Please think about when you are in the following locations. When you are in each location below, how often do you access the Internet on the
mobile device/PC Laptop you use most often? “Frequently/occasionally.” Base=Mobile Internet /PC Users. What are you typically doing while
you are on your mobile device while watching TV? Base=Mobile Internet and PC users who use it while watching TV.
Source: Yahoo!/Nielsen Mobile Shopping Framework Study 2010
11. And They Use Multi-Media Features
to Help in Product Decisions
Typical activities on mobile internet while shopping
Browse for content not related to
35% what I was in the store/mall for
15% Scan a barcode
20%
Use or request a coupon
38%
25% Help you shop or get information
about a product/service
44% Communicate with a friend or
family member via IM-ing
Communicate with a friend or
48% family member via email
Take and/or send a picture of a
product/product details to a
friend or family member
70% Communicate with a friend or
family member via texting
Please think about when you are in the following locations. When you are in each location below, how often do you access the Internet on the
mobile device you use most often? “Frequently/occasionally.” Base=Mobile Internet Users. You mentioned that you use your Internet-enabled
mobile device within a store or a mall. Do you ever use it in a store or mall to do the following? Base=Mobile Internet Category Users. who
access it in a store or mall. Source: Yahoo!/Nielsen Mobile Shopping Framework Study 2010
12. When Consumers Use Their Phone to Research,
½ the Time They Plan on Making a Purchase
After researching on mobile, I purchase
product/service… (via any method)
21%
Never
Rarely 28%
Occasionally
51%
38% Frequently or
Frequently Occasionally Buy
After Research
13%
When you are browsing or researching in general, how frequently would you say you do each of the following using your Internet-enabled mobile
device? “Browse or research using my mobile device first and then purchase afterwards.” Base=Mobile Internet Users.
Source: Yahoo!/Nielsen Mobile Shopping Framework Study 2010
14. Although Mobile Shopping Research is
Nascent, the Scale and Potential are Large
Sizing the category & interest
Source: Yahoo!/Nielsen Mobile Shopping Framework Study 2010
15. Currently, the PC Experience Still Offers a
Better Experience Through the Funnel…
Current mobile & PC purchase funnel usefulness –
net of all categories
51%
To hear about or discover a product and service
35%
78%
To help me learn more
45%
74%
To help me narrow down the selection PC
43% Mobile
71%
To help me make a final decision
42%
62%
To keep up-to-date on news or deals
44%
How useful is using your mobile device/PC to help you with each of the following aspects of your browsing or research
process for <<CATEGORY>>? “Extremely/very helpful” summary. Base=Mobile/PC Internet shoppers.
Source: Yahoo!/Nielsen Mobile Shopping Framework Study 2010
16. …With Great Opportunities and Strides
Needed in Higher Incidence Categories
Current mobile purchase funnel usefulness –
net of all categories At/above average Below average
To hear about or
discover a product 34% 34% 32% 37% 26% 31% 38% 45% 36% 41% 40% 38%
and service
To help me learn
more
39% 44% 43% 52% 36% 44% 47% 53% 50% 50% 49% 54%
To help me narrow
down the selection
35% 40% 46% 47% 32% 43% 46% 45% 55% 52% 52% 43%
To help me make a
final decision
38% 38% 41% 46% 29% 43% 48% 48% 46% 47% 45% 49%
To keep up-to-date
on news or deals
41% 42% 36% 47% 40% 44% 48% 52% 48% 49% 48% 47%
How useful is using the Internet or applications on your mobile device to help you with each of the following aspects of
your browsing or research process for <<CATEGORY>>? Base=Mobile Internet Category Users.
Source: Yahoo!/Nielsen Mobile Shopping Framework Study 2010
17. Categories That Have Lower Incidence Also
Have the Greatest Ramp for Future Growth
Stated future use of mobile in the purchase funnel
(more or about the same as PC) At/above average Below average
To hear about or
discover a product 46% 48% 45% 50% 47% 46% 40% 48% 53% 53% 50% 55%
and service
To help me learn
more
47% 48% 45% 52% 49% 46% 46% 47% 54% 56% 53% 57%
To help me narrow
down the selection
47% 49% 47% 51% 52% 49% 49% 51% 55% 56% 59% 61%
To help me make a
final decision
48% 49% 47% 48% 50% 47% 52% 51% 55% 57% 56% 57%
To keep up-to-date
on news or deals
52% 52% 51% 57% 54% 53% 55% 58% 62% 61% 61% 66%
Over the next 12 months, which will you be using more to do each of the following for <<CATEGORY>>
information/products/ services, a computer or an internet-enabled mobile device? Base=Mobile Internet Category Users.
Source: Yahoo!/Nielsen Mobile Shopping Framework Study 2010
18. For Researching, Mobile is Great for
Convenience, Especially When Not Near a PC
I agree with the following… net of all categories
Mobile is good for doing research when I’m not
near a computer or laptop
56% Proximity to PC
I only research purchases on a mobile device 64%
when I’m not near a computer 50%
It’s good for researching unplanned purchases 45%
Mobile is good for doing time-sensitive research 45%
Mobile is good for researching Speed/Convenience
impulsive purchases 41% 65%
I only research purchases on a mobile device
when it’s faster than using a computer 33%
It’s the most convenient way to
research purchases 23%
Regardless of whether or not you do this now, please tell us how much you agree or disagree with each of the following
statements about researching <<CATEGORY>> purchases using a mobile device. “Agree.” Base=Mobile Internet Category Users.
Source: Yahoo!/Nielsen Mobile Shopping Framework Study 2010
20. Mobile Activities Approaching
Similar Rates to PC
Shopping activities tried or interested in –
net of all categories Mobile PC
Visited a website 91% 96%
Used a search engine 86% 91%
Got store information 79% 85%
Compared products or services 67% 82%
Compared prices of products or services 67% 83%
Read professional reviews for products or services 61% 70%
Read user reviews 59% 65%
Looked at pictures of products/services 58% 76%
Created/managed a shopping cart or list 48% 48%
Looked for/purchased gift cards or certificates 47% 48%
Watched an online video 46% 50%
Earlier you said you’d accessed <<CATEGORY>> shopping information. What specifically did you do on your Internet-enabled
mobile device, and what are you interested in doing? Base=Mobile Internet Category Users.
Source: Yahoo!/Nielsen Mobile Shopping Framework Study 2010
21. … With Social Shopping, Deal Hunting, and
Ads Being a Part of the Experience
Shopping activities tried or interested in –
net of all categories Mobile PC
Made a Purchase (Net) 62% 66%
Used or requested a coupon 62% 74%
Looked for deals, coupons, offers or promotions 61% 76%
Took and sent a picture of product /details to others 59% 34%
Communicated with someone about ___ via email 57% 44%
Communicated with someone about ___ via IMing 44% 24%
Interacted with ads w/in search results 44% 54%
Interacted with online ads 42% 46%
Interacted with video ads 40% 39%
Communicated with someone about ___ via texting 63%
Click-to-call automatic routing 60%
Looked for/downloaded apps to my mobile device 59%
Scanned a barcode 60%
Earlier you said you’d accessed <<CATEGORY>> shopping information. What specifically did you do on your Internet-enabled
mobile device, and what are you interested in doing? Base=Mobile Internet Category Users.
Source: Yahoo!/Nielsen Mobile Shopping Framework Study 2010
22. Let’s take a look at some
of the category specific
shopping activities
23.
24. Mobile Elicits Action from Category
Users, Though at a Lower Incidence Than PC
Actions taken after accessing mobile category
information Mobile PC
Made a purchase offline/online/mobile (NET) 43% 67%
Used a search engine for more info 36% 61%
Looked online for more info 24% 50%
Posted a comment/updated social networking site 22% 18%
Told a friend, family member or colleague 22% 33%
Went to a retailer/store/distributor for more information 20% 33%
Called a toll-free or 800 number 20% 21%
Considered buying product/services 19% 41%
Entered a contest or sweepstakes 17% 39%
Used a coupon 15% 36%
Downloaded apps to my mobile device 15%
Recommended product/service to someone else 15% 23%
Forwarded a link or video to others 14% 18%
Thought more favorably about a brand or product 13% 28%
Read or wrote on a blog 12% 14%
None of the above 23% 8%
Which of these actions have you ever taken as a result of browsing or researching <<CATEGORY>> information or products or
services on your mobile device? Please select all that apply. Base=Mobile Internet Category Users.
Source: Yahoo!/Nielsen Mobile Shopping Framework Study 2010
26. Consumers Understand That Experiences
Aren’t Free But Have Ad Expectations
I strongly agree/agree with mobile advertising…
I’m ok with advertising if it means
46%
that I can access content for free
After I see an ad, I sometimes look
30%
for more information
Ads have become more interesting
29%
than they used to be
Ads are more helpful at finding
28%
geo-graphically relevant information
I am more likely to click on ads that
22%
incorporate multimedia elements
I am more likely to click on ads
22%
that are simple text ads
Regardless of whether or not you do this now, please tell us how much you agree or disagree with each of the following
statements about researching <<CATEGORY>> purchases using a mobile device. “Agree.” Base=Mobile Internet Category Users.
Source: Yahoo!/Nielsen Mobile Shopping Framework Study 2010
27. Mobile Internet Shoppers Are Goal
Oriented and Require Expediency and Trust
Describes shopping category experience
I wanted to finish what I was doing
48%
as quickly as possible
I was using a website or mobile
47%
application I trust
I knew exactly what I needed to do and
44%
I achieved it
I gave my full attention to the <category>
36%
information I was accessing
I was actively shopping/looking up
35%
<category> information
I took my time to complete what I was doing 32%
I was just exploring and did not have a
31%
specific goal to accomplish
I accessed <category> information
29%
because I was bored
I accessed <category> information
24%
as part of my general routine
Accessing <category> information
20%
is a passion of mine
Using the scale below, please tell us how well each statement describes your experience while you are using your mobile
device for <<CATEGORY>> information or products or services. Base=Mobile Internet Category Users.
Source: Yahoo!/Nielsen Mobile Shopping Framework Study 2010
28. Less Than Half See Advertising, But Most
Will Look at Ads on Their Phones
Advertising recall
14%
I never look at it
Yes
No 61% 39% 66% I sometimes look at it
I always look at it
20%
Saw advertising during Reaction to advertising
shopping process
When you see <<CATEGRORY>> advertising on your mobile device/computer, which best describes your general reaction?
Base=Mobile/PC Internet shoppers who have been exposed to advertising.
Source: Yahoo!/Nielsen Mobile Shopping Framework Study 2010
29. Depending on the Category, Advertising
Should Be More Graphical and Branded
Important mobile advertising attributes
At/above average Below average
Informative 49% 52% 49% 54% 47% 56% 61% 54% 57% 63% 58% 57%
Relevant to
Interests
45% 48% 44% 51% 38% 54% 59% 47% 55% 57% 53% 51%
Simple 36% 41% 39% 43% 33% 43% 48% 38% 42% 54% 47% 47%
Branding 24% 28% 27% 29% 24% 29% 38% 31% 37% 39% 33% 37%
Graphical/
Multimedia
21% 26% 20% 30% 22% 23% 31% 29% 28% 35% 29% 33%
Please tell us how important the following types of ad features are to you when it comes to <<CATEGORY>> advertising on
your mobile device. “Extremely/very/somewhat important.” Base=Mobile Internet Category Users.
Source: Yahoo!/Nielsen Mobile Shopping Framework Study 2010
30. Mobile Ads Needs to Keep Location and
Geography in Context Across Categories
Mobile location based-advertising
77% 78% 76%
75%
69% 71%
68% 67% 67%
65% 64%
62%
35% 35% 34% 34%
32%
27% 27% 27% 28%
23% 26%
20%
Mobile ads relevant to my current location (% Important)
Mobile ads are helpful at finding geo-graphically relevant information (% Agree)
Using the scale below, please tell us how well each statement describes your experience while you are using your mobile device for <<CATEGORY>>
information or products or services.
Please tell us how important the following types of ad features are to you when it comes to <<CATEGORY>> advertising on your mobile device.
“Extremely/very/somewhat important.” Base=Mobile Internet Category Users.
31. What it Means for Advertisers
• Although mobile shopping research is still nascent, a significant
number of mobile Internet users are accessing the Internet in-
store, often to search for shopping information. By targeting mobile
ads to these engaged users, marketers can reach a receptive
audience at the time of purchase, or while conducting research for a
future buy
• With the growth of mobile shopping research, marketers need to
ensure that their mobile websites are informative and easy to find
and navigate on mobile devices
• There is also a compelling opportunity to integrate mobile ads with
TV and Internet campaigns as mobile is a complementary medium
• Tailor your mobile ads to deliver the information that mobile
shoppers are looking for. Consumers want mobile ads to include
price, product features, and benefits
Source: Yahoo!/Nielsen Mobile Shopping Framework Study 2010
34. Mobile internet users skew younger, non-
white, higher income & educated, urban and
suburban and are less likely to own a PC
Mobile Internet PC Mobile Internet PC
User Internet User User Internet User
Male 51% 47% RIM BlackBerry 25% 16%
Female 49% 53% Apple/iPhone 22% 2%
13-24 (Net) 28% 20% Samsung 14% 24%
25-34 (Net) 27% 19% LG 9% 23%
35-44 (Net) 21% 19% Motorola 9% 15%
HTC 7% 4%
45-54 (Net) 15% 23%
55-64 (Net) 9% 19%
AT&T 34% 22%
MEAN AGE 34.52 39.71
Verizon Wireless 25% 33%
Sprint/Nextel (Net) 17% 19%
White 76% 82% T-Mobile 12% 9%
Yes, of Hispanic origin 13% 7%
Black or African-Am 11% 9% DEVICE OWNERSHIP:
PC/Laptop computer 79% 100%
Average Income Smart/Feature Phone (Net) 94% 49%
78.09K 55.37K
(Thousands) Smartphone/PDA 64% 10%
Advanced features 43% 40%
Yes, Children 42% 33% MP3/portable media player 61% 48%
Handheld gaming device 32% 21%
Urban 30% 23% Basic mobile phone 15% 45%
Suburban 55% 49% Tablet PC 6% 1%
Rural 15% 28%
College or more 51% 39%
Some college 30% 35%
High school 12% 17%
Source: Yahoo!/Nielsen Mobile Shopping Framework Study 2010
35
35. 9 in 10 have accessed the mobile web
at a store
Access Internet while at a store at the mall
15%
29%
Never 23%
Rarely 23%
Occasionally
41%
Frequently
38%
21%
10%
At a store At a mall
Please think about when you are in the following locations. When you are in each location below, how often do you access the Internet on the mobile
device you use most often? “Frequently/occasionally.” Base=Mobile Internet Users.
You mentioned that you use your Internet-enabled mobile device within a store or a mall. Do you ever use it in a store or mall to do the following?
Base=Mobile Internet Category Users. who access it in a store or mall. 36
Source: Yahoo!/Nielsen Mobile Shopping Framework Study 2010
36. In-store usage is about communication
and product information
Mobile activities while at a store or mall
Communicate with a friend or family member via texting 70%
Take and/or send a picture of a product/product details to a
48%
friend or family member
Communicate with a friend or family member via email 44%
Communicate with a friend or family member via IM-ing 25%
Help you shop or get information about a product/service 38%
Shopping Activities
Use or request a coupon 20% 49% (NET)
Scan a barcode 15%
Browse for content not related to what I was in the store/mall for 35%
Play a game 24%
You mentioned that you use your Internet-enabled mobile device within a store or a mall. Do you ever use it in a store or
mall to do the following? Base=Mobile Internet Category Users. who access it in a store or mall.
Source: Yahoo!/Nielsen Mobile Shopping Framework Study 2010
37
37. The majority of mobile users access mobile
Internet while watching TV
Access Internet while watching TV
13% 7%
16% 22%
Never 20%
36%
Rarely
Occasionally
Frequently
51%
35%
Mobile PC or Laptop
Please think about when you are in the following locations. When you are in each location below, how often do you access the
Internet on the mobile device/PC Laptop you use most often? “Frequently/occasionally.” Base=Mobile Internet /PC Users.
Source: Yahoo!/Nielsen Mobile Shopping Framework Study 2010
38
38. 1 in 5 search for more information related
to the commercials they saw
Content they are browsing while watching TV
Mobile PC
Communicating with a friend or family member via
texting
56% NA
Updating/reading social networking sites 40% 53%
Browsing content on the internet not related to what
37% 70%
I’m watching
Communicating with friend/family member via email 33% 49%
Using mobile applications 33% NA
Browsing content on the internet related to what I’m
24% 28%
watching
Doing Internet searches/looking up information
23% 32%
related to a commercial that I saw
Communicating with friend/family member via IM 19% 22%
What are you typically doing while you are on your mobile device while watching TV?
Base=Mobile Internet and PC users who use it while watching TV.
Source: Yahoo!/Nielsen Mobile Shopping Framework Study 2010
39
39. Usage is high throughout the day – with peaks
starting after lunch
Mobile Internet Usage by Time of Day
Weekdays
Weekends
70% 69% 70%
65%
58% 71% 71%
66% 64%
43% 58% 40%
26% 23%
29%
17%
6 to 9am 9 to 12pm 12 to 4pm 4 to 6pm 6 to 8pm 8 to 11pm 11 to 1am 1 to 6am
What times of the day do you typically use the Internet or web-enabled Internet applications on your mobile device?
Base=Mobile Internet Users.
Source: Yahoo!/Nielsen Mobile Shopping Framework Study 2010
40
40. Usage is both in and out of home – with 2 in 5
using in the bathroom
Mobile Internet Usage Locations - Access Frequently/Occasionally
At a hotel 63%
46%
At work 66%
At a restaurant/café/bar 65%
58%
At a concert 29% Out 93%
29% • On the go 89%
In the car 66% • Retail 71%
49%
Outdoors 69%
67%
63%
At a mall 58%
At home 84%
36%
In my bedroom 68% Home 89%
75%
Watching TV 71%
41%
Please think about when you are in the following locations. When you are in each location below, how often do you access the
Internet on the mobile device you use most often? “Frequently/occasionally.” Base=Mobile Internet Users.
Source: Yahoo!/Nielsen Mobile Shopping Framework Study 2010
41
41. Search engines, social networking, and
general consumer portals are used most
Mobile Websites/Applications Visited & Used– Net of all Categories
Search engines (e.g., Google, Yahoo, Bing etc.) 74%
Social networking (e.g., MySpace, Facebook) 53%
General consumer portals (e.g, Yahoo!, AOL, MSN, etc.) 51%
General news (e.g., NY Times, CNN) 45%
Stores/retailers (e.g., Walmart or Sears) 44%
Online video (e.g., YouTube, Yahoo! Video) 44%
Online-only retailers (e.g., Amazon.com) 42%
Category retailer/stores 41%
Category brand or manufacturer sites 39%
Shopping comparison (e.g., Yahoo! Shopping, Google Checkout) 39%
Category reviews 35%
Category emails (e.g. sent daily, weekly, etc.) that I signed up for 33%
Online auction (e.g., Ebay) 32%
Coupon/discounts (e.g., couponcabin.com) 28%
Category discussion boards/blogs 26%
Weekly or Sunday circulars 23%
And which of the following online sources did you use or access on your mobile device when browsing consumer
electronics/technology information/products/services? Please tell us if it was via the internet using your browser or an application
installed on your mobile device. Base=Mobile Internet Category Users
Source: Yahoo!/Nielsen Mobile Shopping Framework Study 2010 42
42. 3 in 5 use Internet via PC to complement their
mobile category research
Other sources used when looking up category info – Net of all Categories
Mobile 100%
Internet using my PC/Laptop 59%
Family, friends, or colleagues 43%
TV 26%
Magazines 25%
In-store displays 21%
Newspapers 18%
Professional(s) 15%
Salespeople 14%
Informational brochures 13%
Radio 12%
Books 10%
800 or toll-free number 9%
What other sources besides using your mobile device did you typically use when browsing or researching <<CATEGORY>>
information/products/services? Select all that apply. Base=Mobile Internet Category Users.
Source: Yahoo!/Nielsen Mobile Shopping Framework Study 2010
43
43. Convenience drives mobile category
purchasing, so do impulse buys
Mobile purchase drivers - Net of all Categories
Mobile is good for making purchases when I’m
not near a computer or laptop 46% Proximity to a PC
I only make purchases on a mobile device 56%
when I’m not near a computer 42%
Mobile is good for making time-sensitive
purchases 41%
It’s good for making unplanned purchases 34%
Mobile is good for making impulsive purchases Speed/Convenience
32% 59%
I only make purchases on a mobile device
when it’s faster than using a computer 27%
It’s the most convenient way to make
purchases 21%
Regardless of whether or not you do this now, please tell us how much you agree or disagree with each of the following
statements about making <<CATEGORY>> purchases using a mobile device. “Agree.”
Base=Mobile Internet Category Users.
Source: Yahoo!/Nielsen Mobile Shopping Framework Study 2010
44
44. Travel & auto have the longest average mobile
research sessions, while dining has the shortest
Length of Mobile Research Session – Mean in Minutes
NET
31.6
28.5
25.1 26.0 25.6 25.8
24.4
21.3
19.3 19.7
17.6 17.6
13.8
On average, how much time did you spend on each session related to browsing or researching on your mobile device for
<<CATEGORY>> information or products or services? Base=Mobile Internet category Users.
Source: Yahoo!/Nielsen Mobile Shopping Framework Study 2010
45
45. Consumers want informative, relevant and
simple mobile advertising
I strongly agree/agree with mobile advertising…
Mobile ads that very clearly told me the price of the product 41%
Mobile ads that are straightforward and fact-based 40% 53%
Mobile ads that are informative 38% Informative
Mobile ads that clearly spelled out the features and benefits 36%
Mobile ads that are relevant 37%
48%
Useful when I’m looking for certain information 37%
Relevant
Targeted just to me and relevant my interests or background 29%
Mobile ads that give a short snapshot of information 31%
41%
Mobile ads that contain a simple call to action 26%
Simple
Mobile ads that are text based 19%
Feel good or better about the brand in general 25% 29%
Mobile ads that focus on the overall value and not price 18% Branding
Mobile ads that incorporate multimedia elements 20% 26%
Mobile banner ads which include graphical elements 18% Graphical
Mobile ads that are entertaining 35%
Mobile ads that are memorable 27%
Mobile ads which are more relevant to my current location 27%
Mobile ads that I can share with friends or family 20%
Please tell us how important the following types of ad features are to you when it comes to <<CATEGORY>> advertising
on your mobile device. “Extremely/very/somewhat important.” Base=Mobile Internet Category Users.
Source: Yahoo!/Nielsen Mobile Shopping Framework Study 2010
46