Downloaded 288 times

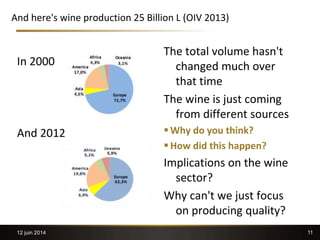
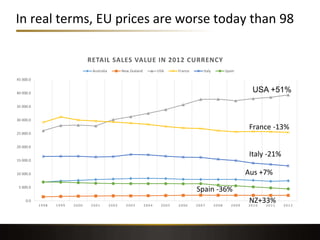
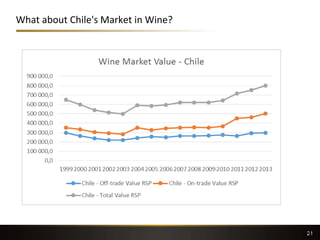
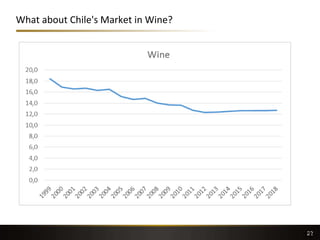
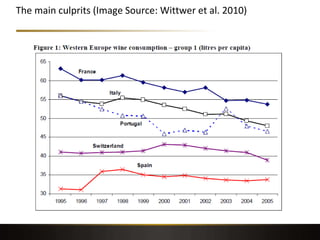
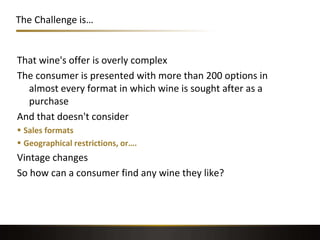

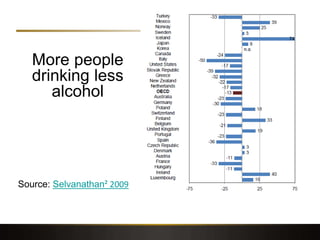


The global wine market faces challenges of oversupply, fragmentation, and changing consumer behavior. Global wine production has increased from 25 billion liters in 2000 to the same level in 2012, coming from more sources. The wine industry is fragmented with no concentration in production or offerings. Consumer behavior is also fragmented, with more people drinking less alcohol. Opportunities exist in emerging markets, online sales, and on-premise consumption. The wine industry must adapt to growing diversity in global consumption trends.


