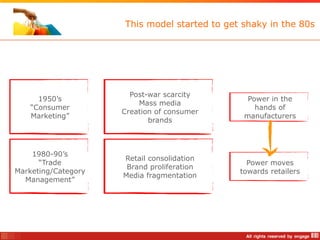
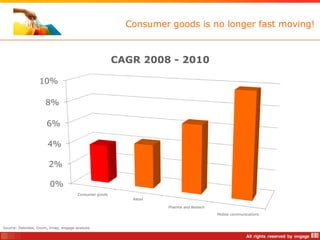
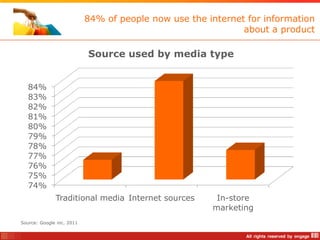
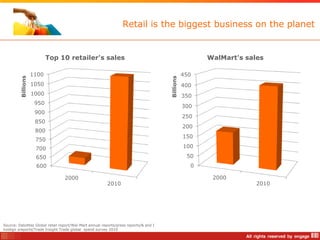
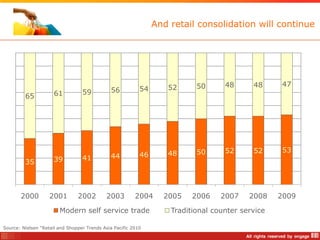
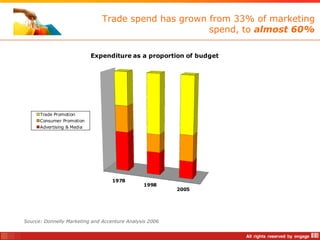
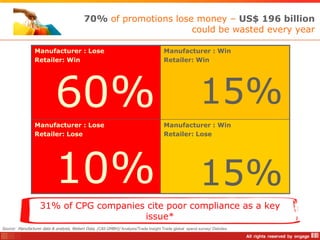
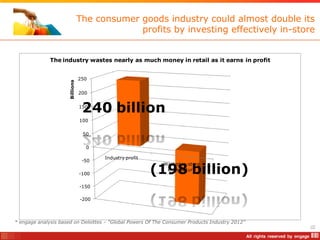
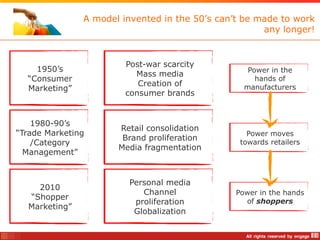
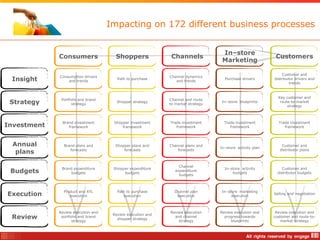
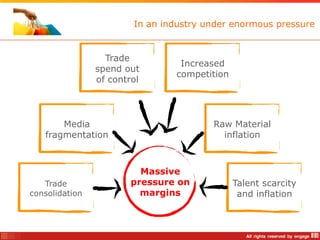
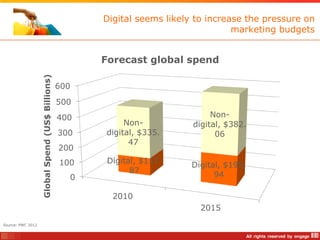
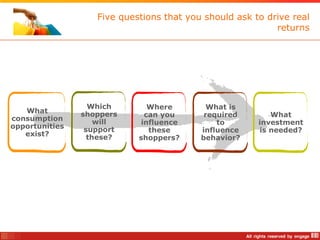
What‟s changing in the world of
                                           consumer goods?
www.engageconsultants.com   facebook.com/engagetheexperts   twitter.com/shopperexperts
Consumer goods is an enormous industry


    Top 250 companies turnover                           US$2.8 trillion*
    Globally these companies create profits of                                US$240
    billion*
    Since 2008 the top 250 companies have grown annually by

    less than         4%*

* Source Deloittes – “Global Powers Of The Consumer Products Industry 2012”
How it all started


Developing   Drive depth
 powerful         of
  brands     distribution
This model started to get shaky in the 80s


                       Post-war scarcity
     1950‟s                                     Power in the
                         Mass media
   “Consumer                                      hands of
                     Creation of consumer
   Marketing”                                  manufacturers
                            brands


    1980-90‟s
                     Retail consolidation
      “Trade                                    Power moves
                      Brand proliferation
Marketing/Category                            towards retailers
                     Media fragmentation
  Management”
Consumer goods is no longer fast moving!


                                                        CAGR 2008 - 2010

                   10%

                      8%

                       6%

                       4%

                        2%

                        0%
                                       Consumer goods
                                                           Retail

                                                                    Pharma and Biotech

                                                                                         Mobile communications


Source: Deloiites, Ovum, Imap, engage analysis
Today media is personal
84% of people now use the internet for information
                                                             about a product

                           Source used by media type


   84%
   83%
   82%
   81%
   80%
   79%
   78%
   77%
   76%
   75%
   74%
              Traditional media Internet sources       In-store
                                                      marketing
Source: Google inc. 2011
Isn‟t this just for travel, auto or electronics?


                             Global monthly searches

            10
 Millions


             9
             8
             7
             6
             5
             4
             3
             2
             1
             0
                 Coca Cola     Dove    Gillette   Colgate   Pantene   Wrigley
                             Shampoo
Source: Google inc. 2011
Not in Asia?


                 Facebook Users                                                  Facebook Users

                                                                  China (25)

                                                               Sri Lanka (20)
             South
          America, 80,9   Africa, 30,468,
            35,080              040         Australia, 12,8     Vietnam (16)
                                               62,760

                                                                    UAE (14)

                                                              Sinagpore (13)
                                            Europe, 207,4
Asia, 166,498,                                 74,560
      640                                                     Hong Kong (10)

                    North America                                 Taiwan (6)
                    , 205,629,460
                                                                 Thailand (5)

                                                                 Malaysia (4)

                                                               Philippines (3)

                                                                Indonesia (1)

                                                                                 0
                                                                                       20,000,000
                                                                                                      40,000,000
Retail is the biggest business on the planet


                           Top 10 retailer's sales                                                      WalMart's sales

                    1100                                                                          450
         Billions


                                                                                       Billions
                    1050                                                                          400
                    1000                                                                          350
                     950
                                                                                                  300
                     900
                                                                                                  250
                     850
                                                                                                  200
                     800
                                                                                                  150
                     750
                     700                                                                          100

                     650                                                                           50
                     600                                                                            0

                                  2000                                                                   2000
                                                         2010                                                        2010


Source: Deloittes Global retail report/Wal-Mart annual reports/press reports/& and I
holdign sreports/Trade Insight Trade global spend survey 2010
And retail consolidation will continue


                                                                   52      50      48      48      47
                                  59          56           54
         65           61


                                                                   48      50      52      52      53
                                  41          44           46
         35           39


       2000         2001        2002        2003         2004     2005    2006    2007    2008    2009

                        Modern self service trade                   Traditional counter service

Source: Nielsen “Retail and Shopper Trends Asia Pacific 2010
Shoppers are retailers‟ lifeblood, and have more
                                        choice than ever


                 More
                 often


  More                           Spending
shoppers                           more

               Better
             returns on
               capital
             employed
In many parts of the region hypermarket growth is slowing


         32

                                                                 29.8
         30                                                              29.2

         28


         26


         24
                     22.8
                                                      21.7                      22
         22                 21.4               21.2
                                                                                     20.7

         20
                       Taiwan                   Malaysia             Thailand   Indonesia

                                                       2009   2010

Source: Nielsen Asia Retail and Shopper Trends 2011
Whilst smaller stores are gaining ground


                     Convenience stores                              Supermarkets and minimarts

      35                                                            27          26.5
                                                                         26.1
                                                                    26
                     29.8
      30      28.8                                                  25

                                                                    24
      25
                                                                    23

                                                                    22
      20                                                                                              21.4
                                       18.5
                                                                    21
                                16.7
                                                                    20
      15
                                                             12.6                              18.9
                                                      12.2          19

      10                                                            18
                 Taiwan         Thailand              Singapore           Malaysia             Indonesia
                             2009   2010                                         2009   2010

Source: Nielsen Asia Retail and Shopper Trends 2011
In as a result in Taiwan, Indonesia and Thailand Main
                                                  shops are becoming less frequent

                     Shoppers MAIN SHOP Frequency (% of grocery shoppers)

                     5
                              14         15
                                                      26   23
         36         26                                               25
                              22                                                          51
                                         29                                     55             48   61
                                                      23   29

                                                                     34


         64         67                                                          19        24   26
                              62
                                         54
                                                      49   45                                       28
                                                                     30
                                                                                24        21   18
                                                                                                    9


                                     Weekly      2 Weeks   Monthly        Less Often 4%

Source: Nielsen Asia Retail and Shopper Trends 2011
But what happens when 20% of sales are online?
Look what's happening…
Retailers “sell” a „virtuous cycle‟


                                          Higher volumes
                                           enable lower
                                               costs

            Higher volumes                                            Lower costs
                for key                                              enable lower
               suppliers                                             selling prices

                                           Lower selling
                                            prices drive
                                              volume


                       Pitch: this is mutually beneficial (!), driving volume
                                       through lowering price

Source: B&Q, Retail Outsourcing Ltd.
This delivers results for big retail
Trade spend has grown from 33% of marketing
                                                     spend, to almost 60%

                            Expenditure as a proportion of budget


      Trade Promotion
      Consumer Promotion
      Advertising & Media


                                   1978
                                               1998
                                                         2005


Source: Donnelly Marketing and Accenture Analysis 2006
70% of promotions lose money – US$ 196 billion
                                                                  could be wasted every year

                 Manufacturer : Lose                                                   Manufacturer : Win
                 Retailer: Win                                                         Retailer: Win


                            60%
                 Manufacturer : Lose                                                   Manufacturer : Win
                                                                                                           15%
                 Retailer: Lose                                                        Retailer: Lose


                            10%                                                                            15%
                    31% of CPG companies cite poor compliance as a key
                                        issue*
Source: Manufacturer data & analysis, Nielsen Data, (CAS GMBH)/ Analysis/Trade Insight Trade global spend survey/ Deloites
The consumer goods industry could almost double its
                                              profits by investing effectively in-store


              The industry wastes nearly as much money in retail as it earns in profit


                                 250
                      Billions


                                 200


                                  240 billion
                                 150

                                 100

                                  50

                                   0

                                        Industry profit
                                  -50

                                                          (198 billion)
                                                            Wasted in-store
                                                             expenditure
                                 -100

                                 -150

                                 -200


* engage analysis based on Deloittes – “Global Powers Of The Consumer Products Industry 2012”
                                                                                                2.5bn
                                                                                                500m
A model invented in the 50‟s can‟t be made to work
                                                      any longer!


                        Post-war scarcity
    1950‟s                                        Power in the
                          Mass media
  “Consumer                                         hands of
                           Creation of           manufacturers
  Marketing”
                        consumer brands


    1980-90‟s
                      Retail consolidation
“Trade Marketing                                  Power moves
                       Brand proliferation
    /Category                                   towards retailers
                      Media fragmentation
  Management”


                        Personal media
    2010
                           Channel             Power in the hands
  “Shopper
                         proliferation           of shoppers
  Marketing”
                         Globalization
What is shopper marketing?


www.engageconsultants.com   facebook.com/engagetheexperts   twitter.com/shopperexperts
Consumers and shoppers are different
Consumer behavior is a cycle


             Needs and
              desires


Experience                          Occasions


              Availability
             to consume
Shoppers make products available to consume


    Shopper’s
  interpretation
                            Needs and
                             desires
              Shopper’s
                needs

Experience          Outlet selection                       Occasions

                             Solution location


                             AvailabilitySelection
                                          Product

                            to consume
                                                     Purchase


                                                            Availability to
                                                              consume
Purchase behavior is linear


  Shopper’s
interpretation

        Shopper’s needs


                 Outlet selection


                          Solution location

                                        Product
                                       Selection

                                                   Purchase
This not shopper marketing!
What is shopper marketing?


 “The systematic application of
elements of the marketing mix to
affect positive change in shopper
    behavior in order to drive
    consumption of a brand”
True, integrated, shopper marketing creates
                          coherent links between the end consumer
                                       and the in-store environment


Consumer     Shopper        Channel      In–store      Investment
priorities   behavior       priorities   marketing    in customers
Shopper marketing in a digital
                                                         world
www.engageconsultants.com   facebook.com/engagetheexperts   twitter.com/shopperexperts
Digital has the power to power to personalize
                                         consumer marketing


                      Needs and
                       desires


Experience                                   Occasions


                       Availability
                      to consume


             ZMOT proves this potential
Digital applications can enhance shoppers‟
                                                    understanding


Consumer’s
 demand                                     Search, ratings, revie
         Shopper’s                            ws, friends and
       interpretation                          family opinion.
                  Shopper’s
                    needs

                            Outlet
                           selection

                                       Solution
                                       location

                                                   Product
                                                  selection

                                                              Purchase
Digital enables shoppers to meet their needs better


Consumer’s                                    Store locations,
 demand                                      price points, offers
         Shopper’s                             and coupons.
       interpretation                       product availability –
                                              buy now or buy
                  Shopper’s
                    needs                           later?

                           Outlet
                          selection

                                      Solution
                                      location

                                                  Product
                                                 selection

                                                             Purchase
Digital has the power to influence shopper‟s behavior
                                                           in-store


Consumer’s
 demand

          Shopper’s
        interpretation

                   Shopper’s
                     needs

                            Outlet
                           selection
 Find products, check
                                       Solution
 recipes, review price
                                       location
      points, seek
alternatives, download                             Product
   coupons, PAY, and                              selection
exchange loyalty data
                                                              Purchase
BUT Integrated shopper marketing is already
                                                                                 complex

                                               Consumer insight


                                               Portfolio strategy

                                    Brand       Brand       Brand       Brand
                                   priority    priority    priority    priority
                                      1           2           3           4


                                                 Shopper insight

                                                                                                               Customer
                                                                                                                 plan
                                  In-store    In-store    In-store    In-store    Channel
                        Channel
                                  blueprint   blueprint   blueprint   blueprint    plan
Channel understanding


                                                                                                               Customer


                                                                                            Customer insight
                                                                                                                 plan
                                              In-store    In-store    In-store    Channel
                        Channel
                                              blueprint   blueprint   blueprint    plan
                                                                                                               Customer
                                                                                                                 plan


                                              In-store    In-store                Channel
                        Channel
                                              blueprint   blueprint                plan                        Customer
                                                                                                                 plan


                                  In-store    In-store                In-store    Channel
                        Channel                                                                                Customer
                                  blueprint   blueprint               blueprint    plan
                                                                                                                 plan
Impacting on 172 different business processes


                                                                                  In–store
             Consumers                Shoppers               Channels                                      Customers
                                                                                  Marketing

                                                                                                               Customer and
             Consumption drivers                            Channel dynamics
 Insight         and trends
                                       Path to purchase
                                                               and trends
                                                                                   Purchase drivers       distributor drivers and
                                                                                                                   trends


                                                                                                            Key customer and
              Portfolio and brand                           Channel and route
 Strategy           strategy
                                       Shopper strategy
                                                            to market strategy
                                                                                  In–store blueprints        route-to-market
                                                                                                                 strategy


              Brand investment       Shopper investment     Trade investment       Trade investment         Trade investment
Investment       framework               framework             framework              framework                framework


 Annual        Brand plans and        Shopper plans and     Channel plans and
                                                                                 In–store activity plan
                                                                                                              Customer and
                                                                forecasts                                    distributor plans
  plans           forecasts               forecasts


                                                                 Channel
              Brand expenditure      Shopper expenditure                           In–store activity           Customer and
 Budgets          budgets                 budgets
                                                               expenditure
                                                                                       budgets              distributor budgets
                                                                 budgets


               Product and ATL         Path to purchase       Channel plan       In–store marketing
Execution         execution               execution            execution              execution
                                                                                                          Selling and negotiation


             Review execution and                           Review execution     Review execution and      Review execution and
                                     Review execution and
 Review       portfolio and brand
                                       shopper strategy
                                                              and channel          progress towards       customer and route-to-
                    strategy                                    strategy              blueprints             market strategy
In an industry under enormous pressure


                  Trade
                                 Increased
                spend out
                                competition
                of control


       Media                            Raw Material
   fragmentation                          inflation


                          Massive
   Trade                pressure on           Talent scarcity
consolidation             margins              and inflation
Digital seems likely to increase the pressure on
                                                                                     marketing budgets


                                                       Forecast global spend
                   Global Spend (US$ Billions)


                                                 600
                                                 500
                                                 400                            Non-
                                                            Non-           digital, $382.
                                                 300   digital, $335.            06
                                                             47
                                                 200
                                                 100    Digital, $117.
                                                                           Digital, $195.
                                                              87
                                                   0                             94

                                                         2010
                                                                             2015
Source: PWC 2012
Five questions that you should ask to drive real
                                                           returns


                  Which        Where        What is
   What         shoppers      can you      required       What
consumption         will     influence        to       investment
opportunities    support       these      influence    is needed?
   exist?         these?    shoppers?     behavior?

Whats Changing In The World Of Consumer Goods

  • 1.
    What‟s changing inthe world of consumer goods? www.engageconsultants.com facebook.com/engagetheexperts twitter.com/shopperexperts
  • 2.
    Consumer goods isan enormous industry Top 250 companies turnover US$2.8 trillion* Globally these companies create profits of US$240 billion* Since 2008 the top 250 companies have grown annually by less than 4%* * Source Deloittes – “Global Powers Of The Consumer Products Industry 2012”
  • 3.
    How it allstarted Developing Drive depth powerful of brands distribution
  • 4.
    This model startedto get shaky in the 80s Post-war scarcity 1950‟s Power in the Mass media “Consumer hands of Creation of consumer Marketing” manufacturers brands 1980-90‟s Retail consolidation “Trade Power moves Brand proliferation Marketing/Category towards retailers Media fragmentation Management”
  • 5.
    Consumer goods isno longer fast moving! CAGR 2008 - 2010 10% 8% 6% 4% 2% 0% Consumer goods Retail Pharma and Biotech Mobile communications Source: Deloiites, Ovum, Imap, engage analysis
  • 6.
  • 7.
    84% of peoplenow use the internet for information about a product Source used by media type 84% 83% 82% 81% 80% 79% 78% 77% 76% 75% 74% Traditional media Internet sources In-store marketing Source: Google inc. 2011
  • 8.
    Isn‟t this justfor travel, auto or electronics? Global monthly searches 10 Millions 9 8 7 6 5 4 3 2 1 0 Coca Cola Dove Gillette Colgate Pantene Wrigley Shampoo Source: Google inc. 2011
  • 9.
    Not in Asia? Facebook Users Facebook Users China (25) Sri Lanka (20) South America, 80,9 Africa, 30,468, 35,080 040 Australia, 12,8 Vietnam (16) 62,760 UAE (14) Sinagpore (13) Europe, 207,4 Asia, 166,498, 74,560 640 Hong Kong (10) North America Taiwan (6) , 205,629,460 Thailand (5) Malaysia (4) Philippines (3) Indonesia (1) 0 20,000,000 40,000,000
  • 10.
    Retail is thebiggest business on the planet Top 10 retailer's sales WalMart's sales 1100 450 Billions Billions 1050 400 1000 350 950 300 900 250 850 200 800 150 750 700 100 650 50 600 0 2000 2000 2010 2010 Source: Deloittes Global retail report/Wal-Mart annual reports/press reports/& and I holdign sreports/Trade Insight Trade global spend survey 2010
  • 11.
    And retail consolidationwill continue 52 50 48 48 47 59 56 54 65 61 48 50 52 52 53 41 44 46 35 39 2000 2001 2002 2003 2004 2005 2006 2007 2008 2009 Modern self service trade Traditional counter service Source: Nielsen “Retail and Shopper Trends Asia Pacific 2010
  • 12.
    Shoppers are retailers‟lifeblood, and have more choice than ever More often More Spending shoppers more Better returns on capital employed
  • 13.
    In many partsof the region hypermarket growth is slowing 32 29.8 30 29.2 28 26 24 22.8 21.7 22 22 21.4 21.2 20.7 20 Taiwan Malaysia Thailand Indonesia 2009 2010 Source: Nielsen Asia Retail and Shopper Trends 2011
  • 14.
    Whilst smaller storesare gaining ground Convenience stores Supermarkets and minimarts 35 27 26.5 26.1 26 29.8 30 28.8 25 24 25 23 22 20 21.4 18.5 21 16.7 20 15 12.6 18.9 12.2 19 10 18 Taiwan Thailand Singapore Malaysia Indonesia 2009 2010 2009 2010 Source: Nielsen Asia Retail and Shopper Trends 2011
  • 15.
    In as aresult in Taiwan, Indonesia and Thailand Main shops are becoming less frequent Shoppers MAIN SHOP Frequency (% of grocery shoppers) 5 14 15 26 23 36 26 25 22 51 29 55 48 61 23 29 34 64 67 19 24 26 62 54 49 45 28 30 24 21 18 9 Weekly 2 Weeks Monthly Less Often 4% Source: Nielsen Asia Retail and Shopper Trends 2011
  • 16.
    But what happenswhen 20% of sales are online?
  • 17.
  • 18.
    Retailers “sell” a„virtuous cycle‟ Higher volumes enable lower costs Higher volumes Lower costs for key enable lower suppliers selling prices Lower selling prices drive volume Pitch: this is mutually beneficial (!), driving volume through lowering price Source: B&Q, Retail Outsourcing Ltd.
  • 19.
    This delivers resultsfor big retail
  • 20.
    Trade spend hasgrown from 33% of marketing spend, to almost 60% Expenditure as a proportion of budget Trade Promotion Consumer Promotion Advertising & Media 1978 1998 2005 Source: Donnelly Marketing and Accenture Analysis 2006
  • 21.
    70% of promotionslose money – US$ 196 billion could be wasted every year Manufacturer : Lose Manufacturer : Win Retailer: Win Retailer: Win 60% Manufacturer : Lose Manufacturer : Win 15% Retailer: Lose Retailer: Lose 10% 15% 31% of CPG companies cite poor compliance as a key issue* Source: Manufacturer data & analysis, Nielsen Data, (CAS GMBH)/ Analysis/Trade Insight Trade global spend survey/ Deloites
  • 22.
    The consumer goodsindustry could almost double its profits by investing effectively in-store The industry wastes nearly as much money in retail as it earns in profit 250 Billions 200 240 billion 150 100 50 0 Industry profit -50 (198 billion) Wasted in-store expenditure -100 -150 -200 * engage analysis based on Deloittes – “Global Powers Of The Consumer Products Industry 2012” 2.5bn 500m
  • 23.
    A model inventedin the 50‟s can‟t be made to work any longer! Post-war scarcity 1950‟s Power in the Mass media “Consumer hands of Creation of manufacturers Marketing” consumer brands 1980-90‟s Retail consolidation “Trade Marketing Power moves Brand proliferation /Category towards retailers Media fragmentation Management” Personal media 2010 Channel Power in the hands “Shopper proliferation of shoppers Marketing” Globalization
  • 24.
    What is shoppermarketing? www.engageconsultants.com facebook.com/engagetheexperts twitter.com/shopperexperts
  • 25.
  • 26.
    Consumer behavior isa cycle Needs and desires Experience Occasions Availability to consume
  • 27.
    Shoppers make productsavailable to consume Shopper’s interpretation Needs and desires Shopper’s needs Experience Outlet selection Occasions Solution location AvailabilitySelection Product to consume Purchase Availability to consume
  • 28.
    Purchase behavior islinear Shopper’s interpretation Shopper’s needs Outlet selection Solution location Product Selection Purchase
  • 29.
    This not shoppermarketing!
  • 30.
    What is shoppermarketing? “The systematic application of elements of the marketing mix to affect positive change in shopper behavior in order to drive consumption of a brand”
  • 31.
    True, integrated, shoppermarketing creates coherent links between the end consumer and the in-store environment Consumer Shopper Channel In–store Investment priorities behavior priorities marketing in customers
  • 32.
    Shopper marketing ina digital world www.engageconsultants.com facebook.com/engagetheexperts twitter.com/shopperexperts
  • 33.
    Digital has thepower to power to personalize consumer marketing Needs and desires Experience Occasions Availability to consume ZMOT proves this potential
  • 34.
    Digital applications canenhance shoppers‟ understanding Consumer’s demand Search, ratings, revie Shopper’s ws, friends and interpretation family opinion. Shopper’s needs Outlet selection Solution location Product selection Purchase
  • 35.
    Digital enables shoppersto meet their needs better Consumer’s Store locations, demand price points, offers Shopper’s and coupons. interpretation product availability – buy now or buy Shopper’s needs later? Outlet selection Solution location Product selection Purchase
  • 36.
    Digital has thepower to influence shopper‟s behavior in-store Consumer’s demand Shopper’s interpretation Shopper’s needs Outlet selection Find products, check Solution recipes, review price location points, seek alternatives, download Product coupons, PAY, and selection exchange loyalty data Purchase
  • 37.
    BUT Integrated shoppermarketing is already complex Consumer insight Portfolio strategy Brand Brand Brand Brand priority priority priority priority 1 2 3 4 Shopper insight Customer plan In-store In-store In-store In-store Channel Channel blueprint blueprint blueprint blueprint plan Channel understanding Customer Customer insight plan In-store In-store In-store Channel Channel blueprint blueprint blueprint plan Customer plan In-store In-store Channel Channel blueprint blueprint plan Customer plan In-store In-store In-store Channel Channel Customer blueprint blueprint blueprint plan plan
  • 38.
    Impacting on 172different business processes In–store Consumers Shoppers Channels Customers Marketing Customer and Consumption drivers Channel dynamics Insight and trends Path to purchase and trends Purchase drivers distributor drivers and trends Key customer and Portfolio and brand Channel and route Strategy strategy Shopper strategy to market strategy In–store blueprints route-to-market strategy Brand investment Shopper investment Trade investment Trade investment Trade investment Investment framework framework framework framework framework Annual Brand plans and Shopper plans and Channel plans and In–store activity plan Customer and forecasts distributor plans plans forecasts forecasts Channel Brand expenditure Shopper expenditure In–store activity Customer and Budgets budgets budgets expenditure budgets distributor budgets budgets Product and ATL Path to purchase Channel plan In–store marketing Execution execution execution execution execution Selling and negotiation Review execution and Review execution Review execution and Review execution and Review execution and Review portfolio and brand shopper strategy and channel progress towards customer and route-to- strategy strategy blueprints market strategy
  • 39.
    In an industryunder enormous pressure Trade Increased spend out competition of control Media Raw Material fragmentation inflation Massive Trade pressure on Talent scarcity consolidation margins and inflation
  • 40.
    Digital seems likelyto increase the pressure on marketing budgets Forecast global spend Global Spend (US$ Billions) 600 500 400 Non- Non- digital, $382. 300 digital, $335. 06 47 200 100 Digital, $117. Digital, $195. 87 0 94 2010 2015 Source: PWC 2012
  • 41.
    Five questions thatyou should ask to drive real returns Which Where What is What shoppers can you required What consumption will influence to investment opportunities support these influence is needed? exist? these? shoppers? behavior?