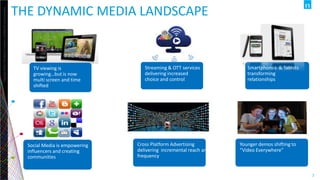
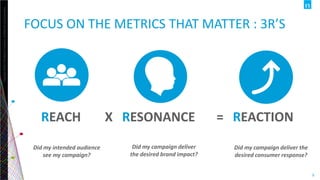
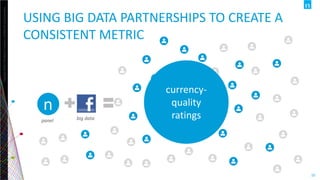
#SMTVAS
James Oates
UK Managing Director, Marketing Effectiveness
Nielsen Digital
James Oates
UK Managing Director
Marketing Effectiveness
June 2014
PLAN…BUY… MEASURE…
FOR CROSS PLATFORM SUCCESS
Copyright©2013TheNielsenCompany.Confidentialandproprietary.
3
THE DYNAMIC MEDIA LANDSCAPE
Streaming & OTT services
delivering increased
choice and control
Social Media is empowering
influencers and creating
communities
Smartphones & Tablets
transforming
relationships
TV viewing is
growing…but is now
multi screen and time
shifted
Cross Platform Advertising
delivering incremental reach and
frequency
Younger demos shifting to
“Video Everywhere”
Copyright©2013TheNielsenCompany.Confidentialandproprietary.
4
PRINT
TELEVISION
THEN
OUTDOOR
RADIO
CINEMA
DIRECT MAIL
Copyright©2013TheNielsenCompany.Confidentialandproprietary.
5
NOW
INSTANT
MESSAGING
EMAIL
GEO-
LOCATION
DATING
VIDEO
MUSIC
MOBILE
COMMERCE
ONLINE
SHOPPING NFC
TEXT SMS
APPS
SOCIAL MEDIA
Copyright©2013TheNielsenCompany.Confidentialandproprietary.
6
TV IS STILL THE PREFERRED SCREEN…
• U.S.: Nielsen NPOWER; U.K.: BARB; Italy: Auditel
185:00
Average Monthly TV Time Spent (HH:MM) – December
2013
129:54 143:20
Copyright©2013TheNielsenCompany.Confidentialandproprietary.
7
…BUT TIME IS NOW SHARED WITH OTHER DEVICES
• U.S.: NetView, Mobile NetView 3.0; U.K.: NetView, Mobile Meter Panel; Italy: NetView, Mobile Meter Panel
Average Monthly Time Spent online on Computers and Mobile
Devices (HH:MM) – December 2013
26:58 34:21 29:14 41:42 18:07 37:12
ht©2012TheNielsenCompany.Confidentialandproprietary.
8
CHALLENGE OF LANDING AN AD EFFECTIVELY
Advertising is less effective to younger audiences
Remember the ad
Remember the brand
35-49 years 50+ years18-24 years 25-34 years
46%
33%
56%
39%
62%
44%
70%
54%
THE CHALLENGE…
MORE PLATFORMS
MORE ADVERTISING
LESS FOCUS
Copyright©2013TheNielsenCompany.Confidentialandproprietary.
10
FOCUS ON THE METRICS THAT MATTER : 3RS
X =REACH
Did my intended audience
see my campaign?
RESONANCE
Did my campaign deliver
the desired brand impact?
REACTION
Did my campaign deliver the
desired consumer response?
Copyright©2013TheNielsenCompany.Confidentialandproprietary.
11
USING BIG DATA PARTNERSHIPS TO CREATE A
CONSISTENT METRIC
currency-
quality
ratings
n
panel big data
12
Copyright©2013TheNielsenCompany.Confidentialandproprietary.
Viewability
WHAT
HOW…
And if that
were not
enough…
…. IN REAL TIME
WITH NO
MINIMUM
CAMPAIGN
SIZE
Market Mix Model
Extracts
TV + Online Realtime Resonance
measures
…by day …by publisher …by placement …by demo
Reach Frequency Gross Rating Points
ONLINE CAMPAIGN RATINGS
Copyright©2013TheNielsenCompany.Confidentialandproprietary.
13
EUROPEAN RESULTS SHOW HUGE UPSIDE
POTENTIAL FOR ONLINE AD CAMPAIGNS
OF ALL IMPRESSIONS ARE
SERVED TO THE TARGET
AUDIENCE
only50%
THE VARIANCE
BETWEEN PUBLISHERS
IS SIGNIFICANT
OPTIMISING IN REAL TIME IS
DELIVERING INCREASED ROI
68%
Off-Target
32%
Masked Campaign: Site On-Target Delivery
Target Audience: Male 25-49
Copyright©2013TheNielsenCompany.Confidentialandproprietary.
14
ADVERTISERS WANT TO KNOW IF THEIR
CAMPAIGNS ARE LANDING ONLINE
Source Nielsen Online Camoaign Ratings, UK
Copyright©2013TheNielsenCompany.Confidentialandproprietary.
15
Stop measuring in
SILOS
Duplicated Audience
What audience is reached by both the
TV and online campaign?
How frequently?
Unduplicated Audience
What is the total unduplicated
reach and frequency of a
cross-platform campaign?
Online
Audience
Television
Audience
Copyright©2013TheNielsenCompany.Confidentialandproprietary.
16
ONLINE DOES DELIVER INCREMENTAL
REACH
UK XCR TOTAL CAMPAIGN SUMMARY 2014
Copyright©2013TheNielsenCompany.Confidentialandproprietary.
17
BUT IT VARIES WIDELY BY DEMOGRAPHIC
17
In general,
Source: Nielsen Online
Source: Nielsen Online Campaign & Cross Media Ratings Benchmarks Database
Demographic Group
IncrementalReach
average
Copyright©2013TheNielsenCompany.Confidentialandproprietary.
18
UNDERSTAND RESONANCE CROSS PLATFORM
CSD-Norm

General Recall Brand Linkage Brand Linkage
A B C D A B C D A B C D
Among those who recall the Ad ‘s
content, what percentage were
able to accurately identify the
advertised brand?
Among all consumers reached
by the Ad, what percentage
remember BOTH the Ad’s
creative content AND the
advertised brand?
Brand Linkage Brand Recall
A B C D
Percentage who
recalled brand
Basis: Spot Recallers
A B C D
Among those who recall the Ad ‘s
content, what percentage were
able to accurately identify the
advertised brand?
Brand Linkage
A B C D
Percentage who
recalled brand
Basis: all respondents
General Recall Brand Linkage Brand Recall
Percentage who
recalled spot
Basis: all respondents
Copyright©2013TheNielsenCompany.Confidentialandproprietary.
19
FIRE & ICE: INTEGRATED FOR MAXIMUM
REACTION
Full Digital Support
National Press
Sampling
Nationwide
Integrated PR
Campaign
Interactive Online Comic
Complimentary NPD Joint Pack Promo
Joint Displays in-store
Joint TVC
Copyright©2013TheNielsenCompany.Confidentialandproprietary.
20
AS SUCH THE CAMPAIGN DELIVERED SIGNIFICANT
MEDIA ROI
£1.70
£1.60
£1.57
£1.30
£1.03
£0.95
£0.84
£0.75
£0.73
£0.45
£0.34
£0.25
Fire & Ice
Copy B
Copy C
Copy D
Copy E
Copy F
Copy G
Copy H
Copy I
Copy J
Copy K
Copy L
Fire & Ice vs. all other Pepsi Max Campaigns
(Incremental £ Sales per £ Spending – Grocery Multiples)
Copyright©2013TheNielsenCompany.Confidentialandproprietary.
21
COLLECT & CONNECT…IN REAL TIME
IN A CROSS PLATFORM WORLD
FOCUS ON THE METRICS THAT
MATTER
X =REACH RESONANCE REACTION

Specific Media TVAS Breakfast Event - Nielsen section

Editor's Notes

  • #6 Where we are today – an explosion of content both produced for and produced by consumers and fuelled by digital screens
  • #8 UK particularly engaged with time shifted viewing vs other markets
  • #9 Getting the attention of younger people is a real challenge Over 36000 ads were analysed and it shows an amazing pattern of behaviour – less recall, less memorability Just adds to the challenge
  • #11 To address pain points, developed 3R framework Simple, but powerful way of thinking about ad performance end-to-end – Einstein quote What are the 3R’s? 1st key point: Reaction is caused by Reach and Resonance Can have good reaction without having optimal Reach & Resonance Case Study: 100M impression campaign Reaction: +12% sales lift Reach: Males 21-29; 100M impression campaign; <40% hit desired audience Resonance: multiple creatives, multiple sites 2nd key point: Real time is a big opportunity– example above Vision: end-to-end 3R measurement, across key media platforms, in real time
  • #18 Online advertising (particularly social media) helps reaching younger audiences
  • #20 Why together = Shared target audience /shared occasion Adaptation of US ‘Ceasefire’ campaign Complimentary NPD Dramatized positive combination of the two flavours Making everyday drinks & snacks a more intense (shareable) experience Primary Increase Co-purchase of Pepsi Max & Doritos Deliver incremental quality F&D Secondary Drive trial of NPD TVC & on-pack performance above Millward brown database norms
  • #21 The campaign delivered higher returns in the 2 months after it aired than any of the previous 11 Pepsi campaigns. For every £1 Pepsi spent, they generated £1.70 in incremental brand sales. This put the campaign in the top 20% of the thousands of TV campaigns in Nielsen’s normative database. Dual brand penetration doubled during the campaign before settling at +5% by April 2012 – the primary objective of the campaign being to drive cross-brand consumption. Next question: which elements of the media mix drove Fire & Ice’s success?
  • #22 Which is why we work, to make something of that data – to organize it in a way that is usable, practical and meaningful for our clients – and we like to refer to that as information. And information is our most valuable asset – it’s the number one input to decision making – it is the fuel for growth, the leading ingredient needed to uncover unmet need and deliver against it.
  • #23 As the PepsiCo study shows an integrated campaign builds communication synergy and can guide the consumer along the Purchase Funnel Education – Awareness – Consideration – Trial-Loyalty- Advocacy