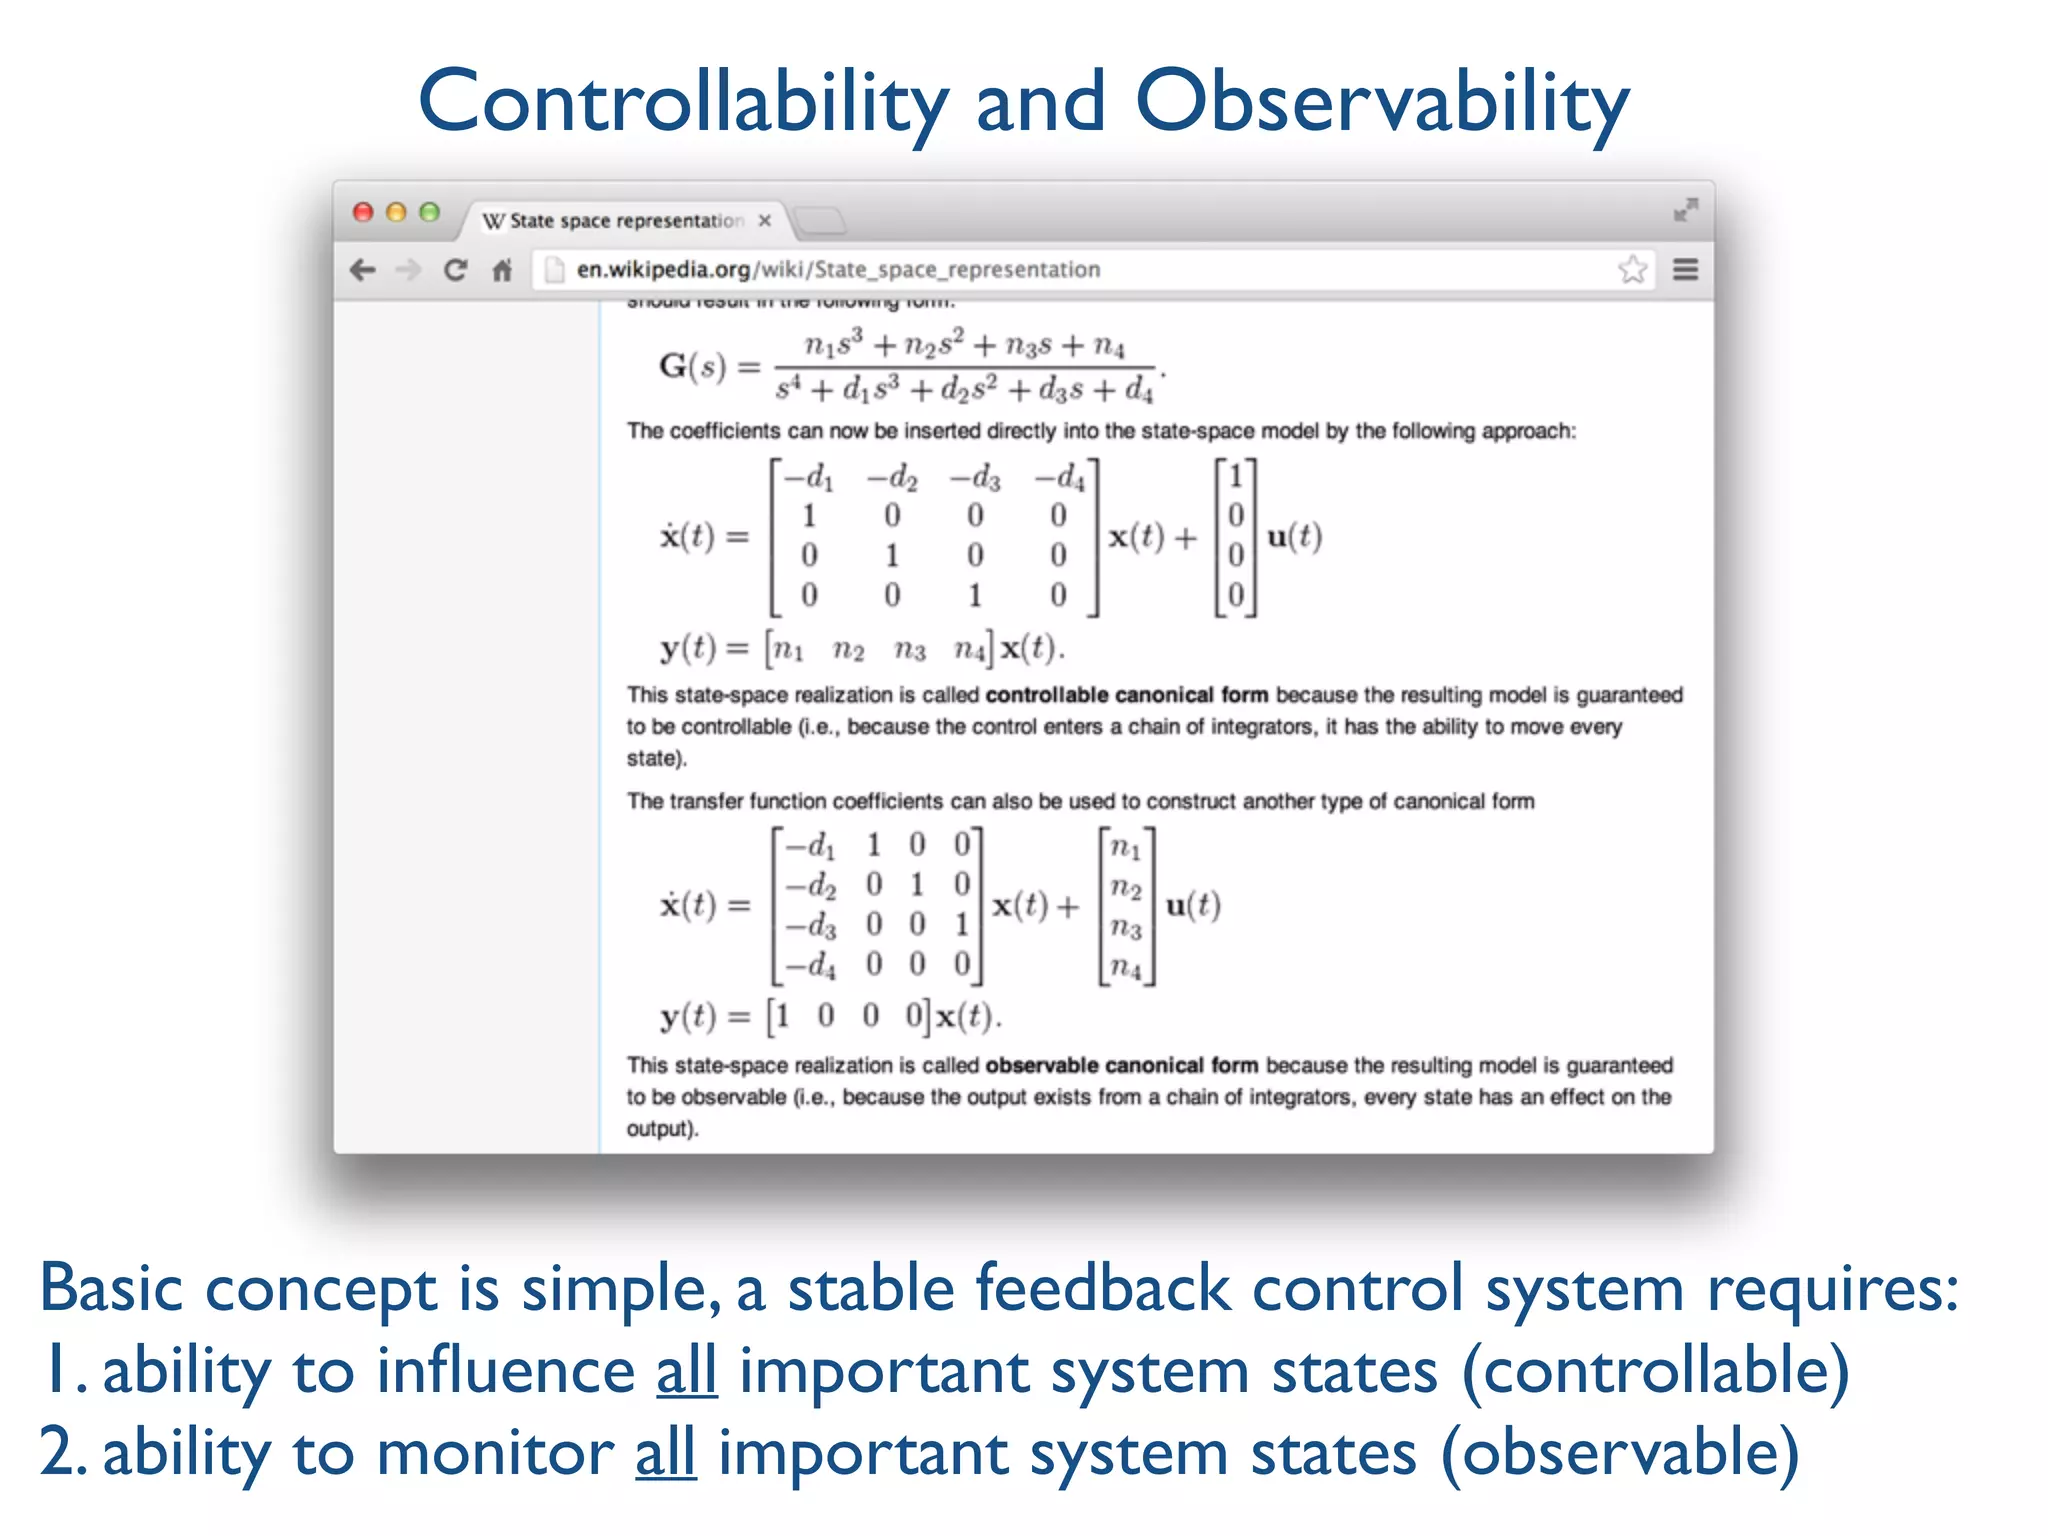
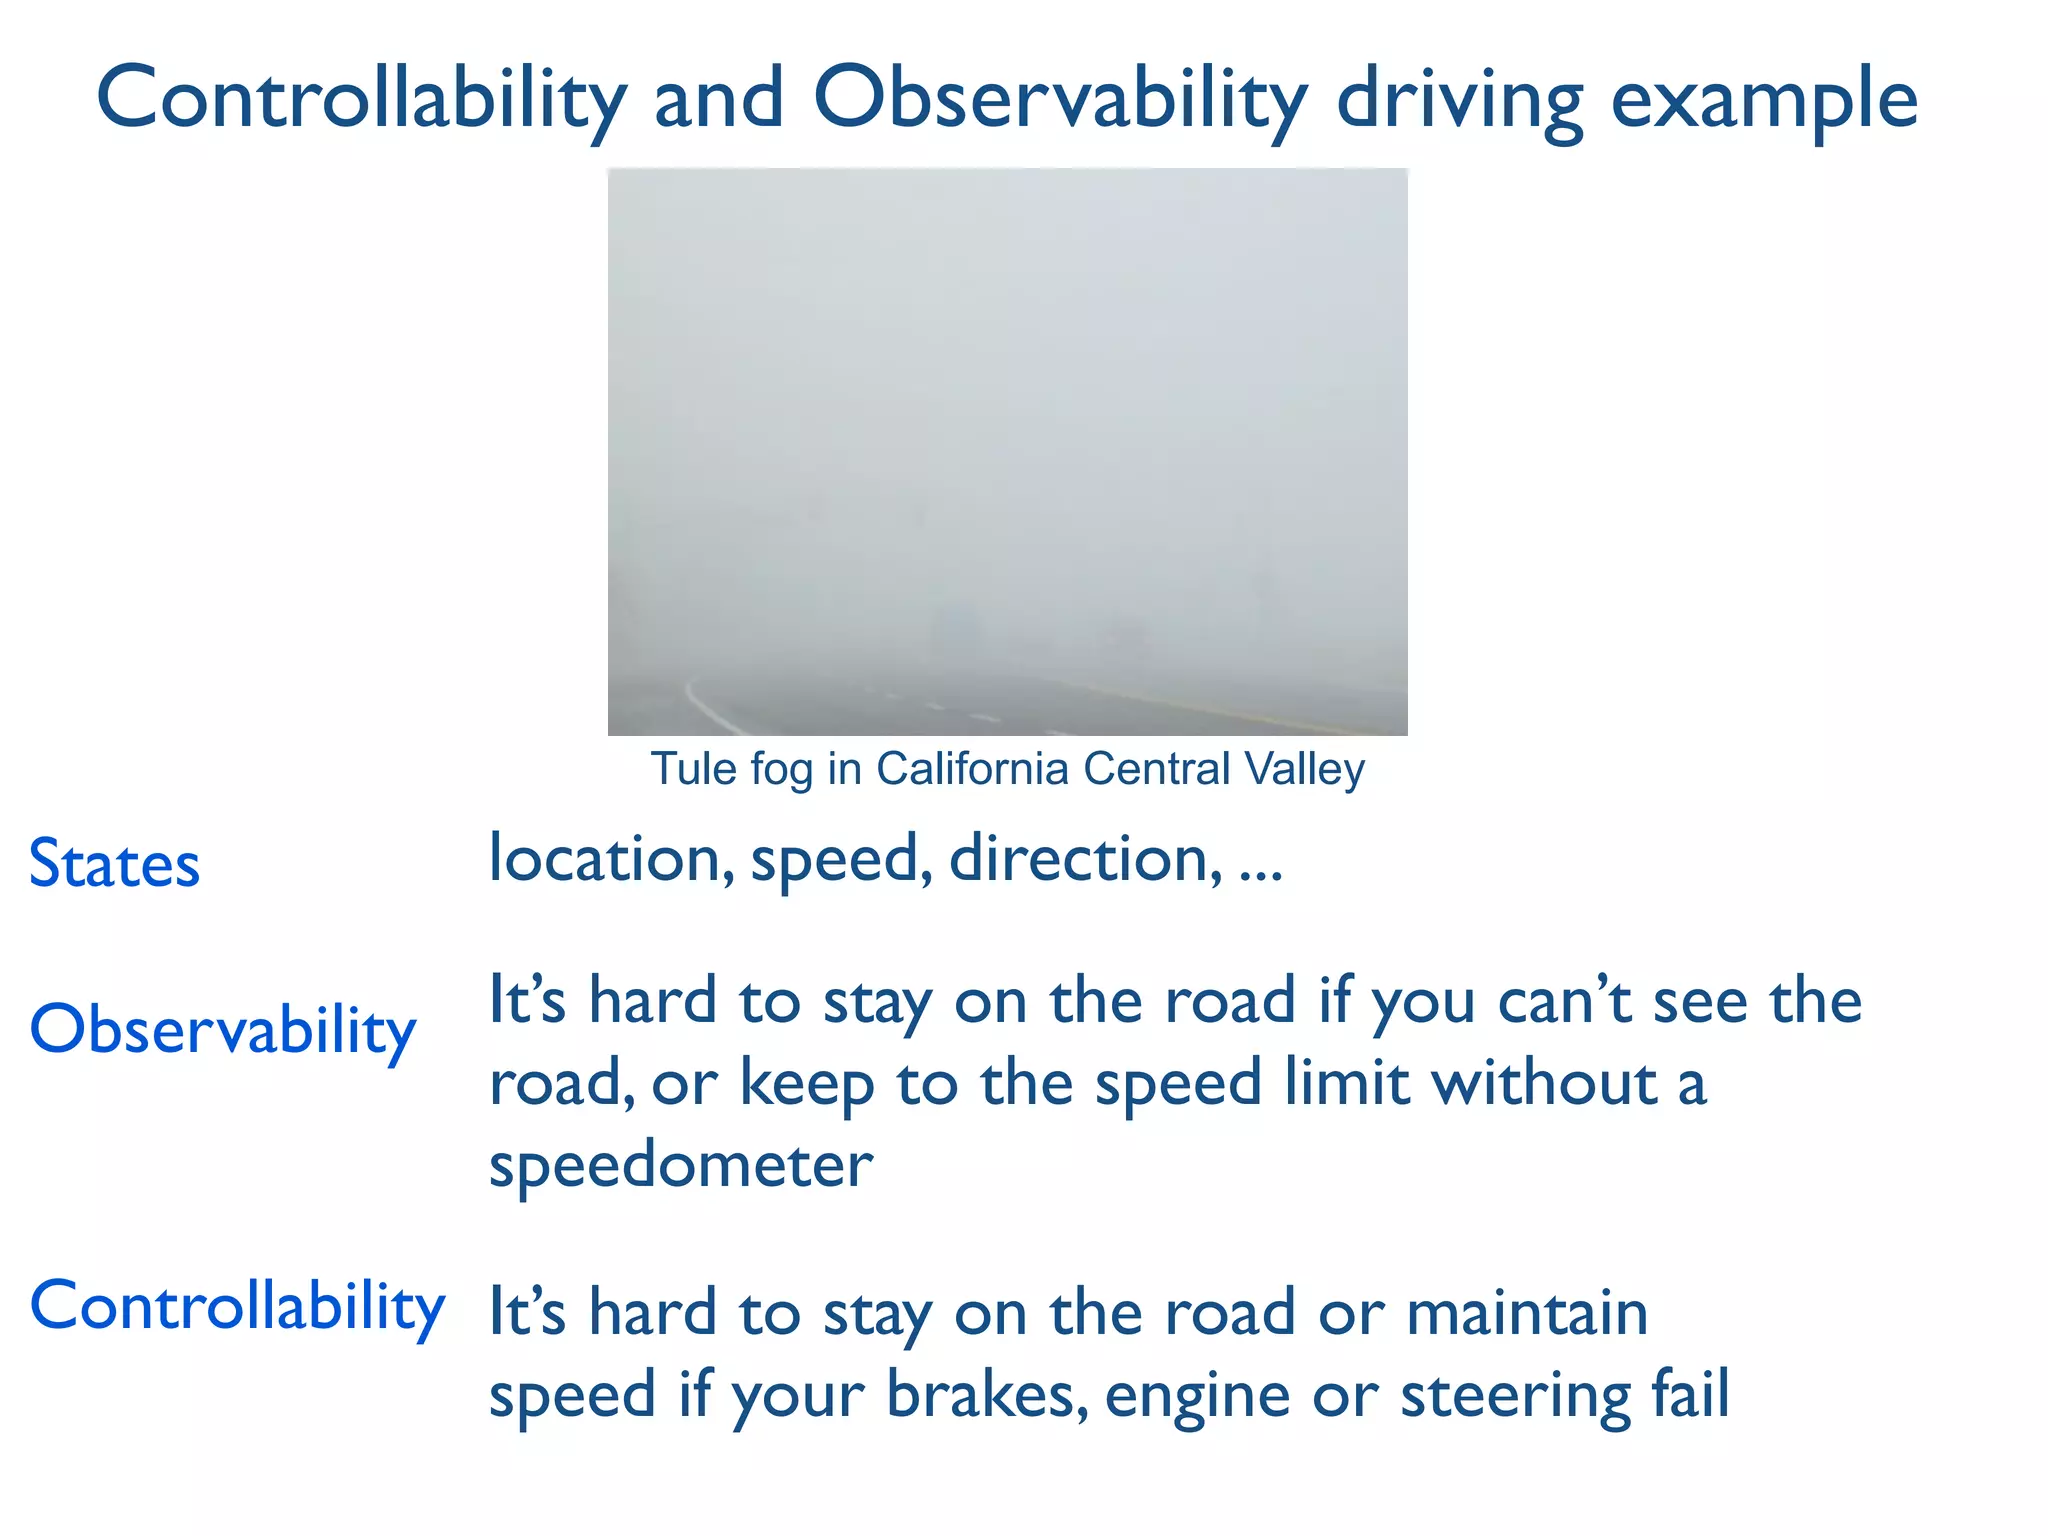
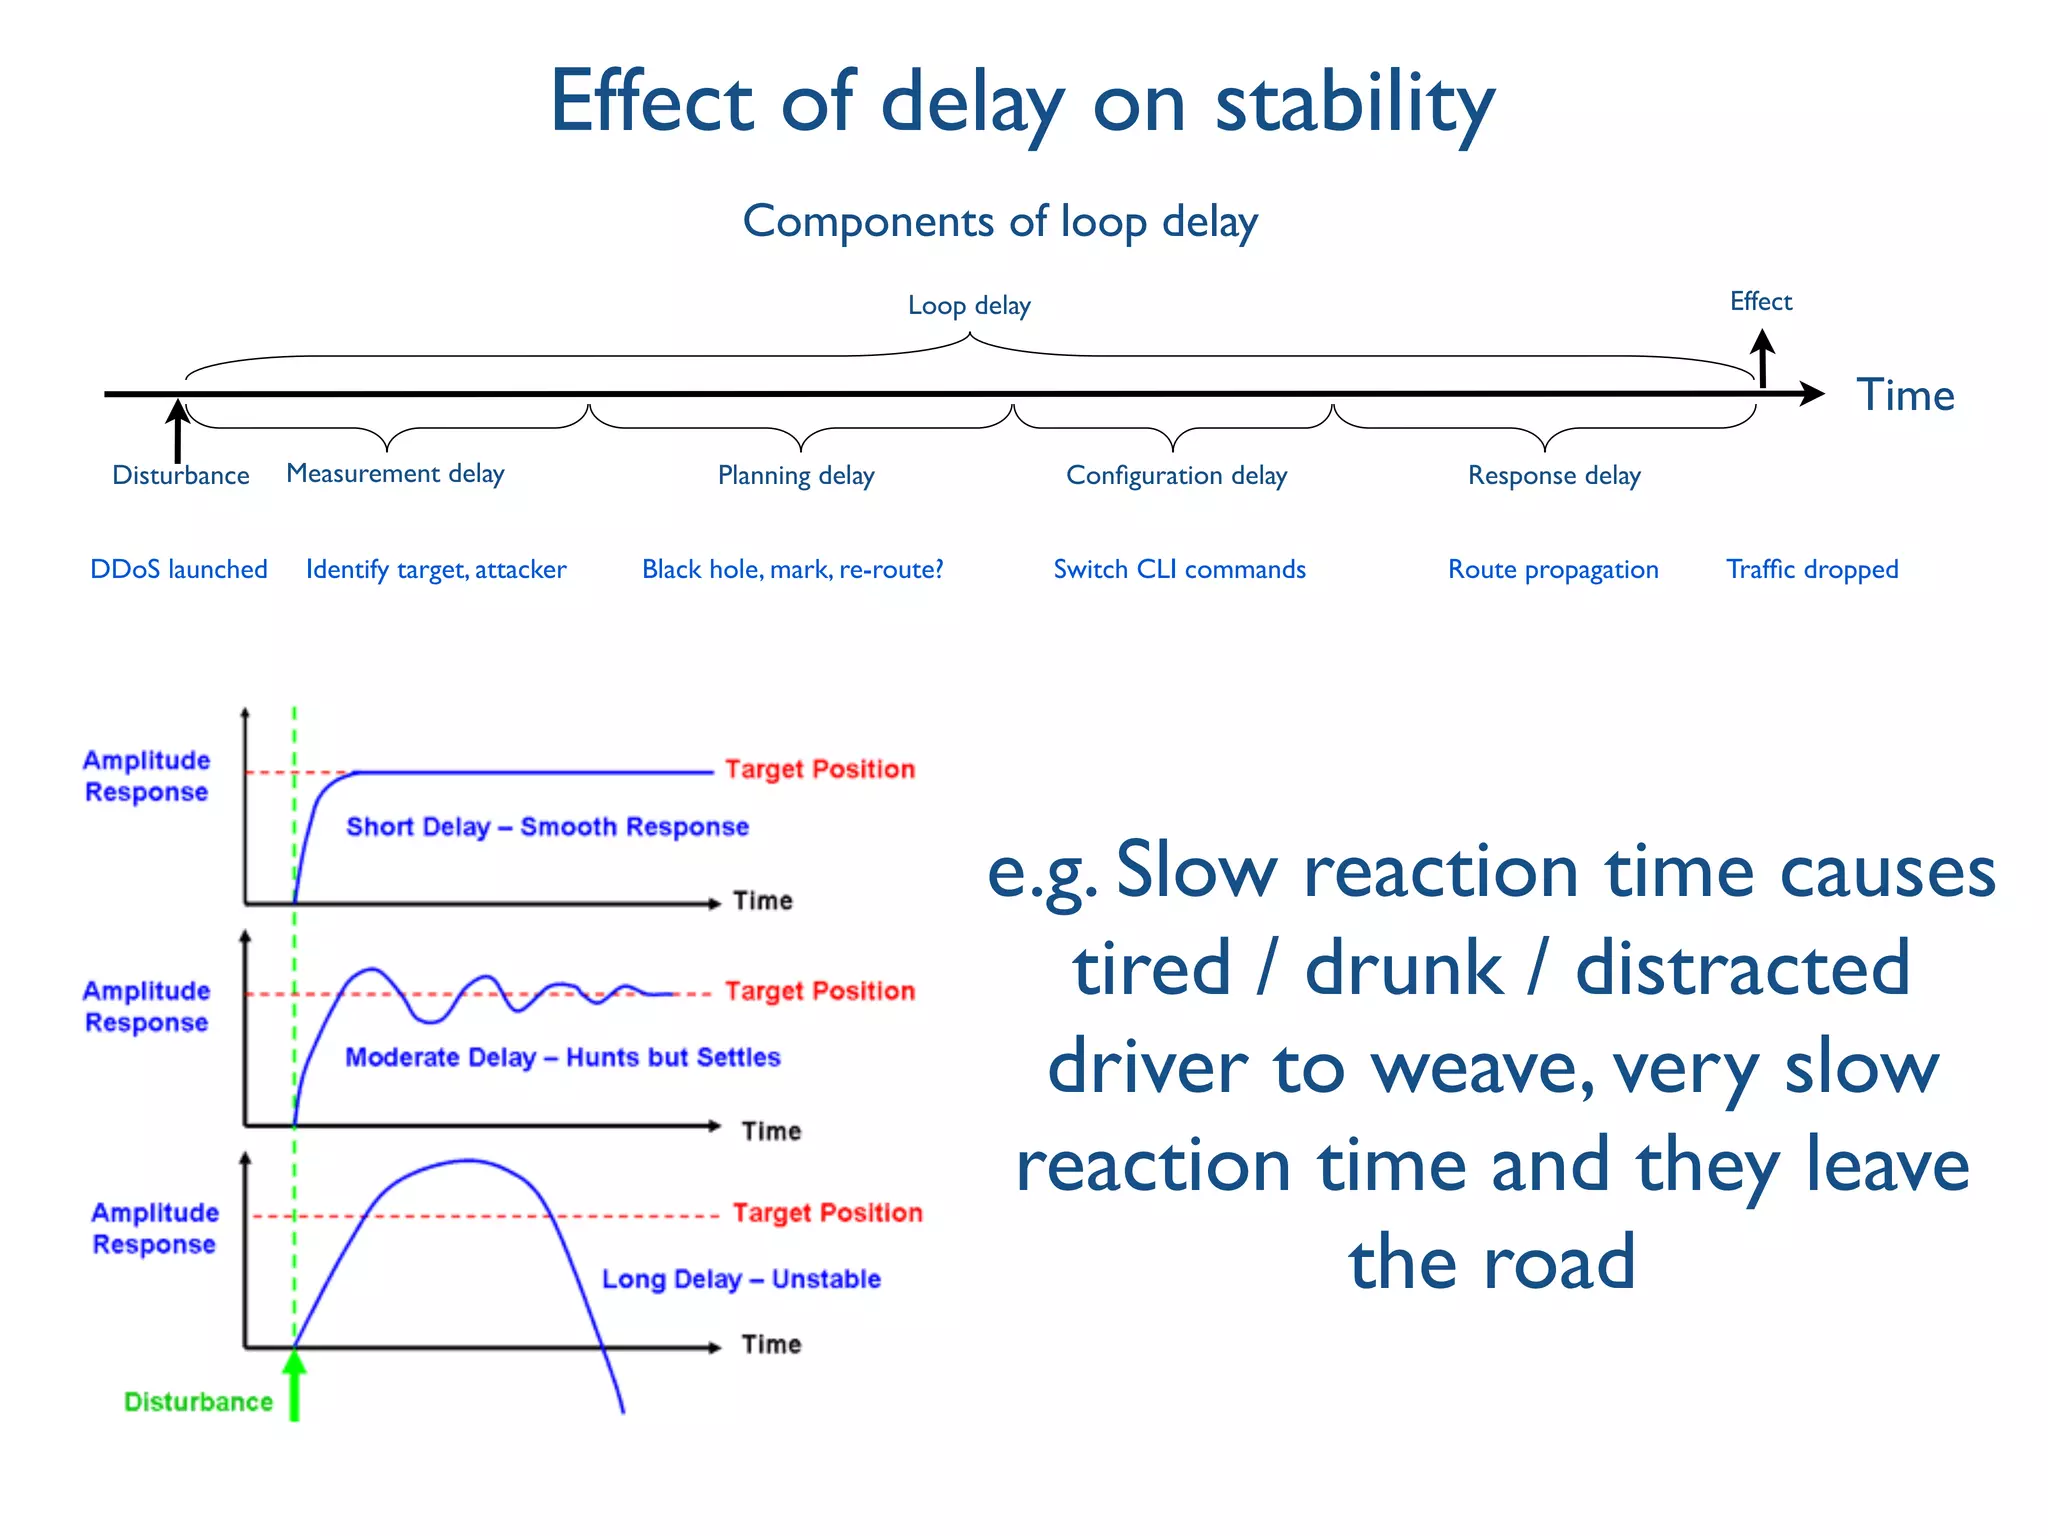
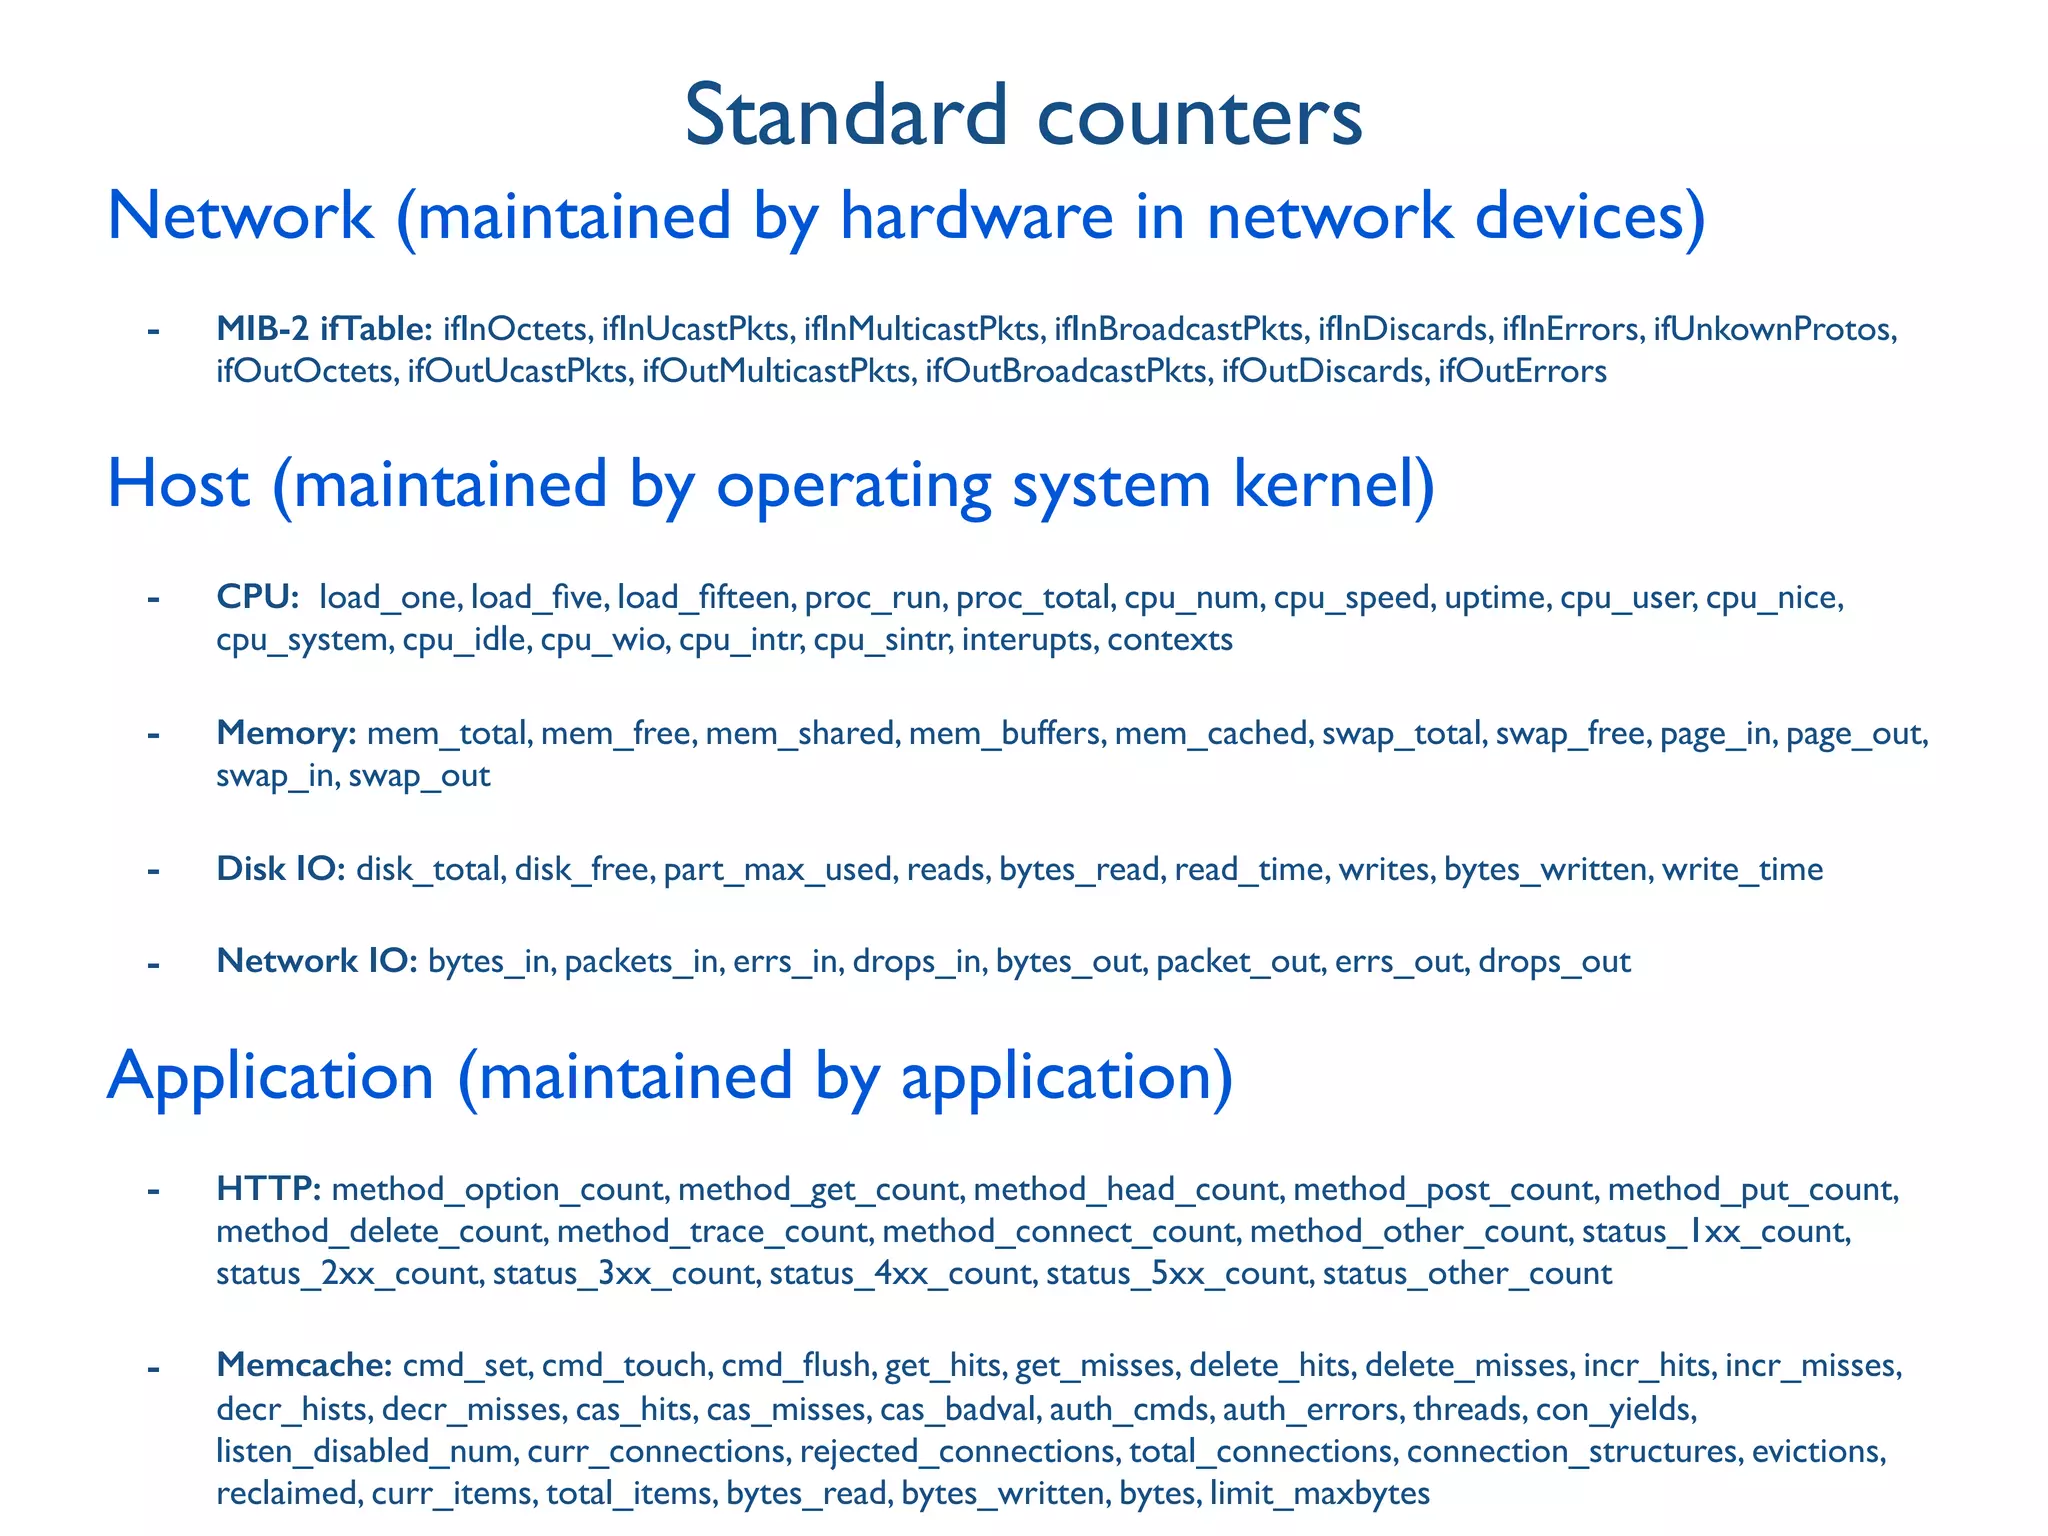
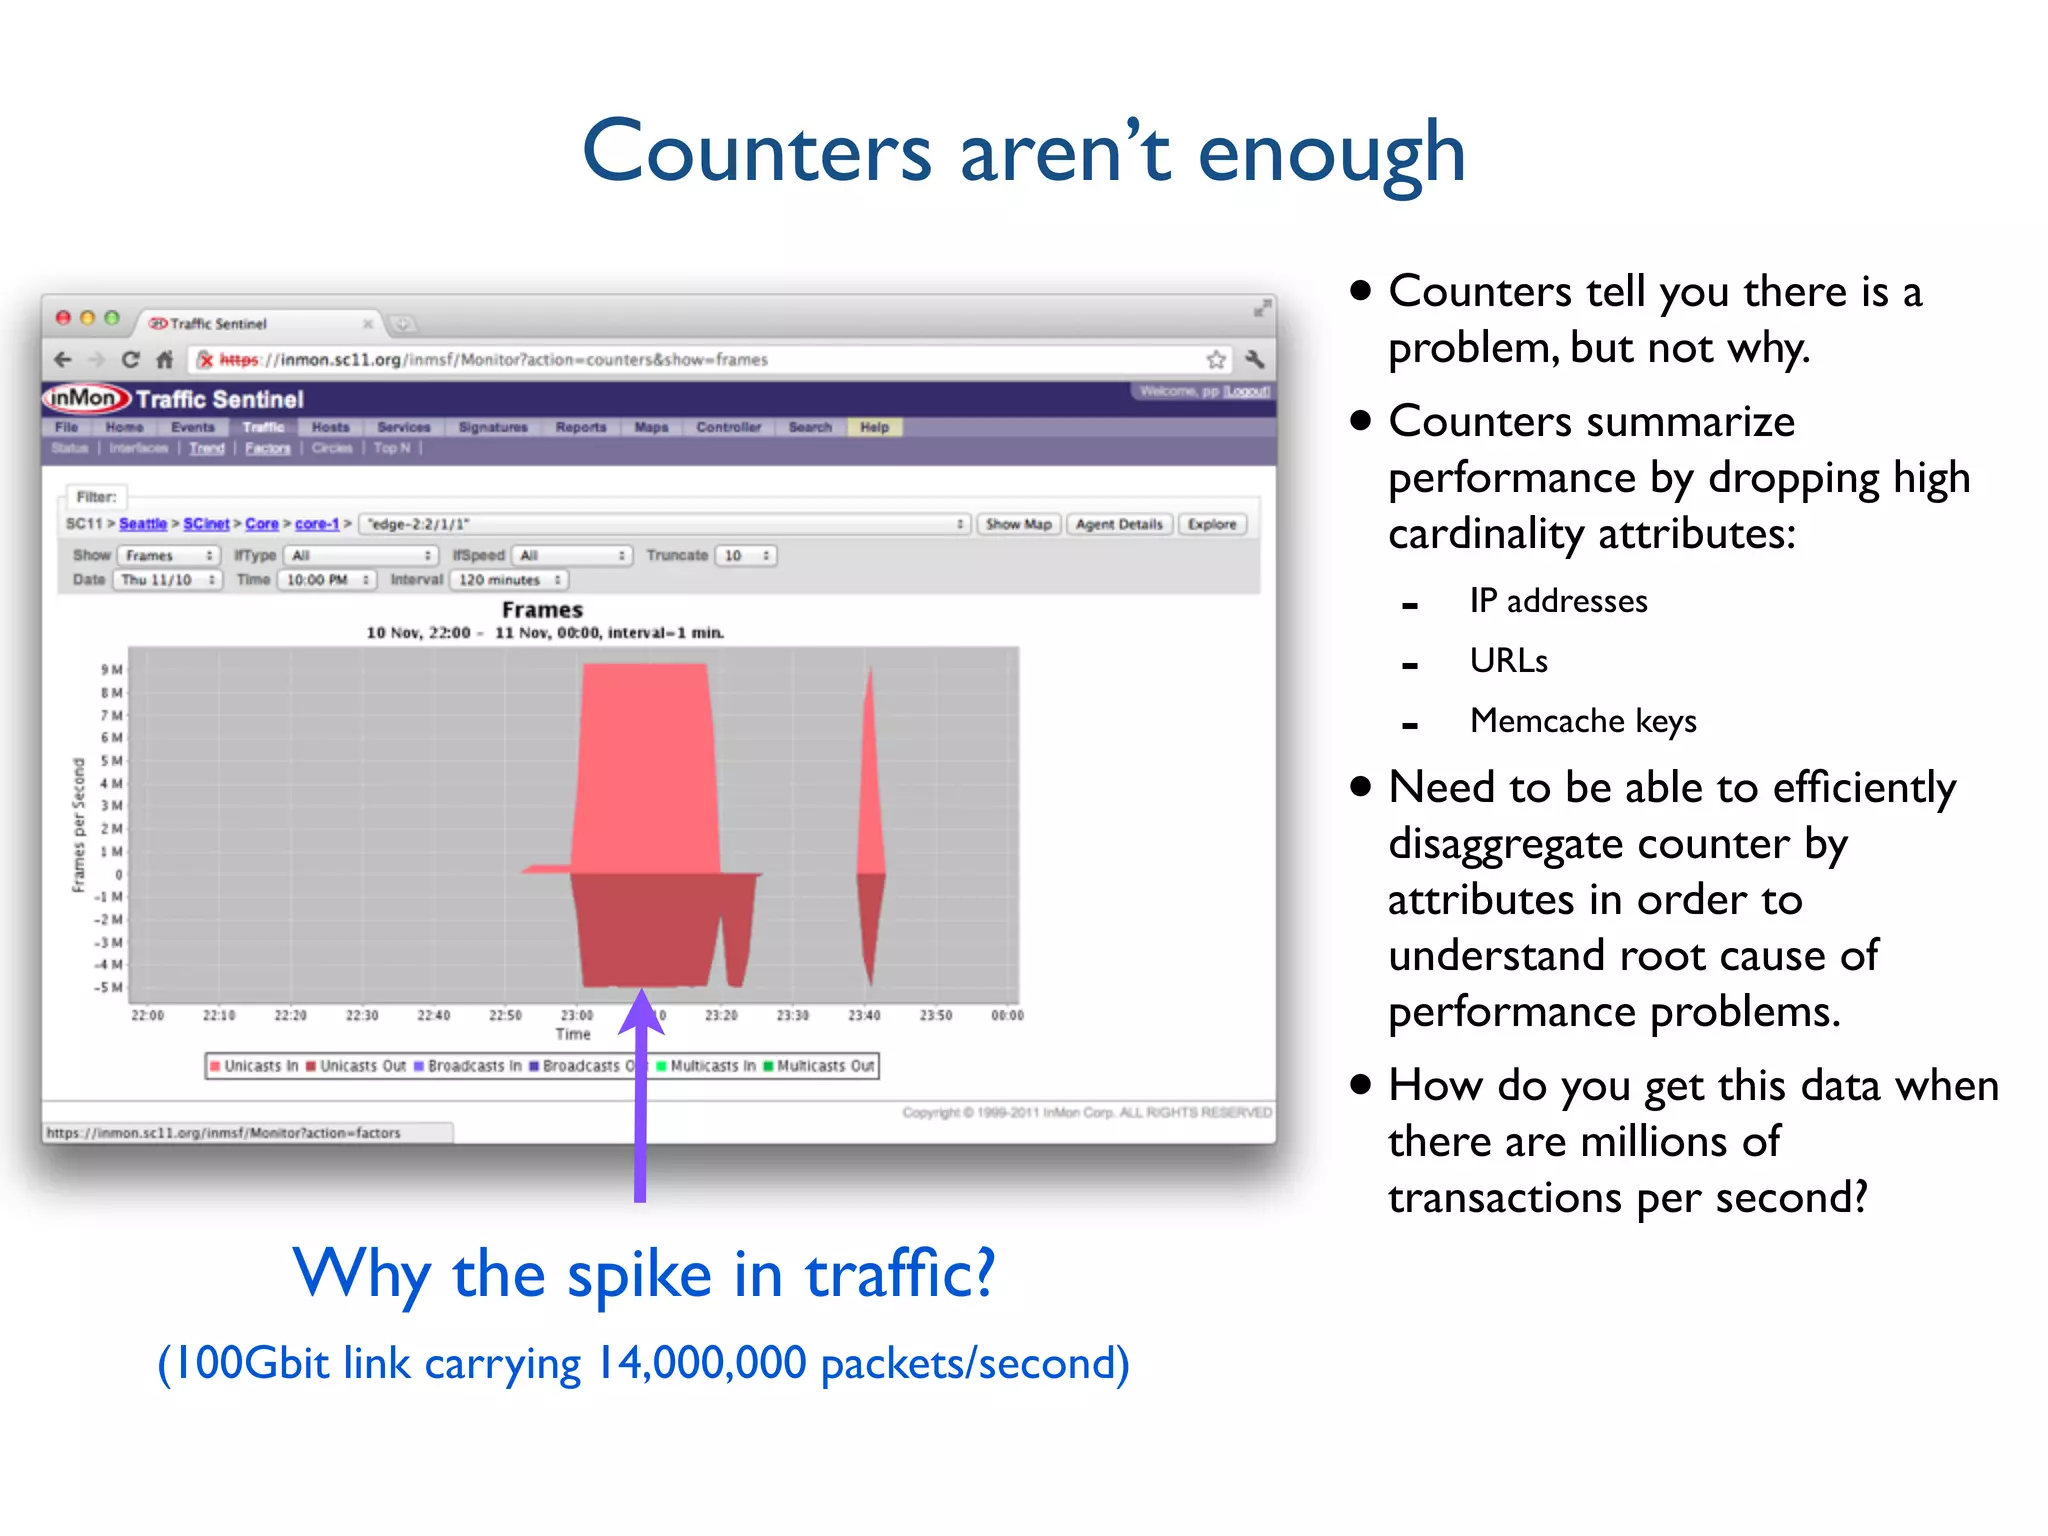
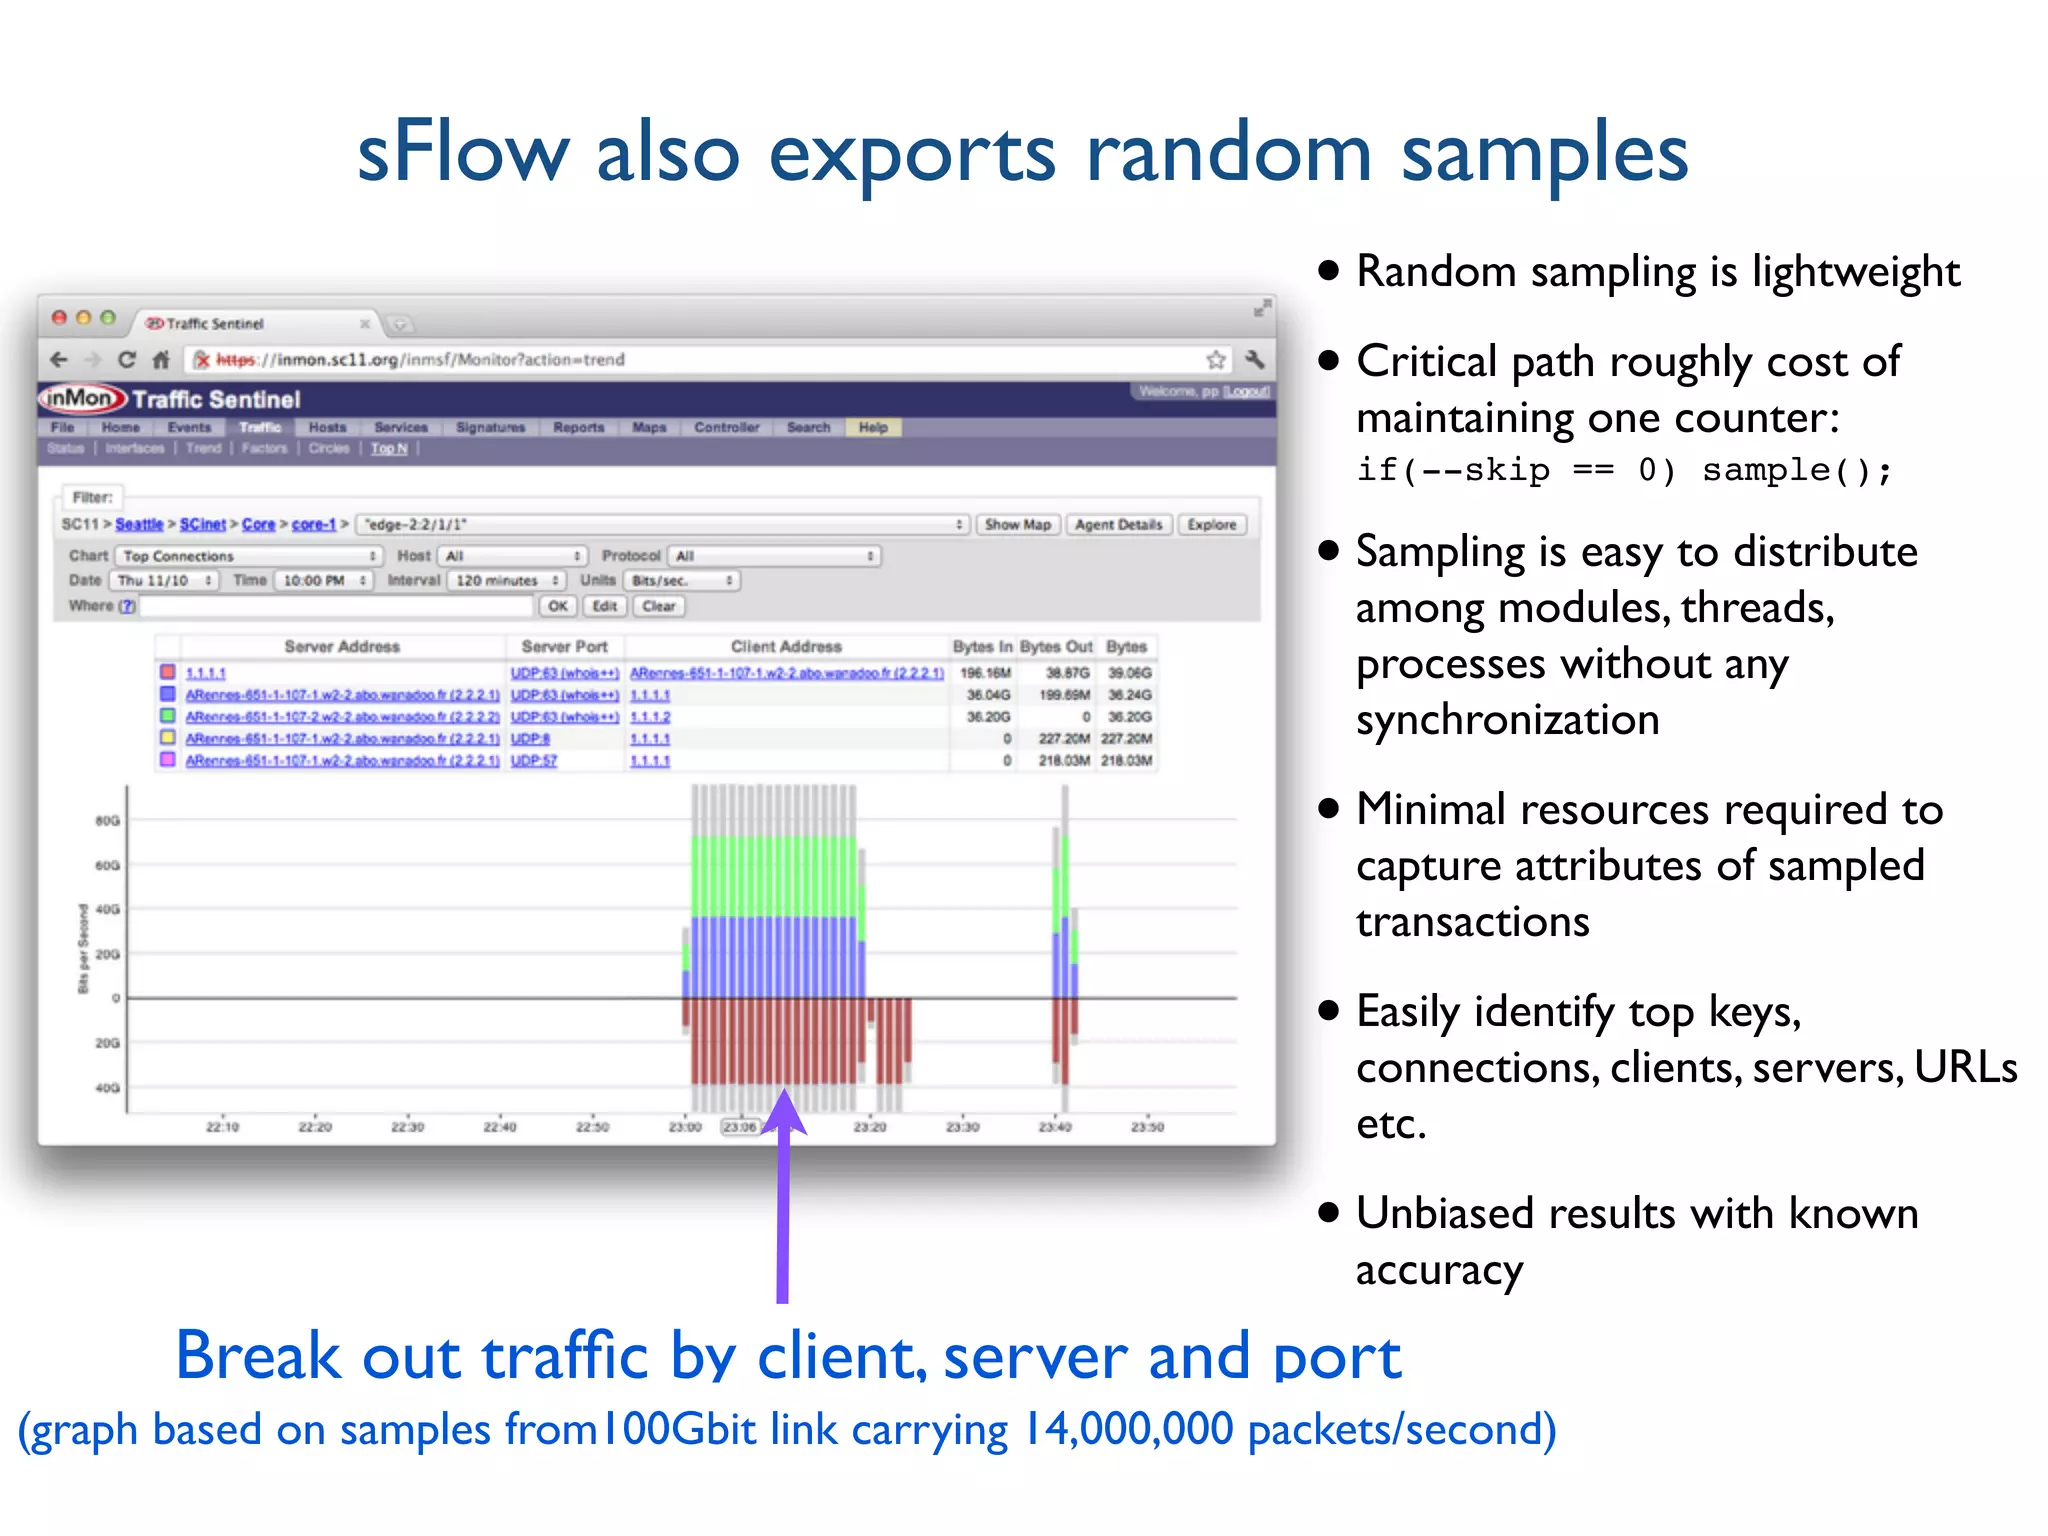
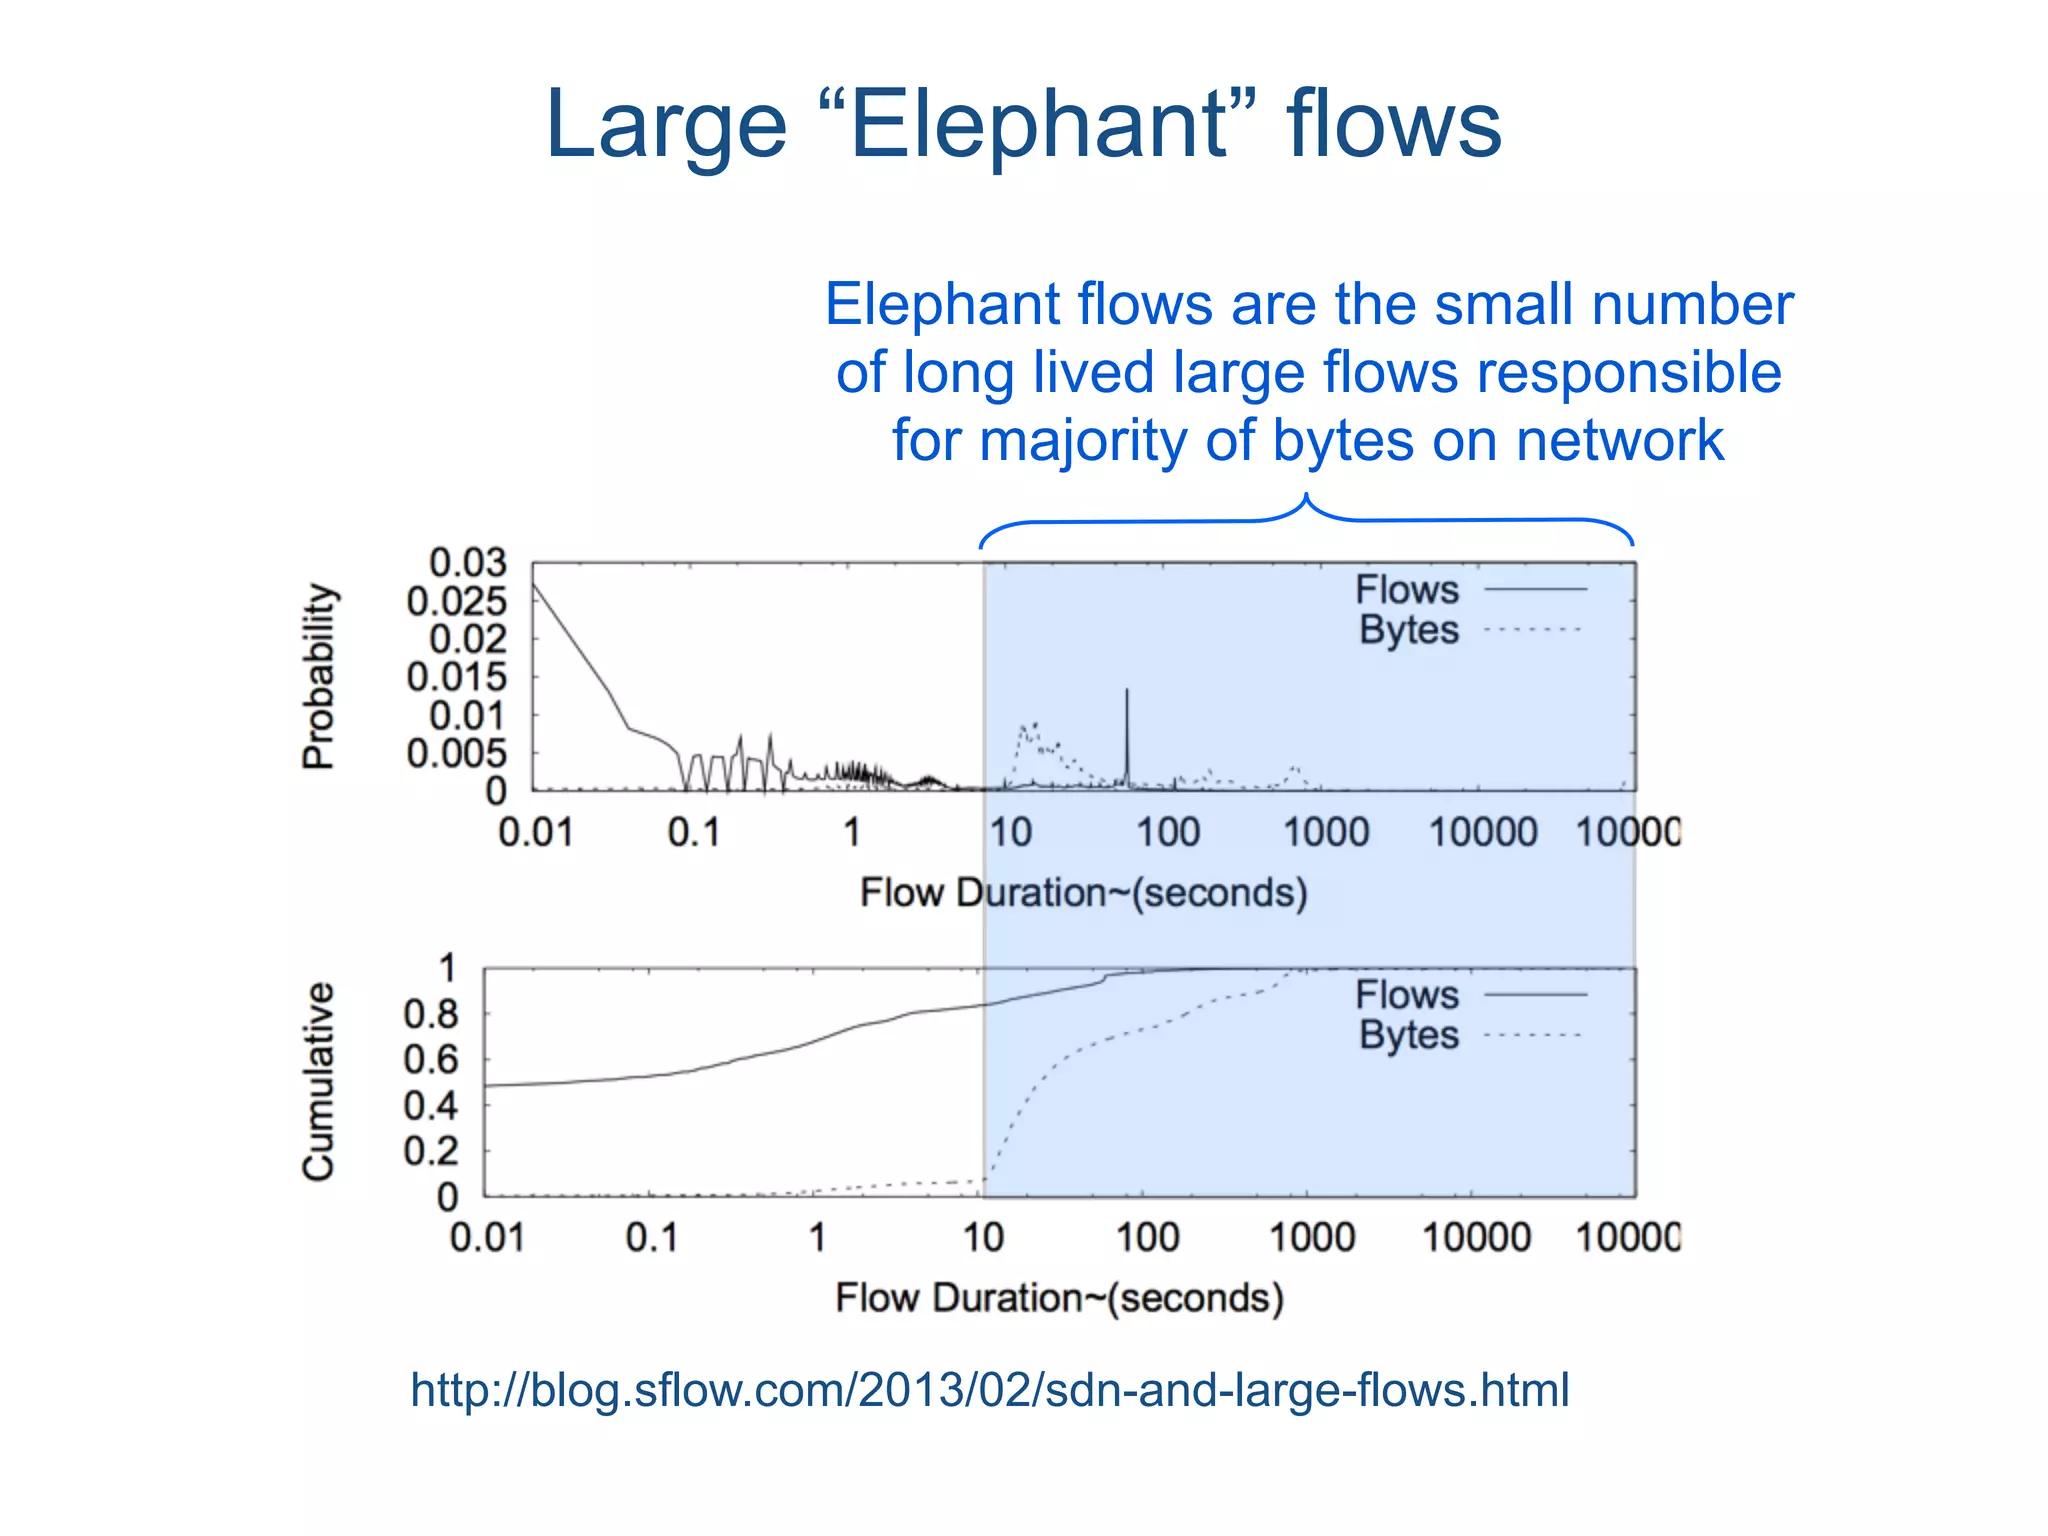
The document discusses the importance of network visibility and control using sFlow telemetry for effective monitoring and management of network performance. It highlights the principles of controllability and observability, the implementation of sFlow as an industry-standard measurement technology, and its integration into various systems for real-time analytics, particularly in mitigating DDoS attacks. The content underscores the necessity of accurate metrics and data aggregation to understand network performance issues, optimize resource allocation, and respond to network anomalies.


![RESTful API for defining flows
http://blog.sflow.com/2013/08/restflow.html
curl -H "Content-Type:application/json" -X PUT —data
'{"keys":"ipsource,ipdestination,tcpsourceport,tcpdestinationport",
"value":"bytes", "ipfixCollectors":["10.0.0.1"]}'
http://127.0.0.1:8008/flow/tcp/json
curl -H "Content-Type:application/json" -X PUT --data
'{"keys":"ipdestination,icmpunreachableport", "value":"frames"}'
http://127.0.0.1:8008/flow/unreachableport/json
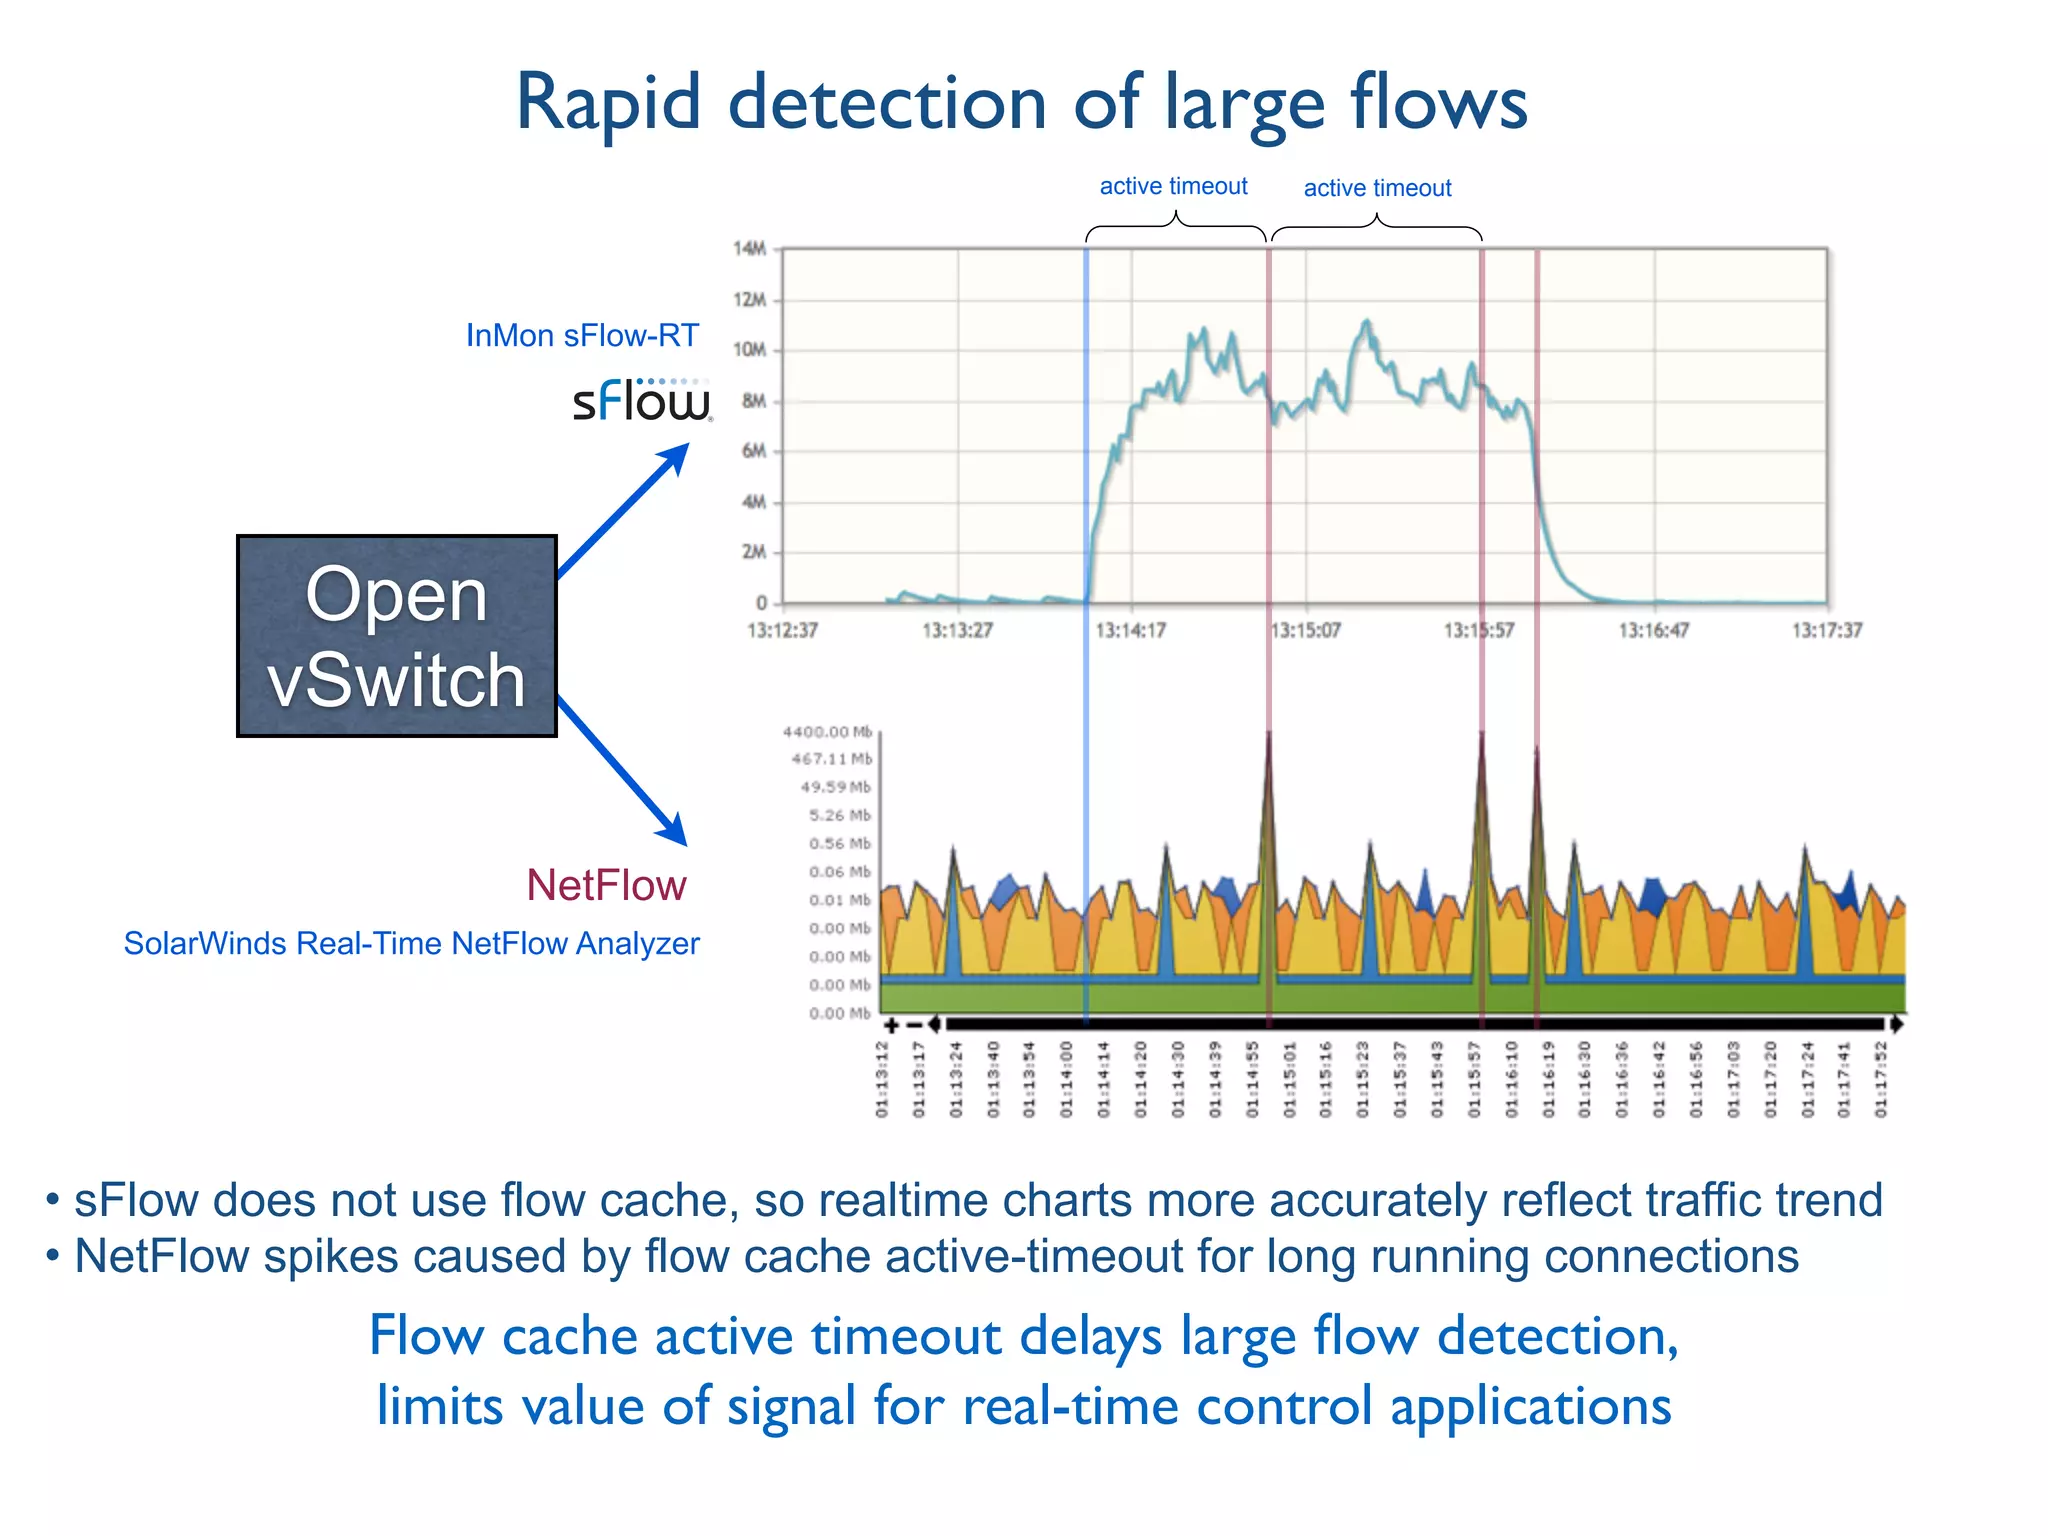
• Instantly enables network wide monitoring of flows
• All switches, all ports, including hosts and virtual switches
• Contrast with task of re-configuring Flexible Netflow/IPFIX caches on
every switch in multi-vendor network. How many simultaneous flow
definitions are allowed? What key / value combinations are allowed?
curl -H "Content-Type:application/json" -X PUT --data
'{"value":"frames"}'
http://127.0.0.1:8008/flow/frames/json](https://image.slidesharecdn.com/netvismeetup-160330051057/75/Network-visibility-and-control-using-industry-standard-sFlow-telemetry-21-2048.jpg)


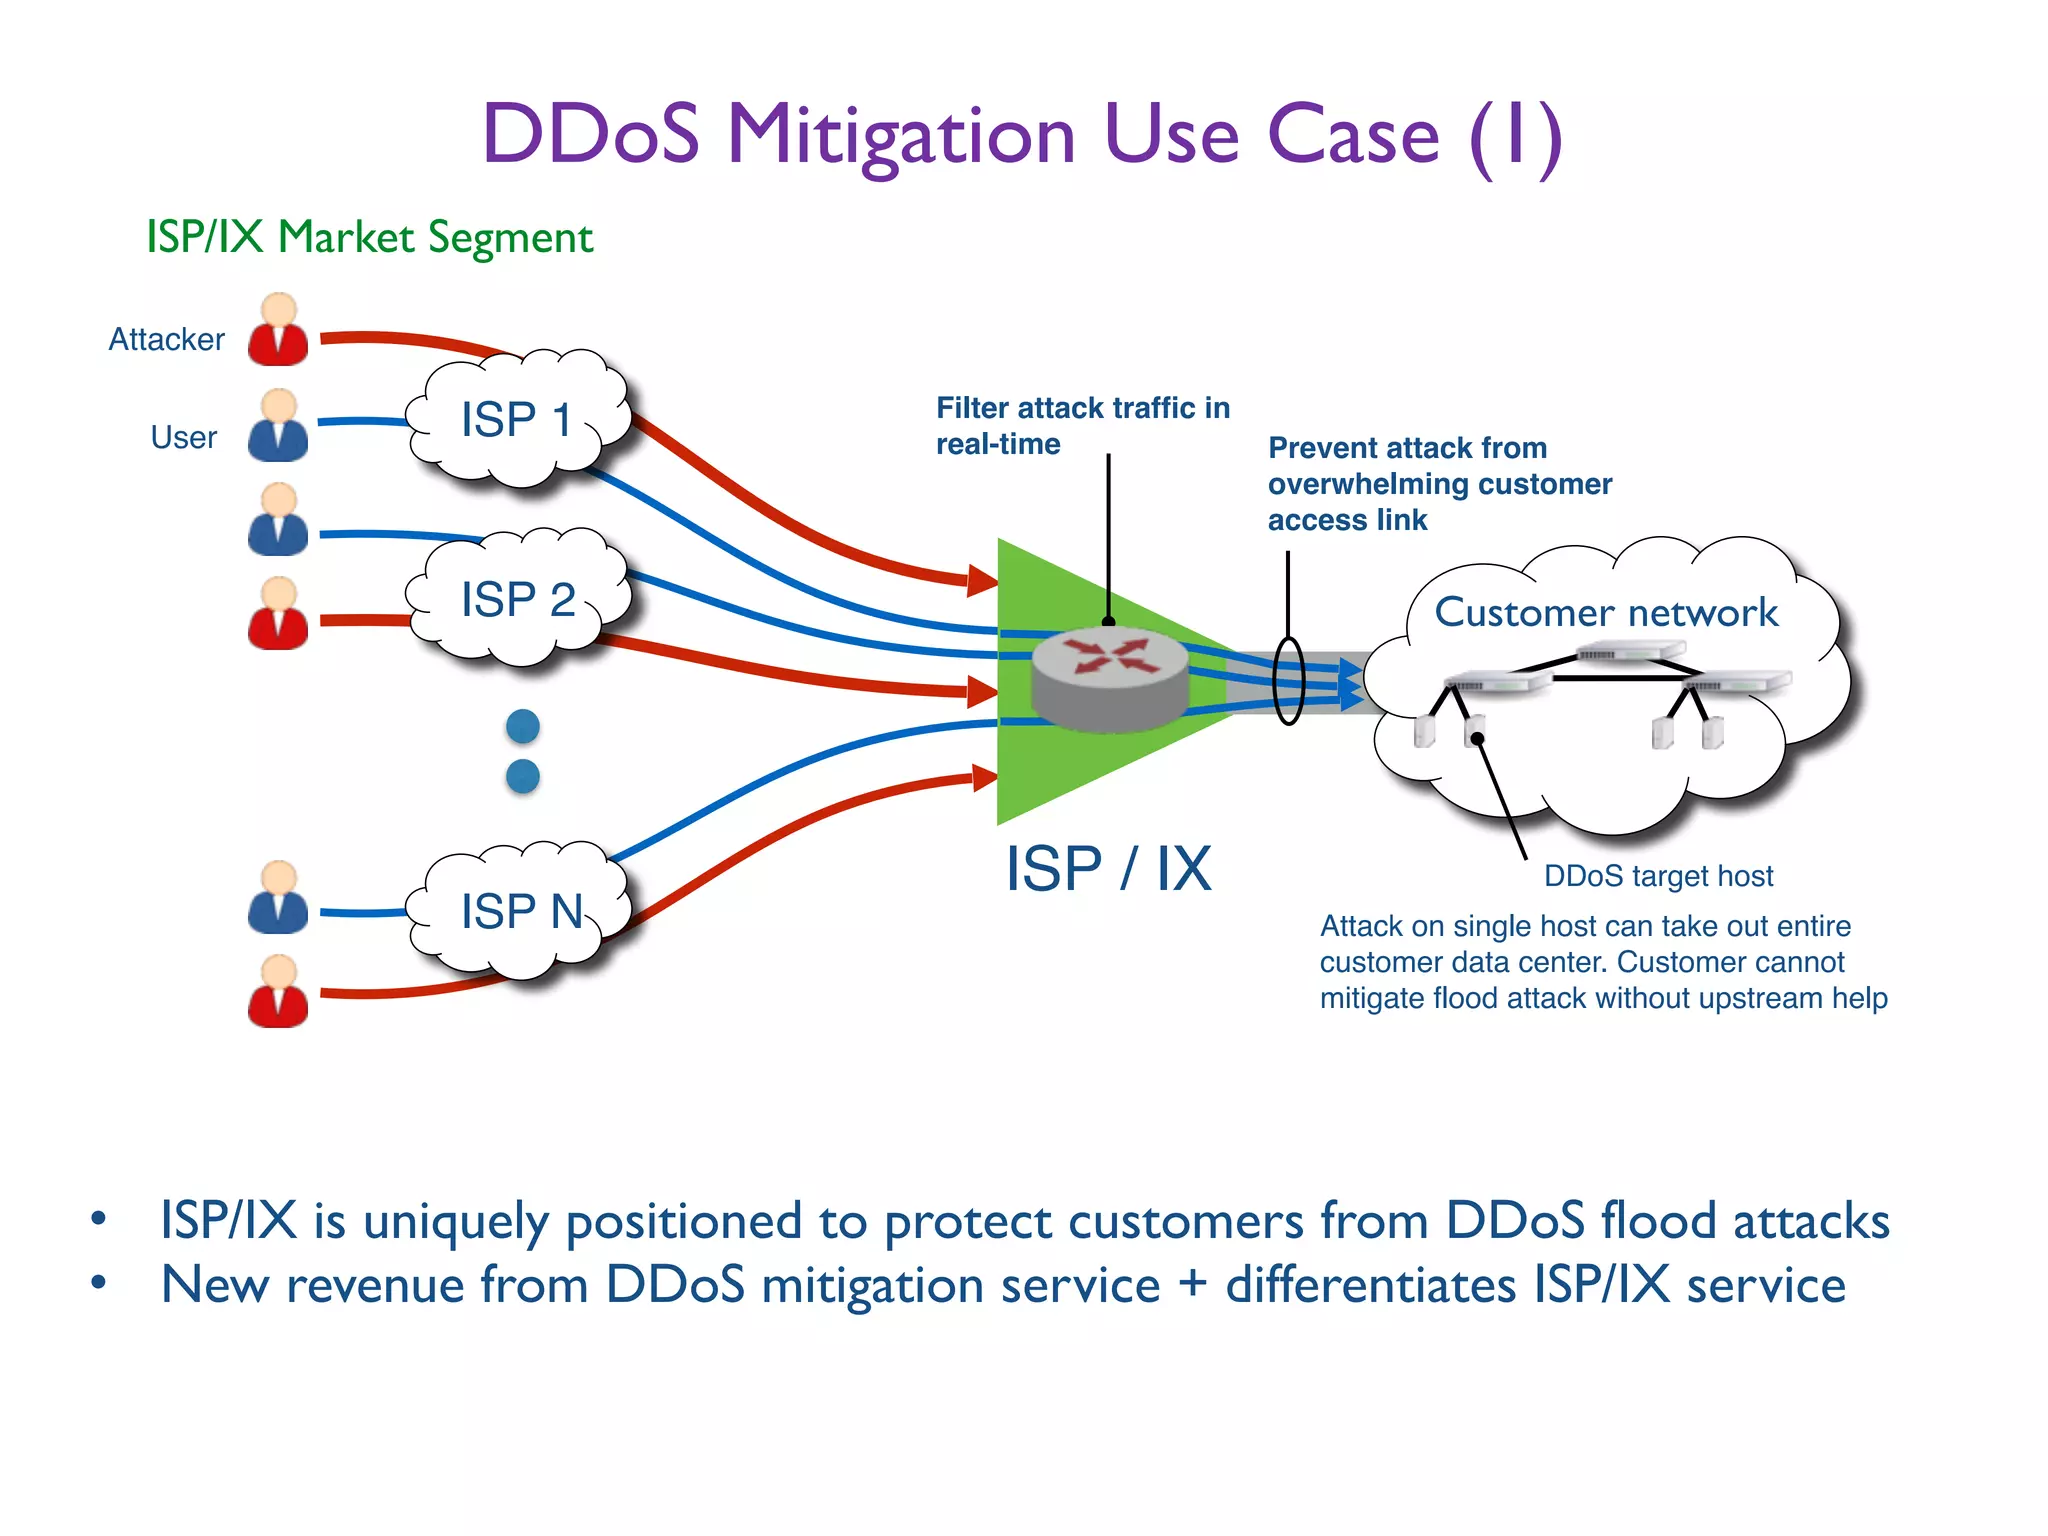
![DDoS Mitigation Market Opportunity
DDoS Attack Megatrends [Reference 1]
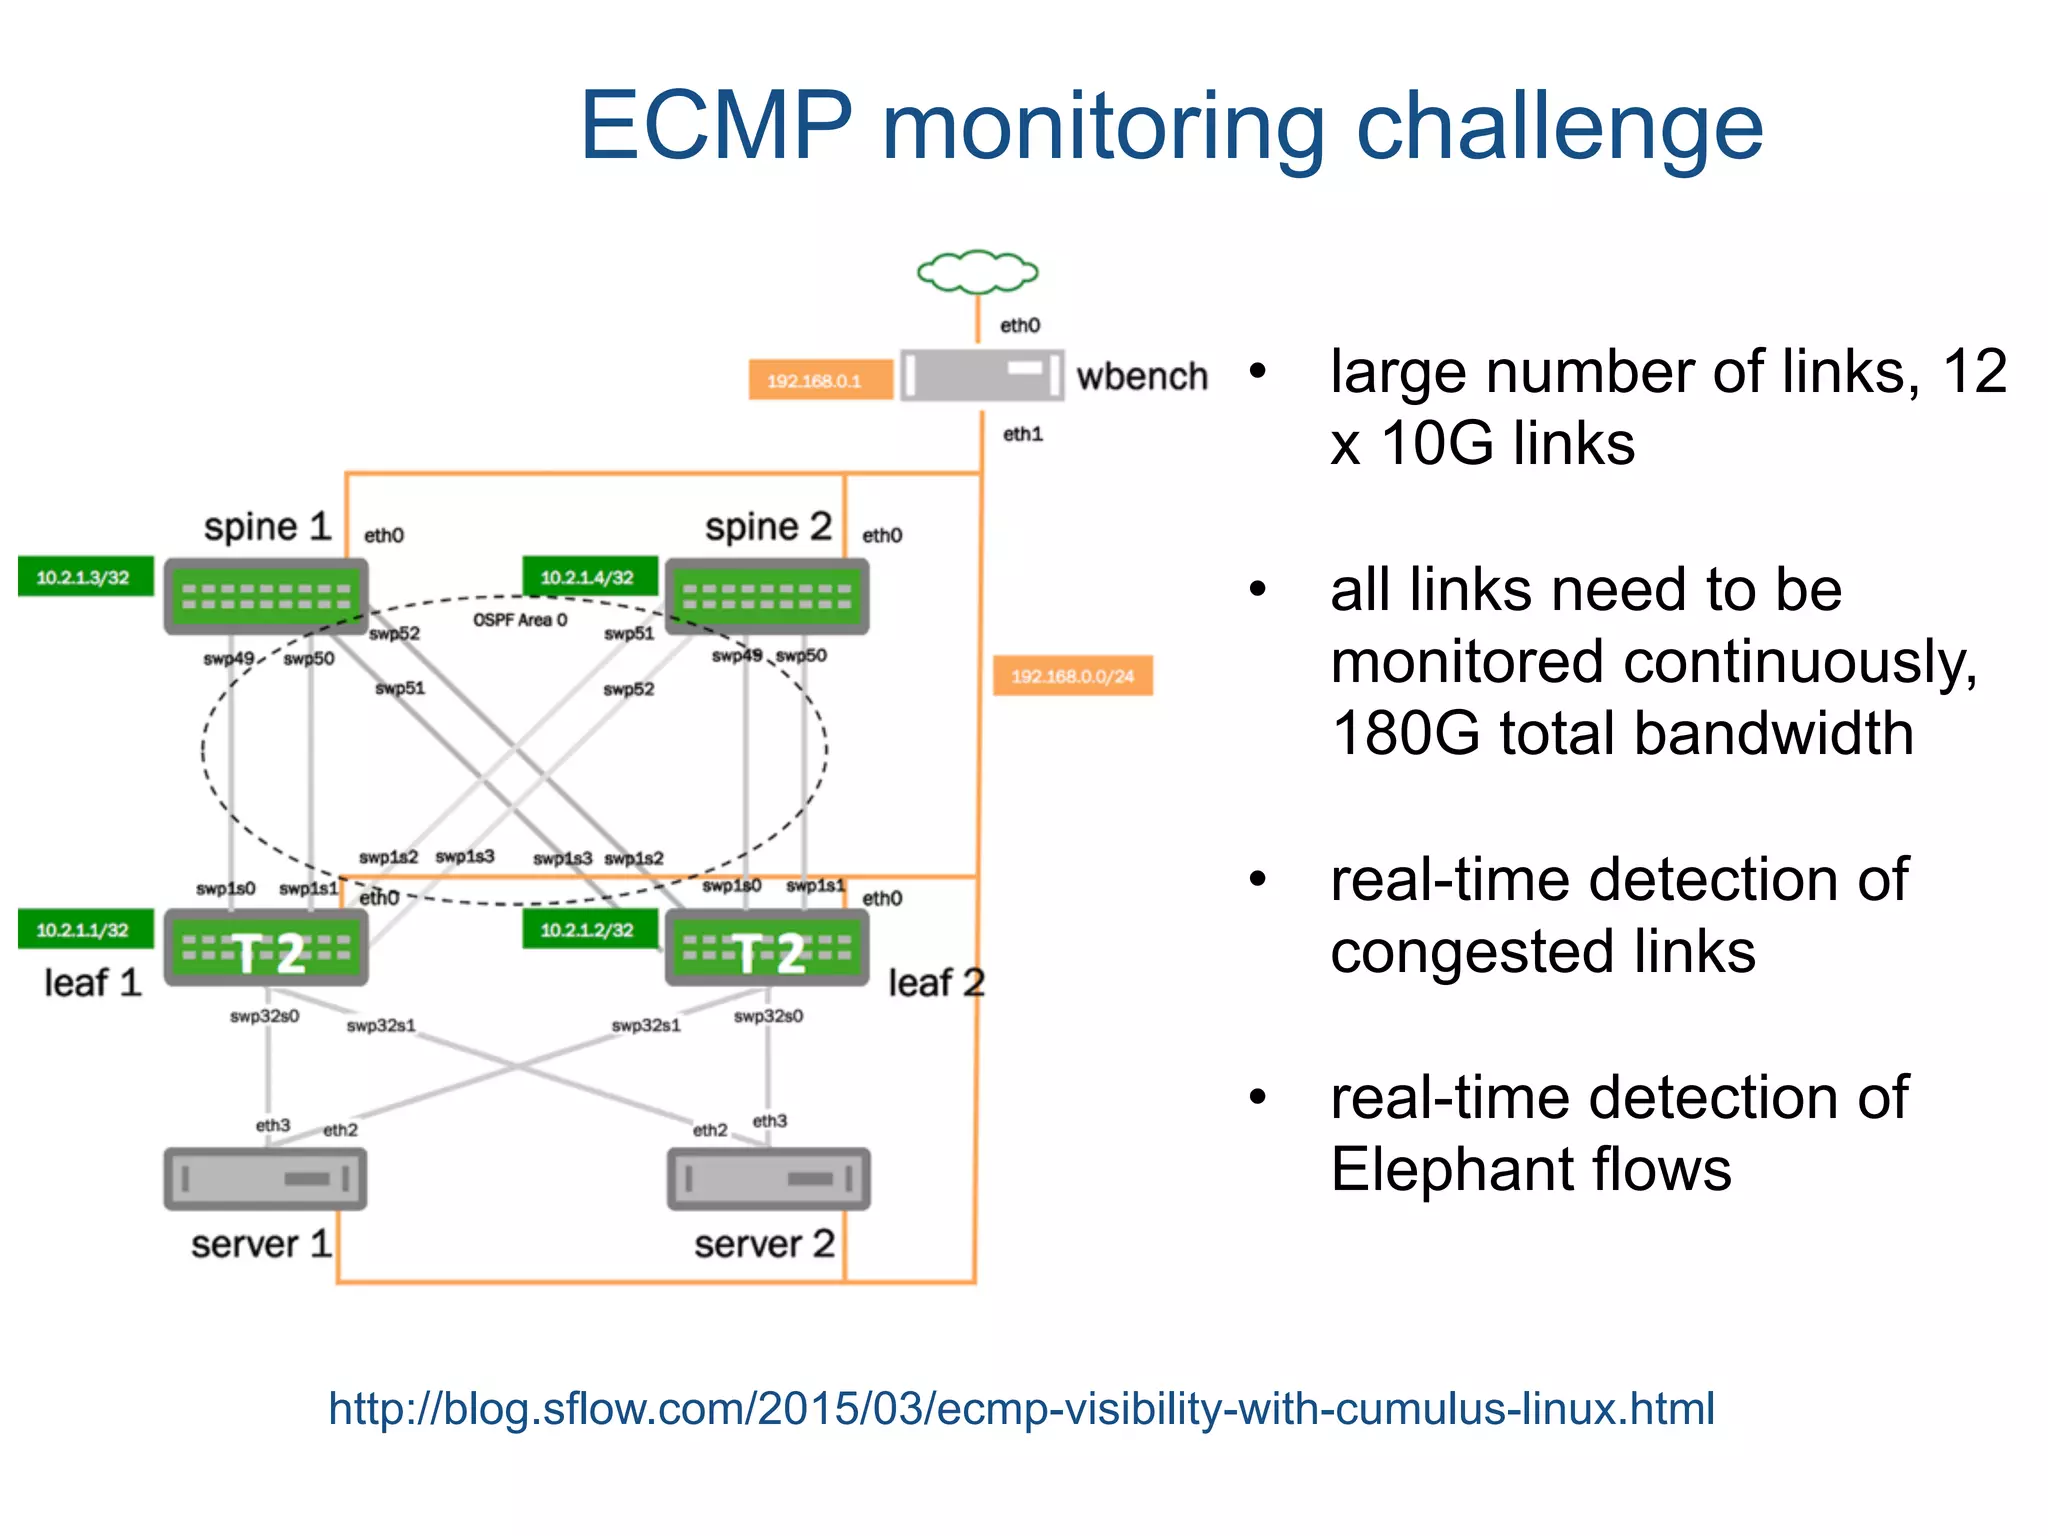
• High bandwidth, volumetric infrastructure layer (Layer 3 & 4) attacks increased
approximately 30 percent
• DDoS attack volume also increased month-to-month in 2013, with 10 out of
12 months showing higher attack volume compared to 2012
• Average DDoS attack sizes continued to increase – many over 100 Gbps, the
largest peaking at 179 Gbps
DDoS Mitigation Market Growth
• $870M market by 2017, 18.2% CAGR – Source: IDC:Worldwide DDoS Prevention
Products and Services 2013-2017 Forecast
• $1049M market by 2017, 25% CAGR – Source: Infonetics: Global DDoS Prevention
Appliances 2012-2017 Forecast
Reference 1: Top DDoS Attack Trends http://www.itbriefcase.net/top-ddos-attack-trends-for-2013](https://image.slidesharecdn.com/netvismeetup-160330051057/75/Network-visibility-and-control-using-industry-standard-sFlow-telemetry-48-2048.jpg)
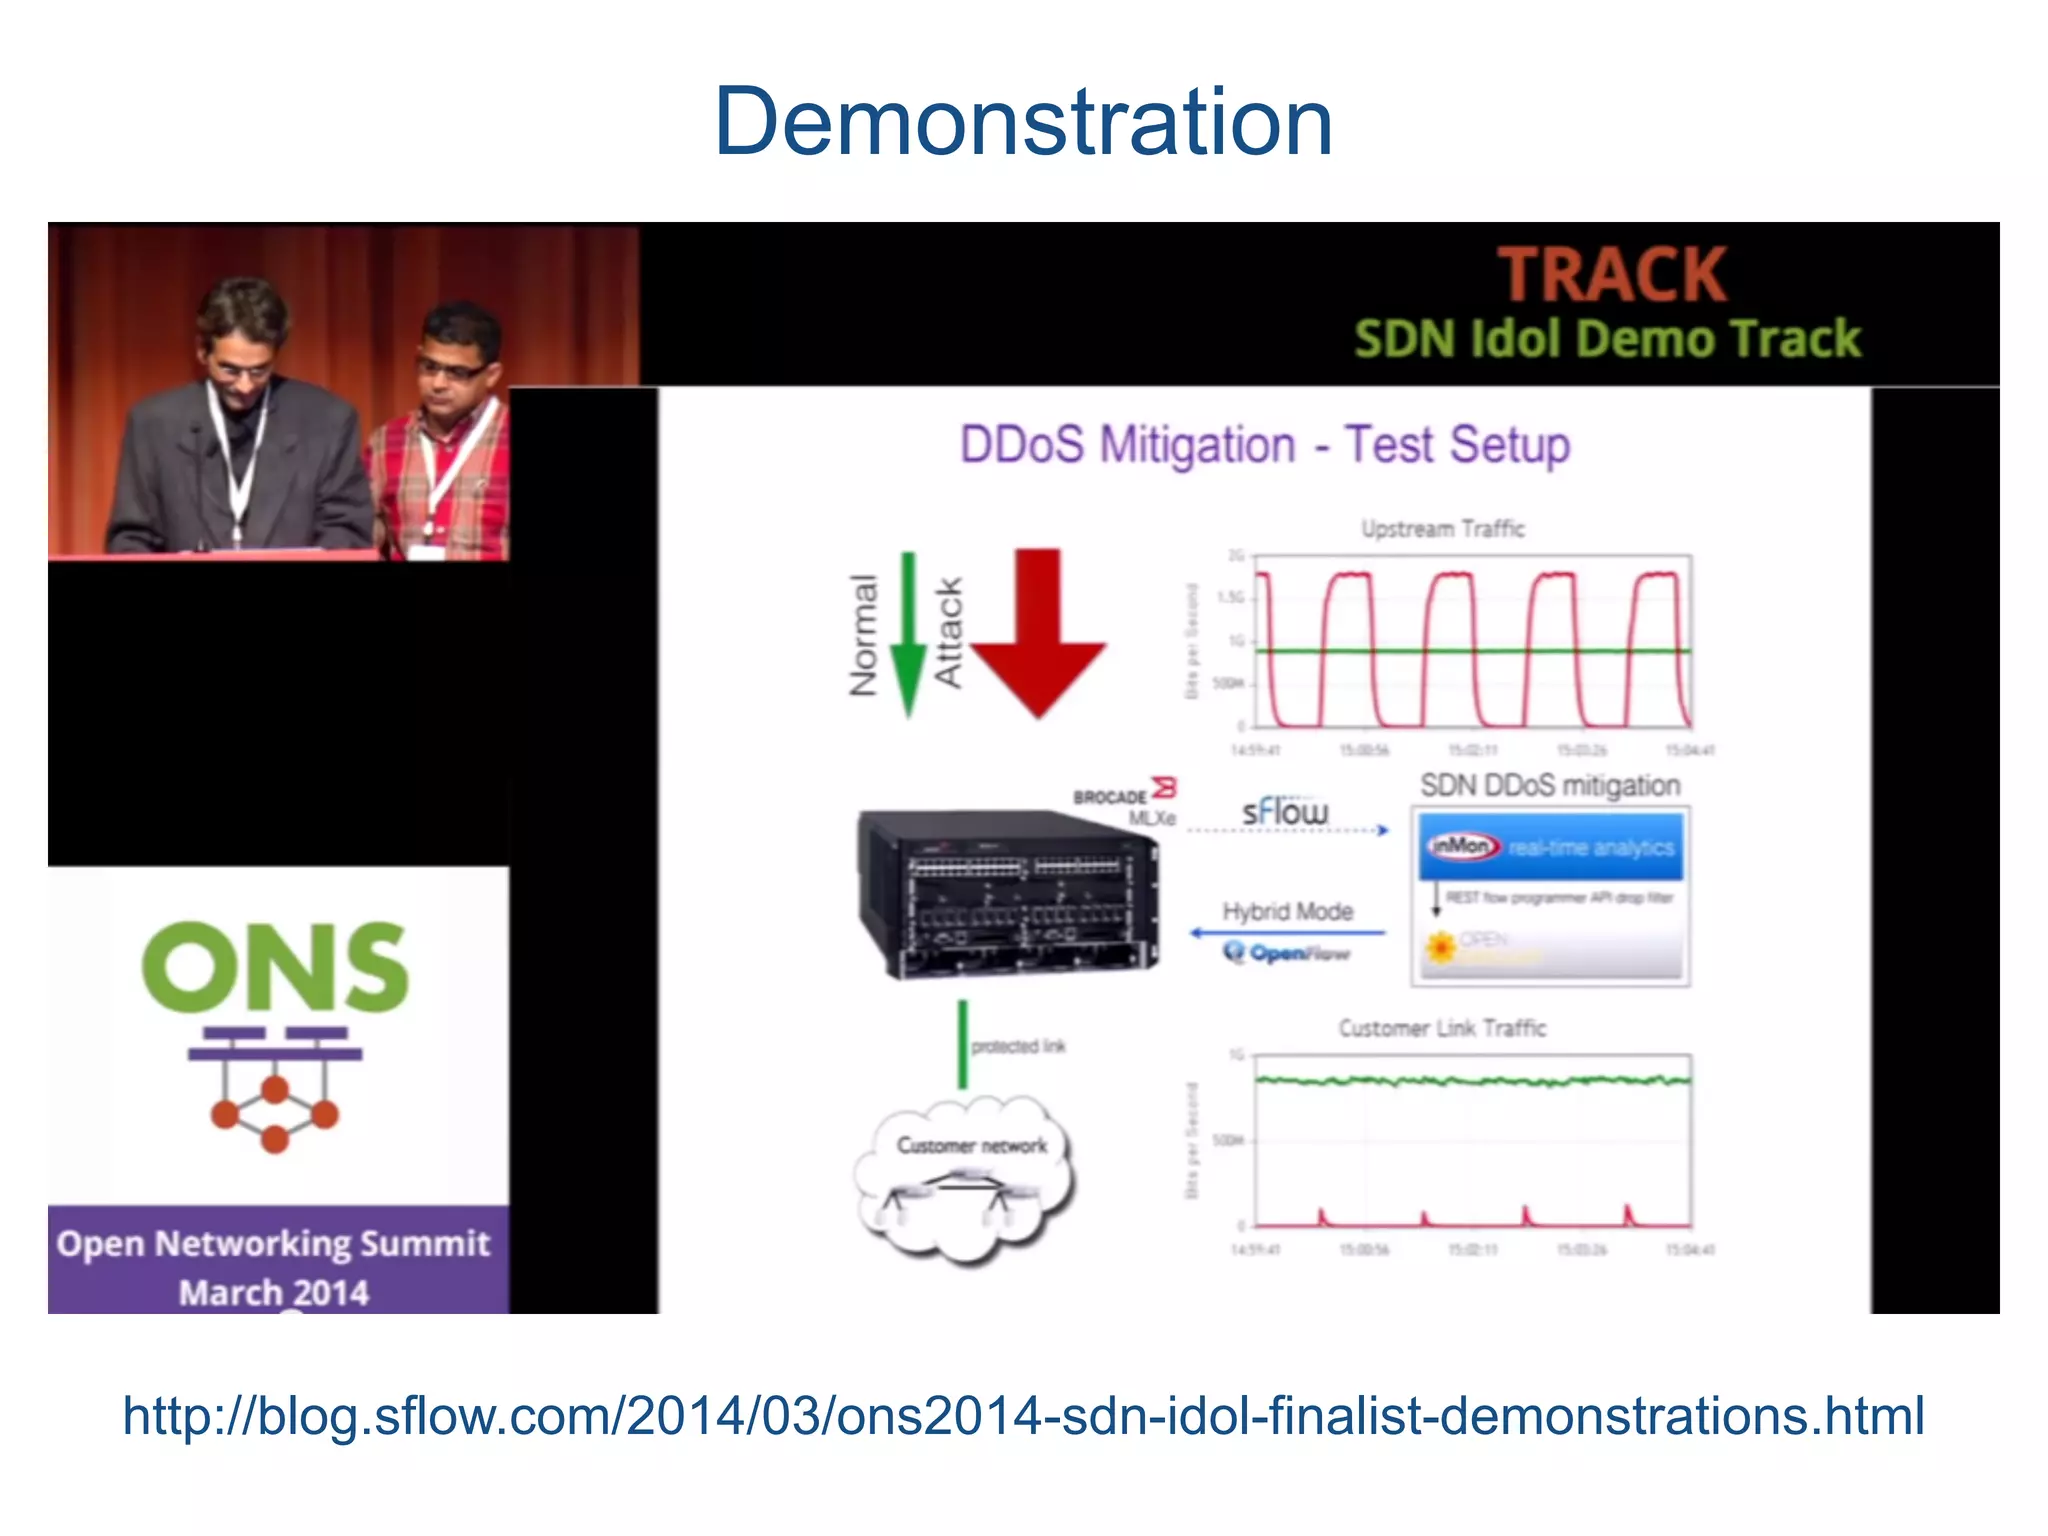
![Customer
portal
DDoS Mitigation Service
Web UI + RESTful programmatic API
• real-time TopN analytics
• programmable filtering of traffic
• set thresholds + automatic blocking
Real-time sFlow visibility, Hybrid OpenFlow Control capability of Brocade switches/routers
REST API
InMonsFlow-RT
REST API
OpenFlowController
DDoS Mitigation
Application
Customer
Network
Internet
1. Flood
attack
overloads
customer
port
2. Attack maps to large flows
[Ref. 2]. sFlow-RT detects
attack (maps to large flows)
and characterizes attack
(srcip, dstip, protocol, ports,
etc.)
3. mitigation application takes signature, applies
customer policy, selects optimal control and push
OpenFlow rule(s) to switch(es)
5. OpenFlow rule(s)
applied to switch
forwarding path to drop /
mark traffic and protect link
HTTPS HTTPS
4. Controller pushes
OpenFlow rule(s) to
switch(es)
OpenFlow 1.3 Match Fields
line rate filtering using Brocade switches
Reference 2: IETF I2RS Working Group Draft - https://ietf.org/doc/draft-krishnan-i2rs-large-flow-use-case/](https://image.slidesharecdn.com/netvismeetup-160330051057/75/Network-visibility-and-control-using-industry-standard-sFlow-telemetry-50-2048.jpg)


![SDN Demystified, by Dean Pemberton [APNIC 38]](https://cdn.slidesharecdn.com/ss_thumbnails/sdndemystified1410925639-140917000156-phpapp02-thumbnail.jpg?width=640&height=640&fit=bounds)


![[DSC Europe 25] Dusan Jovicic - AI Story: From on-prem to cloud and back agai...](https://cdn.slidesharecdn.com/ss_thumbnails/8kp49m6uq22ifnbwhfnk-2-251205085715-964d11a6-thumbnail.jpg?width=640&height=640&fit=bounds)


![[DSC Europe 25] Vid Stimac - Policy Parsimony: Between Oversimplifying and Ov...](https://cdn.slidesharecdn.com/ss_thumbnails/eqlepagzqp2rhg3gbluh-dsc-stimac-251120-251205090438-059e7f54-thumbnail.jpg?width=640&height=640&fit=bounds)
![[DSC Europe 25] Nikola Rajovic - Hardware Technologies Under the Hood: RISC-V...](https://cdn.slidesharecdn.com/ss_thumbnails/o2gptrmtoyqndgoshwgq-dsc2025-tenstorrent-rajovic-251205090438-814685f5-thumbnail.jpg?width=640&height=640&fit=bounds)


![[DSC Europe 25] Marija Vlajkovic & Andrea Radonjanin - Integration of AI tool...](https://cdn.slidesharecdn.com/ss_thumbnails/qf1jrglttoc3bm8s3aop-final-integration-of-ai-tools-251208151905-394f3a6a-thumbnail.jpg?width=640&height=640&fit=bounds)

![[DSC Europe 25] Jim Sterne - Adopting Generative AI Capabilities Into the Ent...](https://cdn.slidesharecdn.com/ss_thumbnails/sxhpofuorcagxsaulkmt-3-251204082258-7e66bc48-thumbnail.jpg?width=640&height=640&fit=bounds)


