Water investment domains for sustainable agricultural development in the Blue Nile basin
•
0 likes•696 views

This document analyzes water investment opportunities in the Blue Nile basin of Ethiopia. It divides the basin into six Water Investment Domains based on soil moisture levels (no limitations, sufficient, or limited) and market access (close or remote). Close domains with no moisture limitations and sufficient moisture have the highest agricultural potential and population densities. The document recommends targeted rainwater management interventions to optimize crop growth and livestock resilience based on the soil moisture level and system in each domain.
Recommended

Recommended
More Related Content
What's hot
What's hot (19)
Viewers also liked
Viewers also liked (9)
Similar to Water investment domains for sustainable agricultural development in the Blue Nile basin
Similar to Water investment domains for sustainable agricultural development in the Blue Nile basin (20)
More from International Water Management Institute (IWMI)
More from International Water Management Institute (IWMI) (20)
Recently uploaded
Recently uploaded (20)
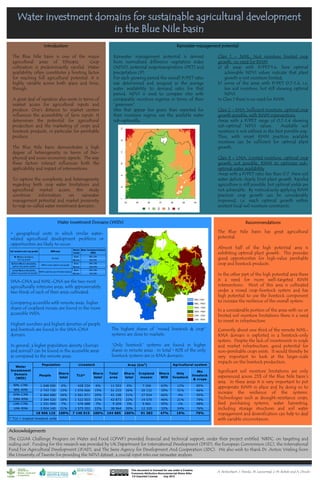
Water investment domains for sustainable agricultural development in the Blue Nile basin
- 1. Water investment domains for sustainable agricultural development in the Blue Nile basin Recommendations The Blue Nile basin has great agricultural potential. Almost half of the high potential area is exhibiting optimal plant growth. This provides good opportunities for high-value perishable crop and livestock products. In the other part of the high potential area there is a need for more well-targeted RWM interventions. Most of this area is cultivated under a mixed crop-livestock system and has high potential to use the livestock component to increase the resilience of the overall system. In a considerable portion of the areas with no or limited soil moisture limitations there is a need to invest in infrastructure. Currently about one third of the remote NML- RMA domain is exploited in a livestock-only system. Despite the lack of investments in roads and market infrastructure, good potential for non-perishable crops exists. It would thereby be very important to look at the larger-scale impacts on the livestock production. Significant soil moisture limitations are only experienced across 25% of the Blue Nile basin’s area. In these areas it is very important to put appropriate RWM in place and by doing so to increase the resilience of the systems. Technologies such as drought-resistance crops, feed purchasing systems, water harvesting, including storage structures and soil water management and diversification can help to deal with variable circumstances. A. Notenbaert, J. Heinke, M. Lannerstad, L-M. Rebelo and A. Omolo Introduction The Blue Nile basin is one of the major agricultural areas of Ethiopia. Crop cultivation is predominantly rainfed. Water availability often constitutes a limiting factor for reaching full agricultural potential. It is highly variable across both space and time, though. A great deal of variation also exists in terms of market access for agricultural inputs and produce. One’s distance to market centers influences the accessibility of farm inputs. It determines the potential for agricultural production and the marketing of crops and livestock products, in particular for perishable produce. The Blue Nile basin demonstrates a high degree of heterogeneity in terms of bio- physical and socio-economic aspects. The way these factors interact influences both the applicability and impact of interventions. To capture the complexity and heterogeneity regarding both crop water limitations and agricultural market access, this study combines information on rainwater management potential and market proximity to map so-called water investment domains . The highest shares of “mixed livestock & crop” systems are close to markets. “Only livestock” systems are found in higher shares in remote areas . In total > 90% of the only livestock systems are in RMA domains. Acknowledgements The CGIAR Challenge Program on Water and Food (CPWF) provided financial and technical support, under their project entitled ‘NBDC: on targeting and scaling out’. Funding for this research was provided by UK Department for International Development (DFID), the European Commission (EC), the International Fund For Agricultural Development (IFAD), and The Swiss Agency for Development And Cooperation (SDC). We also wish to thank Dr. Anton Vrieling from the University of Twente for providing the NDVI dataset, a crucial input into our rainwater analysis. Rainwater management potential is derived from normalized difference vegetation index (NDVI), potential evapotranspiration (PET) and precipitation (P). For each growing period the overall P/PET ratio was determined and assigned as the average water availability to demand ratio for that period. NDVI is used to compare sites with comparable moisture regimes in terms of their “greenness”. Sites that appear less green than expected for their moisture regime use the available water sub-optimally. Rainwater management potential Class 1 – NML: Not moisture limited crop growth, no need for RWM a) all areas with P/PET>1.4, here optimal achievable NDVI values indicate that plant growth is not moisture limited; b) some of the areas with P/PET 0.7-1.4, i.e. less soil moisture, but still showing optimal NDVI. In Class 1 there is no need for RWM Class 2 – SMA: Sufficient moisture, optimal crop growth possible, with RWM interventions Areas with a P/PET range of 0.7-1.4 showing sub-optimal NDVI values. Available soil moisture is not utilized in the best possible way. Thus, with smart RWM practices available moisture can be sufficient for optimal plant growth. Class 3 – LMA: Limited moisture, optimal crop growth not possible, RWM to optimize sub- optimal water availability Areas with a P/PET ratio less than 0.7. Here soil water deficits clearly limit plant growth. Rainfed agriculture is still possible, but optimal yields are not achievable. By meticulously applying RWM practices crop growth can be considerably improved, i.e. reach optimal growth within existent local soil moisture constraints. Water Investment Domains (WIDs) = geographical units in which similar water- related agricultural development problems or opportunities are likely to occur. SMA-CMA and NML-CMA are the two most agriculturally intensive areas, with approximately two thirds of each of their areas cultivated. Comparing accessible with remote areas, higher shares of cropland mosaic are found in the more accessible WIDs. Highest numbers and highest densities of people and livestock are found in the SMA-CMA domain. In general, a higher population density (human and animal) can be found in the accessible areas as compared to the remote areas. People Share total TLU* Share total Total area Share total Cropland mosaic Share WID Only livestock Mix livestock & crops NML-CMA 1 048 000 6% 428 334 6% 11 503 6% 7 266 63% 12% 85% NML-RMA 2 743 730 15% 1 076 666 15% 51 233 26% 20 132 39% 31% 66% SMA-CMA 6 464 680 34% 2 061 871 29% 41 108 21% 27 034 66% 4% 95% SMA-RMA 3 394 520 18% 1 522 003 21% 42 873 22% 19 570 46% 21% 79% LMA-CMA 1 331 040 7% 476 488 7% 9 204 5% 5 061 55% 1% 98% LMA-RMA 3 924 140 21% 1 575 552 22% 38 964 20% 12 320 32% 24% 76% 18 906 110 100% 7 140 915 100% 194 885 100% 91 383 47% 19% 79% * TLU = tropical livestock units Agricultural systemArea (km2 )Population Livestock Water Investment Domain (WID) Close NML-CMA Remote NML-RMA Close SMA-CMA Remote SMA-RMA Close LMA-CMA Remote LMA-RMA Soil moisture and crop growth Market access RWM need No need RWM to reach optimal crop growth RWM to optimize use of limited moisture Water Investment Domain (WID) Limited Moisture Availability, optimal crop growth not possible No Moisture Limitations, full crop growth Sufficient Moisture Availability, optimal crop growth possible This document is licensed for use under a Creative Commons Attribution-Noncommercial-Share Alike 3.0 Unported License July 2013