
Recommended
Recommended
More Related Content
What's hot
What's hot (20)
Similar to Narayan hrudyalaya Q1FY19
Similar to Narayan hrudyalaya Q1FY19 (20)
More from Karan Agarwal
Recently uploaded
Recently uploaded (20)
Narayan hrudyalaya Q1FY19
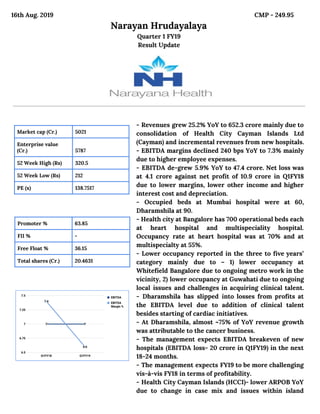
- 1. 16th Aug. 2019 CMP - 249.95 Narayan Hrudayalaya Quarter 1 FY19 Result Update Market cap (Cr.) 5021 Enterprise value (Cr.) 5787 52 Week High (Rs) 320.5 52 Week Low (Rs) 212 PE (x) 138.7517 Promoter % 63.85 FII % - Free Float % 36.15 Total shares (Cr.) 20.4631 - Revenues grew 25.2% YoY to 652.3 crore mainly due to consolidation of Health City Cayman Islands Ltd (Cayman) and incremental revenues from new hospitals. - EBITDA margins declined 240 bps YoY to 7.3% mainly due to higher employee expenses. - EBITDA de-grew 5.9% YoY to 47.4 crore. Net loss was at 4.1 crore against net profit of 10.9 crore in Q1FY18 due to lower margins, lower other income and higher interest cost and depreciation. - Occupied beds at Mumbai hospital were at 60, Dharamshila at 90. - Health city at Bangalore has 700 operational beds each at heart hospital and multispeciality hospital. Occupancy rate at heart hospital was at 70% and at multispecialty at 55%. - Lower occupancy reported in the three to five years’ category mainly due to – 1) lower occupancy at Whitefield Bangalore due to ongoing metro work in the vicinity, 2) lower occupancy at Guwahati due to ongoing local issues and challenges in acquiring clinical talent. - Dharamshila has slipped into losses from profits at the EBITDA level due to addition of clinical talent besides starting of cardiac initiatives. - At Dharamshila, almost ~75% of YoY revenue growth was attributable to the cancer business. - The management expects EBITDA breakeven of new hospitals (EBITDA loss- 20 crore in Q1FY19) in the next 18-24 months. - The management expects FY19 to be more challenging vis-à-vis FY18 in terms of profitability. - Health City Cayman Islands (HCCI)- lower ARPOB YoY due to change in case mix and issues within island
- 2. ambulance system (lower acute emergencies). The management expects to improve the same in the next quarter or two. - HCCI- The company is contemplating tie ups with neighbouring countries such as Bahamas, Honduras, Trinidad & Tobago besides targeting local Cayman population to improve occupancy. - HCCI- EBITDA margins were down due to certain one-off charges to the tune of US$0.59 million. Financial Highlights Inc / Exp Performance Particulars 201803 201703 201603 Gross Sales 1847.58 1645.92 1470.03 Total Income 1866.21 1664.06 1484.88 Total Expenditure 1665.34 1428.32 1297.39 PBIDT 200.87 235.74 187.49 Growth% -14.79 25.73 38.1 PBIT 121.66 164.34 109.89 PBT 95.41 147.33 86.47 PAT 58.42 95.11 56.68 Growth% -38.58 67.8 169.9 Cash Profit 136.47 163.32 123.43
- 3. Quarter Results Description Jun-18 Jun-17 Var% Mar-18 Mar-17 Var% Net Sales 482.63 441.09 9.42 476.37 422.73 12.69 Net Sales & Other Operating Income 482.63 441.09 9.42 476.37 422.73 12.69 Total Expenditure 452.08 395.83 14.21 440.72 367.46 19.94 (Increase) / Decrease In Stocks -1.39 -23.79 94.15 -2.28 5.21 PL Purchase of Finished Goods 122.76 131.48 -6.63 124.41 90.24 37.86 Operating & Manufacturing Expenses 120.01 104.29 15.07 118.84 104.64 13.57 Employee Cost 99 92.31 7.25 94.26 81.01 16.36 General Administration Expenses 111.7 91.54 22.02 105.49 86.36 22.15 PBIDT (Excl OI) 30.55 45.26 -32.5 35.65 55.27 -35.5 Other Income 2.75 6.7 -58.96 5.01 6.26 -19.96 Operating Profit 33.3 51.96 -35.91 40.66 61.54 -33.93 Interest 10.21 4.56 123.96 7.71 3.82 101.97 PBDT 22.64 47.4 -52.23 32.95 57.72 -42.91 Depreciation 21.6 17.98 20.14 21.2 18.31 15.79 PBT 1.04 29.43 -96.47 11.75 39.42 -70.2 Tax 0.5 10.06 -95.07 7.41 14.97 -50.5 Profit After Tax 0.54 19.37 -97.2 4.34 24.45 -82.26 Sources of Funds Particulars 201803 201703 201603 Equity Paid Up 204.36 204.36 204.36 Reserves and Surplus 902.89 844.88 752.72 Net Worth 1107.25 1049.24 957.08 Total Debt (Long Term plus Short Term) 491.42 119.53 151.75 Capital Employed 1612.11 1178 1108.83
- 4. Application of Funds Particulars 201803 201703 201603 Gross Block 1433.41 1067.41 967.87 Investments 560.95 354 333.59 Cash and Bank balance 21.44 28.16 18.19 Net Current Assets -31.6 17.1 -7.04 Total Current Liabilities 336.24 268.19 270.74 Total Assets 1993.85 1486.07 1381.83 Cash Flow Particulars 201803 201703 201603 Cash Flow from Operations 194.04 218.3 177.32 Cash Flow from Investing activities -444.17 -161.93 -129.76 Cash Flow from Finance activities 225.91 -31.63 -1.52 Free Cash flow -30.39 50.57 74.03 Concluding Views: Narayana is struggling with margins and due to various developments is still gonna experience tight pockets for the year. Though the company looks strong for long term following its asset light and affordability model. Given the currently going on government interventions in medical procedures and equipments, the company seems to be moving in the right direction by following a practice of affordability with profitability.