Download as PDF, PPTX


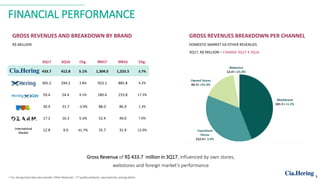
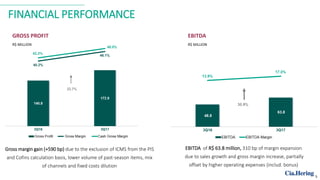
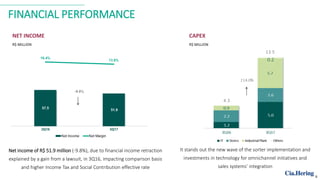
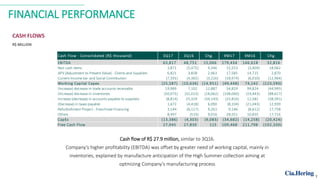
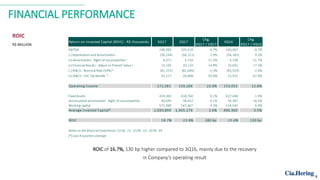


Hering reported its 3Q17 results with the following highlights: - Gross revenues increased 5.1% to R$433.7 million, influenced by own stores, webstores, and foreign market performance. - EBITDA was R$63.8 million with 310 basis point margin expansion due to sales growth and gross margin increase. - Net income decreased 9.8% to R$51.9 million due to a financial income gain in 3Q16 impacting comparisons. - ROIC increased 130 basis points to 16.7% mainly due to recovery in operating results.


