SlideShare a Scribd company logo
1 of 9
Download to read offline
Anand Rathi Share and Stock Brokers Limited (hereinafter “ARSSBL”) is a full-service brokerage and equities-research firm and the views expressed therein are solely of
ARSSBL and not of the companies which have been covered in the Research Report. This report is intended for the sole use of the Recipient. Disclosures and analyst
certifications are present in the Appendix.
Anand Rathi Research India Equities
Technology
Company Update
India I Equities
Mohit Jain
Research Analyst
+9122 6626 6531
mohitjain@rathi.com
Shobit Singhal
Research Associate
+9122 6626 6511
shobitsinghal@rathi.com
Key financials (YE Mar) FY15 FY16 FY17 FY18e FY19e
Sales (` m) 18,913 23,123 28,784 30,783 34,575
Net profit (` m) 2,906 2,974 3,015 3,319 4,098
EPS (`) 36.3 37.2 37.7 41.5 51.2
Growth (%) 16.6 2.3 1.4 10.1 23.5
PE (x) 18.1 17.7 17.4 15.8 12.8
PBV (x) 3.7 3.2 2.8 2.5 2.2
RoE (%) 22.1 19.5 17.0 16.5 18.1
RoCE (%) 20.5 19.2 16.2 14.7 17.2
Dividend yield (%) 1.3 2.4 1.1 1.8 2.7
Net debt/equity (x) -0.4 -0.4 -0.4 -0.5 -0.5
Source: Company, Anand Rathi Research *Notes- Adjusted
sequentially.
,
Rating: Buy
Target Price: `800
Share Price: `657
Key data PSYS IN / PERS.BO
52-week high / low `710/ `501
Sensex / Nifty 32029/9915
3-m average volume $2.1m
Market cap `53bn/$819m
Shares outstanding 80m
Shareholding pattern (%) June'17 Mar'17 Dec'16
Promoters 30.7 35.0 36.2
- of which, Pledged
Free float 69.3 65.0 63.8
- Foreign institutions 22.3 20.8 21.5
- Domestic institutions 14.1 14.3 13.5
- Public 32.9 29.9 28.8
22 July 2017
Persistent Systems
Revenues in-line, deferred wage hikes to help margins; Buy
Persistent had an operationally good quarter with US$ revenues
growing at 3.6%qoq, top 10 clients growing at 9%qoq, 3 accounts
moving to >US$3m bracket, and revenue per client going up. This was
achieved with reduction in headcount (-64 net). However, margin
performance was weak for two reasons – currency (offshore rev are
59%) and SG&A investments (PARX acquisition, visa exp, and hiring).
Wage hikes are deferred to 2H and hence, 1Q miss can be reversed
during FY18. We maintain buy rating with TP of `800.
Traditional business bounces back; Digital takes a breather. Persistent
reported in-line revenues at US$113m, +3.6%qoq and +7.8%yoy. The
surprise this quarter was growth in the two traditional businesses (Services
+5%qoq and Alliance – ex IoT, +10%qoq). The focus businesses of Digital
and Accelerite disappointed with a decline of -1.3%qoq and -10%qoq, pulling
down margins (Digital margins -351bps qoq, Accelerite -473bps qoq). In
addition, 70bps one-time expenses were incurred towards visa and acquisition
related travel. EBITDA margins were 14.3%, -257bps qoq* and -73bps yoy.
Acquires PARX (Salesforce Platinum Partner in Europe) for US$8.5m
(+US$7.5m earn-outs after 3Y). PARX (CY16 Rev US$8.5m, +28% over
CY15-17) has worked for 300 customers and has operations in Switzerland,
Germany, and Austria. Focus industry verticals are consumer goods,
manufacturing, and services but works across industries. Interesting
acquisition as it fetches enterprise customers and improves PSYS’ Europe
footprint (just 6% of Rev currently). Margins were not disclosed but we are
building in ~6% EBITDA in our estimates.
Estimates largely retained adj for currency, maintain Buy. We cut our
earnings estimates by ~4%/2% each for FY18/FY19e, factoring in
Rs64.5/US$, deferred wage hikes, and PARX. We retain a Buy, with target of
`800, at 16x FY19e EPS. Risk: Sharp rupee appreciation.
Relative price performance
Source: Bloomberg
PSYS
Sensex
550
600
650
700
750
Jul-16
Aug-16
Sep-16
Oct-16
Nov-16
Dec-16
Jan-17
Feb-17
Mar-17
Apr-17
May-17
Jun-17
Jul-17
Estimates revision (%) FY18e FY19e
Sales($) 1.6 2.1
EBITDA (9.3) (4.7)
PAT (4.2) (2.0)
Change in Estimates  Target  Reco 
22 July 2017 Persistent Systems – Revenues in-line, deferred wage hikes to help margins; Buy
Anand Rathi Research 2
Quick Glance – Financials and Valuations
Fig 1 – Income statement (`m)
Year-end: Mar FY15 FY16 FY17 FY18e FY19e
Net revenues 18,913 23,123 28,784 30,783 34,575
Revenue growth (%) 13.3 22.3 24.5 6.9 12.3
- Oper. expenses 15,007 18,952 24,131 25,942 28,585
EBIDTA 3,906 4,171 4,653 4,842 5,990
EBITDA margins (%) 20.7 18.0 16.2 15.7 17.3
- Interest - - - - -
- Depreciation 939 965 1,490 1,548 1,621
+ Other income 932 750 843 1,106 1,050
- Tax 993 983 992 1,080 1,320
Effective tax rate (%) 25.5 24.8 24.8 24.6 24.4
+ Associates/(minorities) - - - - -
Adjusted PAT 2,906 2,974 3,015 3,319 4,098
+ Extraordinary items - - - - -
Reported PAT 2,906 2,974 3,015 3,319 4,098
Adj. FDEPS (`/sh) 36.3 37.2 37.7 41.5 51.2
Adj. FDEPS growth (%) 16.6 2.3 1.4 10.1 23.5
Source: Company, Anand Rathi Research
Fig 3 – Cash-flow statement (`m)
Year-end: Mar FY15 FY16 FY17 FY18e FY19e
Adjusted PAT 2,906 2,974 3,015 3,319 4,098
+ Non-cash items 939 965 1,490 1,548 1,621
Cash profit 3,845 3,939 4,505 4,867 5,719
- Incr./(decr.) in WC 186 1,594 614 34 347
Operating cash-flow 3,659 2,344 3,891 4,833 5,372
- Capex 670 1,477 2,511 569 1,150
Free cash-flow 2,989 868 1,379 4,264 4,222
- Dividend 667 1,251 578 963 1,393
+ Equity raised -405 613 163 -0 -
+ Debt raised -62 84 -172 - -
- Investments 1,854 297 716 1,627 2,115
- Misc. items - - - - -
Net cash-flow 0 16 76 1,675 714
+ Op. cash & bank bal. 1,416 1,416 1,432 1,510 3,184
Cl. Cash & bank bal. 1,416 1,432 1,510 3,184 3,898
Source: Company, Anand Rathi Research
Fig 5 – Price movement
Source: Bloomberg
Fig 2 – Balance sheet (`m)
Year-end: Mar FY15 FY16 FY17 FY18e FY19e
Share capital 800 800 800 800 800
Reserves & surplus 13,258 15,593 18,193 20,549 23,254
Net worth 14,058 16,393 18,993 21,349 24,054
Total debt 25 26 22 22 22
Minority interest - - - - -
Def. tax liab. (net) -315 -233 -401 -401 -401
Capital employed 13,767 16,186 18,614 20,970 23,675
Net fixed assets 3,097 3,031 2,817 3,021 3,162
Intangible assets 1,019 1,597 2,832 1,648 1,037
Investments 6,749 7,046 7,761 9,388 11,503
- of which, Liquid 4,620 4,828 5,422 7,049 9,163
Working capital 1,486 3,080 3,694 3,728 4,075
Cash 1,416 1,432 1,510 3,184 3,898
Capital deployed 13,767 16,186 18,614 20,970 23,675
Working capital (days) 29 49 47 44 43
Book value (`/sh) 175.7 204.9 237.4 266.9 300.7
Source: Company, Anand Rathi Research
Fig 4 – Ratio analysis@ `657
Year-end: Mar FY15 FY16 FY17 FY18e FY19e
P/E (x) 18.1 17.7 17.4 15.8 12.8
Cash P/E (x) 13.7 13.3 11.7 10.8 9.2
EV/EBITDA (x) 11.9 11.1 9.8 8.7 6.6
EV/sales (x) 2.5 2.0 1.6 1.4 1.1
P/B (x) 3.7 3.2 2.8 2.5 2.2
RoE (%) 22.1 19.5 17.0 16.5 18.1
RoCE (%) 20.5 19.2 16.2 14.7 17.2
Dividend yield (%) 1.3 2.4 1.1 1.8 2.7
Dividend payout (%) 23.0 42.1 19.2 29.0 34.0
Net debt/equity (x) -0.4 -0.4 -0.4 -0.5 -0.5
Debtor (days) 69 67 60 60 60
Inventory (days) - - - - -
Payables (days) 10 26 15 15 15
CFO:EBITDA% 79.8 60.9 61.5 85.3 73.8
FCF:EBITDA% 55.3 21.1 14.8 61.6 54.6
Source: Company, Anand Rathi Research
Fig 6 – Digital revenue
Source: Company
100
200
300
400
500
600
700
800
900
1,000
Jul-12
Nov-12
Mar-13
Jul-13
Nov-13
Mar-14
Jul-14
Nov-14
Mar-15
Jul-15
Nov-15
Mar-16
Jul-16
Nov-16
Mar-17
Jul-17
(`)
PSYS
15
16
19
21 20
0
5
10
15
20
25
1QFY17
2QFY17
3QFY17
4QFY17
1QFY18
($m)
22 July 2017 Persistent Systems – Revenues in-line, deferred wage hikes to help margins; Buy
Anand Rathi Research 3
Result Highlights
Q1FY18 Results at a Glance
Fig 8 – Quarterly result
Year-end: Mar Q1FY18 % qoq % yoy FY17 FY16 % yoy
Sales ($ m) 113 3.6 7.8 429 352 22.0
Sales (`m) 7,280 0.1 3.7 28,784 23,123 24.5
EBITDA (`m) 1,044 (19.8) (1.3) 4,653 4,171 11.6
EBITDA margin (%) 14.3 -357 bps -73 bps 16.2 18.0 -187 bps
EBIT (`m) 652 (28.2) (8.8) 3,163 3,206 (1.3)
EBIT margin (%) 9.0 -353 bps -123 bps 11.0 13.9 -287 bps
PBT (`m) 1,019 8.8 5.3 4,007 3,956 1.3
Tax (`m) (269) 28.8 14.2 (992) (983) 1.0
Tax rate (%) (26.3) -407 bps -205 bps (24.8) (24.8) 8 bps
Net Income (`m) 751 3.1 2.5 3,015 2,974 1.4
Source: Company
Fig 7 – Segment-wise results
Q1FY17 Q2FY17 Q3FY17 Q4FY17 Q1FY18 QoQ% YoY%
Revenues ($ m) 105 105 110 109 113 3.6% 7.8%
Growth YoY % 33% 27% 23% 9% 8% -73bps -2543bps
Volume growth % ND ND ND ND ND
Revenues (` m) 7,018 7,040 7,455 7,271 7,280 0% 4%
Eff. exchange rate 67.0 66.9 67.8 66.7 64.4 -3% -4%
Employees (EoP) 8,698 8,612 8,562 8,808 8,744
Revenue Productivity ($ ‘000/employee) 12.0 12.2 12.9 12.4 12.9 4% 7.3%
Gross Utilization (IT services) 75.3% 74.2% 78.9% 77.8% 77.2% -61bps 190bps
Attrition 16.7% 15.9% 15.8% 15.7% 15.5% -20bps -120bps
CoR (excluding D&A) (4,585) (4,539) (4,751) (4,644) (4,783) 3% 4%
As % of Revenues -65% -64% -64% -64% -66% -183bps -37bps
SG&A (1,376) (1,394) (1,518) (1,326) (1,453) 10% 6%
As % of Revenues -20% -20% -20% -18% -20% -173bps -36bps
EBITDA 1,058 1,108 1,187 1,302 1,044 -20% -1%
EBITDA margins % 15% 16% 16% 18% 14% -357bps -73bps
EBIT 715 741 800 907 652 -28% -9%
EBIT margins % 10% 11% 11% 12% 9% -353bps -123bps
Other Income 172 203 143 57 183 224% 6%
Forex gain/loss 81 41 174 (28) 184 -768% 128%
Interest expense
PBT 968 984 1,118 936 1,019 9% 5%
PBT margins % 14% 14% 15% 13% 14% 112bps 21bps
Taxes (235) (250) (299) (209) (269) 29% 14%
ETR % -24% -25% -27% -22% -26% 407bps 205bps
PAT 733 735 819 728 751 3% 2%
PAT Margin % 10% 10% 11% 10% 10% 30bps -13bps
Source: Company, Anand Rathi Research
22 July 2017 Persistent Systems – Revenues in-line, deferred wage hikes to help margins; Buy
Anand Rathi Research 4
Conference Call Takeaways
Company
 Impact on margins in Q1FY18- lower offshore utilization impacted
40bps, Currency impacted 120bps, visa cost and PARX acquisition
impacted 70bps, incremental onsite hiring impacted 30bps and
provisioning of bad debts impacted 40bps.
 Hike in wages is deferred from July to October for some employees
and from July to January for others.
 The rise in `200m for cost of professional is due to hiring of special
skill professional for new projects which is of recurring nature.
 Acquisition of PARX- Acquired for consideration of upfront $8.5mn
and $7.5m after 3 years based on earn-outs. PARX reported revenues
of CHF 8mn (~`54cr) in 2016 and consists of 80 people in its
workforce (including contractors). The company is profitable although
PSYS did not disclose its EBITDA margins.
 Management restated that last quarter they managed to move some
IBM employees to lower cost geographies. Thus, can expect better
management on margins in the IBM alliance going forward.
 The company’s product business, Accelerite declined sequentially this
quarter due to settlement dispute with one of the customers. Overall
pipeline is robust and expects this segment to do well.
Notes from the last two quarters’ conference calls
From Q4FY17
 Revenue growth is expected to be in double digits as Accelerite,
Alliance and Digital are expected to continue their growth momentum.
Services may continue to be a drag on overall growth rates.
 FY18 margins are likely to be better than FY17, as IoT breakseven and
some benefits of non-linearity start coming in.
From Q3FY17
 The services business (44% of revenue) may have constrained growth
but the balance (56% of revenue) would grow fast.
 The IBM IoT business is likely to break even in FY18. Costs are fixed
and hence may not increase in FY18. There are additional levers to
reduce costs.
22 July 2017 Persistent Systems – Revenues in-line, deferred wage hikes to help margins; Buy
Anand Rathi Research 5
Factsheet
Fig 9 – Revenue split
(%) Q1FY17 Q2FY17 Q3FY17 Q4FY17 Q1FY18
Effort-Led 71.8 72.2 71.6 72.4 72.8
IP-Led 28.2 27.8 28.4 27.6 27.2
Source: Company
Fig 10 – Revenue-split, by region
(%) Q1FY17 Q2FY17 Q3FY17 Q4FY17 Q1FY18
North America 87.0 85.4 86.6 86.5 85.5
Europe 5.2 6.1 5.3 5.3 5.9
Asia-Pacific 7.8 8.5 8.1 8.2 8.6
Source: Company
Fig 11 – Revenue-split, by segment
($m) Q1FY17 Q2FY17 Q3FY17 Q4FY17 Q1FY18
Services 49.9 49.0 48.3 47.9 50.3
Digital 15 16 19 21 20
Alliance 31.4 30.9 33.7 30.1 33.0
Accelerite 9 9 9 10 9
Source: Company
Fig 12 – Client concentration
(%) Q1FY17 Q2FY17 Q3FY17 Q4FY17 Q1FY18
Top 1 29.0 28.4 29.5 26.5 27.9
Top 5 44.7 44.3 46.0 43.3 45.7
Top 10 52.7 52.8 54.6 52.4 55.2
Source: Company
Fig 13 – Workforce
(%) Q1FY17 Q2FY17 Q3FY17 Q4FY17 Q1FY18
Employee Movement
Technical(EOP) 8,698 8,612 8,562 8,808 8,744
Net Adds (Qtr) 80 -86 -50 246 -64
Net Adds (LTM) 888 707 228 190 46
Utilization % 75.3 74.2 78.9 77.8 77.2
Attrition % 16.7 15.9 15.8 15.7 15.5
Sales(EOP) 204 207 200 193 210
Net Adds (Qtr) 3 3 (7) (7) 17
Net Adds (LTM) (12) (1) (3) (8) 6
Source: Company
22 July 2017 Persistent Systems – Revenues in-line, deferred wage hikes to help margins; Buy
Anand Rathi Research 6
Fig 14 – Revenue-split, by delivery type and billing rates
Q1FY17 Q2FY17 Q3FY17 Q4FY17 Q1FY18
Delivery type (%)
On-site 26.3 26.3 26.7 27.8 29.9
Offshore 45.5 45.5 44.9 44.6 42.9
Reported billing rates ($ /hr)
On-site 82.6 86.1 84.0 85.1 85.8
Offshore 23.1 22.9 22.8 22.7 22.5
Source: Company
Fig 15 – Key geographies and horizontals growth (%)
(%) Q1FY17 Q2FY17 Q3FY17 Q4FY17 Q1FY18
Horizontals growth (qoq)
Services NA -1.7% -1.5% -0.9% 5.0%
Digital NA 7.5% 16.3% 10.8% -1.3%
Alliance NA -2% 9% -11% 10%
Accelerite NA 8% 2% 11% -10%
Key area-wise growth (yoy)
North America 37.4 25.6 24.6 9.1 6.0
Europe 10.0 13.7 3.3 (14.1) 22.4
Asia-Pacific 11.8 54.0 18.3 23.6 18.9
Source: Company
Fig 16 – Segment-wise growth (yoy)
(%) Q1FY17 Q2FY17 Q3FY17 Q4FY17 Q1FY18
Effort-Led 17.4 9.2 10.0 9.5 9.2
IP-Led 103.7 117.7 73.5 6.1 4.3
Source: Company
22 July 2017 Persistent Systems – Revenues in-line, deferred wage hikes to help margins; Buy
Anand Rathi Research 7
Valuations
The stock trades at 12.8x FY19e EPS of `51.2. This, we reckon, is
attractive, given that Persistent has a differentiated range of service
offerings and is expected to grow at a faster-than-industry rate of ~10%,
organically.
With a strong balance sheet (cash balance: ~$140m) and cash-flow
generation (CFO:NI ~90%), it is one of the best midcap IT stocks, which
could command a higher multiple if growth accelerates. The company is
likely to touch $536m in revenue by FY19, helping it morph into a
reasonably large and differentiated IT-services company.
Also, it has margin levers in the business, primarily the offshore mix and
utilisation to absorb potential headwinds in margins. More than 50% of
Persistent’s business is non-linear (or not dependent on T&M billing),
giving it a potential margin upswing if the growth here turns out to be
higher.
Its reliance on one client is at present a high 28%, but that gives it a better
positioning to grow faster by aligning its interests with its largest client.
We value Persistent based on a target PE of 16x FY19e EPS, similar to
Mindtree and Cyient. This reflects constrained profitability and the
potential to grow faster than the industry.
Fig 17 – Change in estimates
FY18 FY19
New Old Chg % New Old Chg %
Revenues ($m) 477 470 1.6 536 525 2.1
Revenues (`m) 30,783 31,335 (1.8) 34,575 35,001 (1.2)
EBITDA (`m) 4,842 5,336 (9.3) 5,990 6,287 (4.7)
EBITDA margin % 16% 17% (130) 17% 18% (64)
EBIT (`m) 3,294 3,742 (12.0) 4,369 4,574 (4.5)
EBIT margin % 10.7% 11.9% (124) 12.6% 13.1% (43)
PBT 4,399 4,563 (3.6) 5,419 5,510 (1.7)
Net profit 3,319 3,464 (4.2) 4,098 4,183 (2.0)
Source: Anand Rathi Research
Fig 18 – PE band
Source: Bloomberg, Anand Rathi Research
Risks
 Sharp rupee appreciation.
5
9
13
17
21
25
Sep-11
Dec-11
Apr-12
Aug-12
Dec-12
Apr-13
Aug-13
Dec-13
Apr-14
Aug-14
Dec-14
Apr-15
Jul-15
Nov-15
Mar-16
Jul-16
Nov-16
Mar-17
Jul-17
PSYS
Appendix
Analyst Certification
The views expressed in this Research Report accurately reflect the personal views of the analyst(s) about the subject securities or issuers and no part of the
compensation of the research analyst(s) was, is, or will be directly or indirectly related to the specific recommendations or views expressed by the research
analyst(s) in this report. The research analysts are bound by stringent internal regulations and also legal and statutory requirements of the Securities and Exchange
Board of India (hereinafter “SEBI”) and the analysts’ compensation are completely delinked from all the other companies and/or entities of Anand Rathi, and have
no bearing whatsoever on any recommendation that they have given in the Research Report.
Important Disclosures on subject companies
Rating and Target Price History (as of 21 July 2017)
Persistent
10
7
1
2
3
4
5
6 8
9
400
500
600
700
800
900
1000
Jan-14
Apr-14
Jul-14
Oct-14
Jan-15
Apr-15
Jul-15
Oct-15
Jan-16
Apr-16
Jul-16
Oct-16
Jan-17
Apr-17
Jul-17
Date Rating
TP
(`)
Share
Price (`)
1 30-Sep-14 Buy 975 693
2 05-Jan-15 Buy 1,000 932
3 28-Jan-15 Hold 975 902
4 09-Apr-15 Buy 930 780
5 24-Jun-15 Buy 860 647
6 08-Apr-16 Buy 950 727
7 26-Jul-16 Buy 900 664
8 25-Oct-16 Buy 875 662
9 21-Dec-16 Buy 840 609
10 25-Apr-17 Buy 800 568
Anand Rathi Ratings Definitions
Analysts’ ratings and the corresponding expected returns take into account our definitions of Large Caps (>US$1bn) and Mid/Small Caps (<US$1bn) as described
in the Ratings Table below:
Ratings Guide (12 months)
Buy Hold Sell
Large Caps (>US$1bn) >15% 5-15% <5%
Mid/Small Caps (<US$1bn) >25% 5-25% <5%
Research Disclaimer and Disclosure inter-alia as required under Securities and Exchange Board of India (Research Analysts) Regulations, 2014
Anand Rathi Share and Stock Brokers Ltd. (hereinafter refer as ARSSBL) (Research Entity) is a subsidiary of Anand Rathi Financial Services Ltd. ARSSBL is a
corporate trading and clearing member of Bombay Stock Exchange Ltd, National Stock Exchange of India Ltd. (NSEIL), Multi Stock Exchange of India Ltd (MCX-
SX), United Stock Exchange and also depository participant with National Securities Depository Ltd (NSDL) and Central Depository Services Ltd. ARSSBL is
engaged in the business of Stock Broking, Depository Participant and Mutual Fund distributor.
The research analysts, strategists, or research associates principally responsible for the preparation of Anand Rathi research have received compensation based
upon various factors, including quality of research, investor client feedback, stock picking, competitive factors and firm revenues.
General Disclaimer: This Research Report (hereinafter called “Report”) is meant solely for use by the recipient and is not for circulation. This Report does not
constitute a personal recommendation or take into account the particular investment objectives, financial situations, or needs of individual clients. The
recommendations, if any, made herein are expression of views and/or opinions and should not be deemed or construed to be neither advice for the purpose of
purchase or sale of any security, derivatives or any other security through ARSSBL nor any solicitation or offering of any investment /trading opportunity on behalf
of the issuer(s) of the respective security (ies) referred to herein. These information / opinions / views are not meant to serve as a professional investment guide for
the readers. No action is solicited based upon the information provided herein. Recipients of this Report should rely on information/data arising out of their own
investigations. Readers are advised to seek independent professional advice and arrive at an informed trading/investment decision before executing any trades or
making any investments. This Report has been prepared on the basis of publicly available information, internally developed data and other sources believed by
ARSSBL to be reliable. ARSSBL or its directors, employees, affiliates or representatives do not assume any responsibility for, or warrant the accuracy,
completeness, adequacy and reliability of such information / opinions / views. While due care has been taken to ensure that the disclosures and opinions given are
fair and reasonable, none of the directors, employees, affiliates or representatives of ARSSBL shall be liable for any direct, indirect, special, incidental,
consequential, punitive or exemplary damages, including lost profits arising in any way whatsoever from the information / opinions / views contained in this Report.
The price and value of the investments referred to in this Report and the income from them may go down as well as up, and investors may realize losses on any
investments. Past performance is not a guide for future performance. ARSSBL does not provide tax advice to its clients, and all investors are strongly advised to
consult with their tax advisers regarding taxation aspects of any potential investment.
Opinions expressed are our current opinions as of the date appearing on this Research only. We do not undertake to advise you as to any change of our views
expressed in this Report. Research Report may differ between ARSSBL’s RAs and/ or ARSSBL’s associate companies on account of differences in research
methodology, personal judgment and difference in time horizons for which recommendations are made. User should keep this risk in mind and not hold ARSSBL,
its employees and associates responsible for any losses, damages of any type whatsoever.
ARSSBL and its associates or employees may; (a) from time to time, have long or short positions in, and buy or sell the investments in/ security of company (ies) mentioned
herein or (b) be engaged in any other transaction involving such investments/ securities of company (ies) discussed herein or act as advisor or lender / borrower to such
company (ies) these and other activities of ARSSBL and its associates or employees may not be construed as potential conflict of interest with respect to any
recommendation and related information and opinions. Without limiting any of the foregoing, in no event shall ARSSBL and its associates or employees or any third party
involved in, or related to computing or compiling the information have any liability for any damages of any kind.
Details of Associates of ARSSBL and Brief History of Disciplinary action by regulatory authorities & its associates are available on our website i.e. www.rathionline.com
Disclaimers in respect of jurisdiction: This report is not directed to, or intended for distribution to or use by, any person or entity who is a citizen or resident of or located in
any locality, state, country or other jurisdiction where such distribution, publication, availability or use would be contrary to law or regulation or which would subject ARSSBL to
any registration or licensing requirement within such jurisdiction(s). No action has been or will be taken by ARSSBL in any jurisdiction (other than India), where any action for
such purpose(s) is required. Accordingly, this Report shall not be possessed, circulated and/or distributed in any such country or jurisdiction unless such action is in
compliance with all applicable laws and regulations of such country or jurisdiction. ARSSBL requires such recipient to inform himself about and to observe any restrictions at
his own expense, without any liability to ARSSBL. Any dispute arising out of this Report shall be subject to the exclusive jurisdiction of the Courts in India.
Statements on ownership and material conflicts of interest, compensation - ARSSBL and Associates
Answers to the Best of the knowledge and belief of ARSSBL/ its Associates/ Research Analyst who is preparing this report
ARSSBL/its Associates/ Research Analyst/ his Relative have actual/beneficial ownership of one per cent or more securities of the subject company, at the end of
the month immediately preceding the date of publication of the research report?
No
ARSSBL/its Associates/ Research Analyst/ his Relative have actual/beneficial ownership of one per cent or more securities of the subject company No
ARSSBL/its Associates/ Research Analyst/ his Relative have any other material conflict of interest at the time of publication of the research report? No
ARSSBL/its Associates/ Research Analyst/ his Relative have received any compensation from the subject company in the past twelve months No
ARSSBL/its Associates/ Research Analyst/ his Relative have managed or co-managed public offering of securities for the subject company in the past twelve
months
No
ARSSBL/its Associates/ Research Analyst/ his Relative have received any compensation for investment banking or merchant banking or brokerage services from
the subject company in the past twelve months
No
ARSSBL/its Associates/ Research Analyst/ his Relative have received any compensation for products or services other than investment banking or merchant
banking or brokerage services from the subject company in the past twelve months
No
ARSSBL/its Associates/ Research Analyst/ his Relative have received any compensation or other benefits from the subject company or third party in connection
with the research report
No
ARSSBL/its Associates/ Research Analyst/ his Relative have served as an officer, director or employee of the subject company. No
Other Disclosures pertaining to distribution of research in the United States of America
This report was prepared, approved, published and distributed by the Anand Rathi Share and Stock Brokers Limited (ARSSBL) located outside of the United States (a “non-
US Group Company”). This report is distributed in the U.S. by Enclave Capital LLC, a U.S. registered broker dealer, on behalf of ARSSBL only to major U.S. institutional
investors (as defined in Rule 15a-6 under the U.S. Securities Exchange Act of 1934 (the “Exchange Act”)) pursuant to the exemption in Rule 15a-6 and any transaction
effected by a U.S. customer in the securities described in this report must be effected through Enclave Capital. ARSSBL accepts responsibility for its contents. Any US
customer wishing to effect transactions in any securities referred to herein or options thereon should do so only by contacting a representative of Enclave Capital LLC at 646-
454-8600
Neither the report nor any analyst who prepared or approved the report is subject to U.S. legal requirements or the Financial Industry Regulatory Authority, Inc. (“FINRA”) or
other regulatory requirements pertaining to research reports or research analysts. No non-US Group Company is registered as a broker-dealer under the Exchange Act or is a
member of the Financial Industry Regulatory Authority, Inc. or any other U.S. self-regulatory organization.
This material was produced by ARSSBL, solely for information purposes and for the use of the recipient. It is not to be reproduced under any circumstances and is not to be
copied or made available to any person other than the recipient. It is distributed in the United States of America by Enclave Capital LLC (19 West 44th Street, Suite 1700, New
York, NY 10036) and elsewhere in the world by ARSSBL or an authorized affiliate of ARSSBL (such entities and any other entity, directly or indirectly, controlled by ARSSBL,
the “Affiliates”). This document does not constitute an offer of, or an invitation by or on behalf of ARSSBL or its Affiliates or any other company to any person, to buy or sell
any security. The information contained herein has been obtained from published information and other sources, which ARSSBL or its Affiliates consider to be reliable. None
of ARSSBL or its Affiliates accepts any liability or responsibility whatsoever for the accuracy or completeness of any such information. All estimates, expressions of opinion
and other subjective judgments contained herein are made as of the date of this document. Emerging securities markets may be subject to risks significantly higher than more
established markets. In particular, the political and economic environment, company practices and market prices and volumes may be subject to significant variations. The
ability to assess such risks may also be limited due to significantly lower information quantity and quality. By accepting this document, you agree to be bound by all the
foregoing provisions.
1. ARSSBL or its Affiliates may or may not have been beneficial owners of the securities mentioned in this report.
2. ARSSBL or its affiliates may have or not managed or co-managed a public offering of the securities mentioned in the report in the past 12 months.
3. ARSSBL or its affiliates may have or not received compensation for investment banking services from the issuer of these securities in the past 12 months and do not expect
to receive compensation for investment banking services from the issuer of these securities within the next three months.
4. However, one or more of ARSSBL or its Affiliates may, from time to time, have a long or short position in any of the securities mentioned herein and may buy or sell those
securities or options thereon, either on their own account or on behalf of their clients.
5. As of the publication of this report, ARSSBL does not make a market in the subject securities.
6. ARSSBL or its Affiliates may or may not, to the extent permitted by law, act upon or use the above material or the conclusions stated above, or the research or analysis on
which they are based before the material is published to recipients and from time to time, provide investment banking, investment management or other services for or solicit
to seek to obtain investment banking, or other securities business from, any entity referred to in this report.
Enclave Capital LLC is distributing this document in the United States of America. ARSSBL accepts responsibility for its contents. Any US customer wishing to effect
transactions in any securities referred to herein or options thereon should do so only by contacting a representative of Enclave Capital LLC.
© 2016. This report is strictly confidential and is being furnished to you solely for your information. All material presented in this report, unless specifically indicated otherwise,
is under copyright to ARSSBL. None of the material, its content, or any copy of such material or content, may be altered in any way, transmitted, copied or reproduced (in
whole or in part) or redistributed in any form to any other party, without the prior express written permission of ARSSBL. All trademarks, service marks and logos used in this
report are trademarks or service marks or registered trademarks or service marks of ARSSBL or its affiliates, unless specifically mentioned otherwise.
Additional information on recommended securities/instruments is available on request.
ARSSBL registered address: 4th Floor, Silver Metropolis, Jaicoach Compound, Opposite Bimbisar Nagar, Goregaon (East), Mumbai - 400 063.
Tel No: +91 22 4001 3700 | Fax No: +91 22 4001 3770 | CIN: U67120MH1991PLC064106.

More Related Content

What's hot

ENIL 1QFY18
ENIL 1QFY18ENIL 1QFY18
ENIL 1QFY18Mohit Jn
 
Maruti suzuki ru2 qfy2011-291010
Maruti suzuki   ru2 qfy2011-291010Maruti suzuki   ru2 qfy2011-291010
Maruti suzuki ru2 qfy2011-291010Angel Broking
 
Motherson Sumi Systems - Result Update
Motherson Sumi Systems - Result UpdateMotherson Sumi Systems - Result Update
Motherson Sumi Systems - Result UpdateAngel Broking
 
20160502 olympus pres
20160502 olympus pres20160502 olympus pres
20160502 olympus presTravis Lundy
 
Entertainment Network Ltd: Stock Price & Q4 Results Of Entertainment Network ...
Entertainment Network Ltd: Stock Price & Q4 Results Of Entertainment Network ...Entertainment Network Ltd: Stock Price & Q4 Results Of Entertainment Network ...
Entertainment Network Ltd: Stock Price & Q4 Results Of Entertainment Network ...hdfcsecurities1
 
Second Quarter of Fiscal Year Ending March 2017 Briefing on Financial Results
Second Quarter of Fiscal Year Ending March 2017 Briefing on Financial ResultsSecond Quarter of Fiscal Year Ending March 2017 Briefing on Financial Results
Second Quarter of Fiscal Year Ending March 2017 Briefing on Financial ResultsRicohLease
 
Cipla Q2 disappoints, gearing up for strong H2FY15E
Cipla Q2 disappoints, gearing up for strong H2FY15ECipla Q2 disappoints, gearing up for strong H2FY15E
Cipla Q2 disappoints, gearing up for strong H2FY15EIndiaNotes.com
 
Mahindra Financial result update: 4QFY15 PAT up 7% YoY and 144% QoQ
Mahindra Financial result update: 4QFY15 PAT up 7% YoY and 144% QoQMahindra Financial result update: 4QFY15 PAT up 7% YoY and 144% QoQ
Mahindra Financial result update: 4QFY15 PAT up 7% YoY and 144% QoQIndiaNotes.com
 
Fiscal Year Ended March 2016 Briefing on Financial Results
Fiscal Year Ended March 2016 Briefing on Financial ResultsFiscal Year Ended March 2016 Briefing on Financial Results
Fiscal Year Ended March 2016 Briefing on Financial ResultsRicohLease
 
Bharat forge ru2 qfy2011-221010
Bharat forge ru2 qfy2011-221010Bharat forge ru2 qfy2011-221010
Bharat forge ru2 qfy2011-221010Angel Broking
 
Stock Tip: Buy this stock for a target of Rs270
Stock Tip: Buy this stock for a target of Rs270Stock Tip: Buy this stock for a target of Rs270
Stock Tip: Buy this stock for a target of Rs270IndiaNotes.com
 

What's hot (13)

ENIL 1QFY18
ENIL 1QFY18ENIL 1QFY18
ENIL 1QFY18
 
Maruti suzuki ru2 qfy2011-291010
Maruti suzuki   ru2 qfy2011-291010Maruti suzuki   ru2 qfy2011-291010
Maruti suzuki ru2 qfy2011-291010
 
M&A Advisory Firms jmfl
M&A Advisory Firms   jmflM&A Advisory Firms   jmfl
M&A Advisory Firms jmfl
 
Motherson Sumi Systems - Result Update
Motherson Sumi Systems - Result UpdateMotherson Sumi Systems - Result Update
Motherson Sumi Systems - Result Update
 
20160502 olympus pres
20160502 olympus pres20160502 olympus pres
20160502 olympus pres
 
Entertainment Network Ltd: Stock Price & Q4 Results Of Entertainment Network ...
Entertainment Network Ltd: Stock Price & Q4 Results Of Entertainment Network ...Entertainment Network Ltd: Stock Price & Q4 Results Of Entertainment Network ...
Entertainment Network Ltd: Stock Price & Q4 Results Of Entertainment Network ...
 
Second Quarter of Fiscal Year Ending March 2017 Briefing on Financial Results
Second Quarter of Fiscal Year Ending March 2017 Briefing on Financial ResultsSecond Quarter of Fiscal Year Ending March 2017 Briefing on Financial Results
Second Quarter of Fiscal Year Ending March 2017 Briefing on Financial Results
 
Cipla Q2 disappoints, gearing up for strong H2FY15E
Cipla Q2 disappoints, gearing up for strong H2FY15ECipla Q2 disappoints, gearing up for strong H2FY15E
Cipla Q2 disappoints, gearing up for strong H2FY15E
 
Loan against shares
Loan against sharesLoan against shares
Loan against shares
 
Mahindra Financial result update: 4QFY15 PAT up 7% YoY and 144% QoQ
Mahindra Financial result update: 4QFY15 PAT up 7% YoY and 144% QoQMahindra Financial result update: 4QFY15 PAT up 7% YoY and 144% QoQ
Mahindra Financial result update: 4QFY15 PAT up 7% YoY and 144% QoQ
 
Fiscal Year Ended March 2016 Briefing on Financial Results
Fiscal Year Ended March 2016 Briefing on Financial ResultsFiscal Year Ended March 2016 Briefing on Financial Results
Fiscal Year Ended March 2016 Briefing on Financial Results
 
Bharat forge ru2 qfy2011-221010
Bharat forge ru2 qfy2011-221010Bharat forge ru2 qfy2011-221010
Bharat forge ru2 qfy2011-221010
 
Stock Tip: Buy this stock for a target of Rs270
Stock Tip: Buy this stock for a target of Rs270Stock Tip: Buy this stock for a target of Rs270
Stock Tip: Buy this stock for a target of Rs270
 

Similar to Persistent 1QFY18

Mindtree 1QFY18
Mindtree 1QFY18Mindtree 1QFY18
Mindtree 1QFY18Mohit Jn
 
Firstsource 1QFY18
Firstsource 1QFY18Firstsource 1QFY18
Firstsource 1QFY18Mohit Jn
 
FSOL 1QFY18
FSOL 1QFY18FSOL 1QFY18
FSOL 1QFY18Mohit Jn
 
Nirmal pi industries_03_aug15
Nirmal pi industries_03_aug15Nirmal pi industries_03_aug15
Nirmal pi industries_03_aug15IndiaNotes.com
 
Financial Ratio Analysis PowerPoint Presentation Slides
Financial Ratio Analysis PowerPoint Presentation SlidesFinancial Ratio Analysis PowerPoint Presentation Slides
Financial Ratio Analysis PowerPoint Presentation SlidesSlideTeam
 
Cyient announces acquisition of GSE-Asia, maintain hold
Cyient announces acquisition of GSE-Asia, maintain holdCyient announces acquisition of GSE-Asia, maintain hold
Cyient announces acquisition of GSE-Asia, maintain holdIndiaNotes.com
 
Budgeting And Forecasting In Accounting PowerPoint Presentation Slides
Budgeting And Forecasting In Accounting PowerPoint Presentation SlidesBudgeting And Forecasting In Accounting PowerPoint Presentation Slides
Budgeting And Forecasting In Accounting PowerPoint Presentation SlidesSlideTeam
 
Prabhudas lilladher techmahindra_29june_2015
Prabhudas lilladher techmahindra_29june_2015Prabhudas lilladher techmahindra_29june_2015
Prabhudas lilladher techmahindra_29june_2015IndiaNotes.com
 
EISEC - Grauer and weil (India) Ltd_Q2FY15
EISEC - Grauer and weil (India) Ltd_Q2FY15EISEC - Grauer and weil (India) Ltd_Q2FY15
EISEC - Grauer and weil (India) Ltd_Q2FY15Pushkaraj Jamsandekar
 
Stock Market Report For Investors -Sai Proficient
Stock Market Report For Investors -Sai ProficientStock Market Report For Investors -Sai Proficient
Stock Market Report For Investors -Sai Proficientsai proficient research
 
Financial Analysis Module PowerPoint Presentation Slides
Financial Analysis Module PowerPoint Presentation SlidesFinancial Analysis Module PowerPoint Presentation Slides
Financial Analysis Module PowerPoint Presentation SlidesSlideTeam
 
Crompton Greaves 3QFY15 performance remains a mixed bag; buy
Crompton Greaves 3QFY15 performance remains a mixed bag; buyCrompton Greaves 3QFY15 performance remains a mixed bag; buy
Crompton Greaves 3QFY15 performance remains a mixed bag; buyIndiaNotes.com
 
Asset Reconstruction Company
Asset Reconstruction CompanyAsset Reconstruction Company
Asset Reconstruction Companypriteshsawant120
 
Asset Reconstruction Company
Asset Reconstruction CompanyAsset Reconstruction Company
Asset Reconstruction Companyajay suryawanshi
 
Asset Reconstruction Company In India
Asset Reconstruction Company In IndiaAsset Reconstruction Company In India
Asset Reconstruction Company In Indiarachanajagtap54
 
Asset Reconstruction Company
Asset Reconstruction CompanyAsset Reconstruction Company
Asset Reconstruction Companypriteshsawant120
 
Merger And Acquisition Companies
Merger And Acquisition CompaniesMerger And Acquisition Companies
Merger And Acquisition Companiesrohinikamble420
 
Asset Reconstruction Company India
Asset Reconstruction Company IndiaAsset Reconstruction Company India
Asset Reconstruction Company Indiarohinikamble420
 

Similar to Persistent 1QFY18 (20)

Mindtree 1QFY18
Mindtree 1QFY18Mindtree 1QFY18
Mindtree 1QFY18
 
Sonata IC
Sonata ICSonata IC
Sonata IC
 
Firstsource 1QFY18
Firstsource 1QFY18Firstsource 1QFY18
Firstsource 1QFY18
 
FSOL 1QFY18
FSOL 1QFY18FSOL 1QFY18
FSOL 1QFY18
 
Nirmal pi industries_03_aug15
Nirmal pi industries_03_aug15Nirmal pi industries_03_aug15
Nirmal pi industries_03_aug15
 
Financial Ratio Analysis PowerPoint Presentation Slides
Financial Ratio Analysis PowerPoint Presentation SlidesFinancial Ratio Analysis PowerPoint Presentation Slides
Financial Ratio Analysis PowerPoint Presentation Slides
 
Cyient announces acquisition of GSE-Asia, maintain hold
Cyient announces acquisition of GSE-Asia, maintain holdCyient announces acquisition of GSE-Asia, maintain hold
Cyient announces acquisition of GSE-Asia, maintain hold
 
Budgeting And Forecasting In Accounting PowerPoint Presentation Slides
Budgeting And Forecasting In Accounting PowerPoint Presentation SlidesBudgeting And Forecasting In Accounting PowerPoint Presentation Slides
Budgeting And Forecasting In Accounting PowerPoint Presentation Slides
 
Prabhudas lilladher techmahindra_29june_2015
Prabhudas lilladher techmahindra_29june_2015Prabhudas lilladher techmahindra_29june_2015
Prabhudas lilladher techmahindra_29june_2015
 
Example print out-efm-de
Example print out-efm-deExample print out-efm-de
Example print out-efm-de
 
EISEC - Grauer and weil (India) Ltd_Q2FY15
EISEC - Grauer and weil (India) Ltd_Q2FY15EISEC - Grauer and weil (India) Ltd_Q2FY15
EISEC - Grauer and weil (India) Ltd_Q2FY15
 
Stock Market Report For Investors -Sai Proficient
Stock Market Report For Investors -Sai ProficientStock Market Report For Investors -Sai Proficient
Stock Market Report For Investors -Sai Proficient
 
Financial Analysis Module PowerPoint Presentation Slides
Financial Analysis Module PowerPoint Presentation SlidesFinancial Analysis Module PowerPoint Presentation Slides
Financial Analysis Module PowerPoint Presentation Slides
 
Crompton Greaves 3QFY15 performance remains a mixed bag; buy
Crompton Greaves 3QFY15 performance remains a mixed bag; buyCrompton Greaves 3QFY15 performance remains a mixed bag; buy
Crompton Greaves 3QFY15 performance remains a mixed bag; buy
 
Asset Reconstruction Company
Asset Reconstruction CompanyAsset Reconstruction Company
Asset Reconstruction Company
 
Asset Reconstruction Company
Asset Reconstruction CompanyAsset Reconstruction Company
Asset Reconstruction Company
 
Asset Reconstruction Company In India
Asset Reconstruction Company In IndiaAsset Reconstruction Company In India
Asset Reconstruction Company In India
 
Asset Reconstruction Company
Asset Reconstruction CompanyAsset Reconstruction Company
Asset Reconstruction Company
 
Merger And Acquisition Companies
Merger And Acquisition CompaniesMerger And Acquisition Companies
Merger And Acquisition Companies
 
Asset Reconstruction Company India
Asset Reconstruction Company IndiaAsset Reconstruction Company India
Asset Reconstruction Company India
 

Recently uploaded

Call Girls In Mahipalpur O9654467111 Escorts Service
Call Girls In Mahipalpur O9654467111  Escorts ServiceCall Girls In Mahipalpur O9654467111  Escorts Service
Call Girls In Mahipalpur O9654467111 Escorts ServiceSapana Sha
 
9711147426✨Call In girls Gurgaon Sector 31. SCO 25 escort service
9711147426✨Call In girls Gurgaon Sector 31. SCO 25 escort service9711147426✨Call In girls Gurgaon Sector 31. SCO 25 escort service
9711147426✨Call In girls Gurgaon Sector 31. SCO 25 escort servicejennyeacort
 
(PARI) Call Girls Wanowrie ( 7001035870 ) HI-Fi Pune Escorts Service
(PARI) Call Girls Wanowrie ( 7001035870 ) HI-Fi Pune Escorts Service(PARI) Call Girls Wanowrie ( 7001035870 ) HI-Fi Pune Escorts Service
(PARI) Call Girls Wanowrie ( 7001035870 ) HI-Fi Pune Escorts Serviceranjana rawat
 
1:1定制(UQ毕业证)昆士兰大学毕业证成绩单修改留信学历认证原版一模一样
1:1定制(UQ毕业证)昆士兰大学毕业证成绩单修改留信学历认证原版一模一样1:1定制(UQ毕业证)昆士兰大学毕业证成绩单修改留信学历认证原版一模一样
1:1定制(UQ毕业证)昆士兰大学毕业证成绩单修改留信学历认证原版一模一样vhwb25kk
 
High Class Call Girls Noida Sector 39 Aarushi 🔝8264348440🔝 Independent Escort...
High Class Call Girls Noida Sector 39 Aarushi 🔝8264348440🔝 Independent Escort...High Class Call Girls Noida Sector 39 Aarushi 🔝8264348440🔝 Independent Escort...
High Class Call Girls Noida Sector 39 Aarushi 🔝8264348440🔝 Independent Escort...soniya singh
 
Brighton SEO | April 2024 | Data Storytelling
Brighton SEO | April 2024 | Data StorytellingBrighton SEO | April 2024 | Data Storytelling
Brighton SEO | April 2024 | Data StorytellingNeil Barnes
 
PKS-TGC-1084-630 - Stage 1 Proposal.pptx
PKS-TGC-1084-630 - Stage 1 Proposal.pptxPKS-TGC-1084-630 - Stage 1 Proposal.pptx
PKS-TGC-1084-630 - Stage 1 Proposal.pptxPramod Kumar Srivastava
 
Dubai Call Girls Wifey O52&786472 Call Girls Dubai
Dubai Call Girls Wifey O52&786472 Call Girls DubaiDubai Call Girls Wifey O52&786472 Call Girls Dubai
Dubai Call Girls Wifey O52&786472 Call Girls Dubaihf8803863
 
Call Girls In Dwarka 9654467111 Escorts Service
Call Girls In Dwarka 9654467111 Escorts ServiceCall Girls In Dwarka 9654467111 Escorts Service
Call Girls In Dwarka 9654467111 Escorts ServiceSapana Sha
 
Industrialised data - the key to AI success.pdf
Industrialised data - the key to AI success.pdfIndustrialised data - the key to AI success.pdf
Industrialised data - the key to AI success.pdfLars Albertsson
 
VIP Call Girls Service Miyapur Hyderabad Call +91-8250192130
VIP Call Girls Service Miyapur Hyderabad Call +91-8250192130VIP Call Girls Service Miyapur Hyderabad Call +91-8250192130
VIP Call Girls Service Miyapur Hyderabad Call +91-8250192130Suhani Kapoor
 
EMERCE - 2024 - AMSTERDAM - CROSS-PLATFORM TRACKING WITH GOOGLE ANALYTICS.pptx
EMERCE - 2024 - AMSTERDAM - CROSS-PLATFORM  TRACKING WITH GOOGLE ANALYTICS.pptxEMERCE - 2024 - AMSTERDAM - CROSS-PLATFORM  TRACKING WITH GOOGLE ANALYTICS.pptx
EMERCE - 2024 - AMSTERDAM - CROSS-PLATFORM TRACKING WITH GOOGLE ANALYTICS.pptxthyngster
 
RA-11058_IRR-COMPRESS Do 198 series of 1998
RA-11058_IRR-COMPRESS Do 198 series of 1998RA-11058_IRR-COMPRESS Do 198 series of 1998
RA-11058_IRR-COMPRESS Do 198 series of 1998YohFuh
 
Predictive Analysis - Using Insight-informed Data to Determine Factors Drivin...
Predictive Analysis - Using Insight-informed Data to Determine Factors Drivin...Predictive Analysis - Using Insight-informed Data to Determine Factors Drivin...
Predictive Analysis - Using Insight-informed Data to Determine Factors Drivin...ThinkInnovation
 
{Pooja: 9892124323 } Call Girl in Mumbai | Jas Kaur Rate 4500 Free Hotel Del...
{Pooja:  9892124323 } Call Girl in Mumbai | Jas Kaur Rate 4500 Free Hotel Del...{Pooja:  9892124323 } Call Girl in Mumbai | Jas Kaur Rate 4500 Free Hotel Del...
{Pooja: 9892124323 } Call Girl in Mumbai | Jas Kaur Rate 4500 Free Hotel Del...Pooja Nehwal
 
Call Girls in Defence Colony Delhi 💯Call Us 🔝8264348440🔝
Call Girls in Defence Colony Delhi 💯Call Us 🔝8264348440🔝Call Girls in Defence Colony Delhi 💯Call Us 🔝8264348440🔝
Call Girls in Defence Colony Delhi 💯Call Us 🔝8264348440🔝soniya singh
 
Call Us ➥97111√47426🤳Call Girls in Aerocity (Delhi NCR)
Call Us ➥97111√47426🤳Call Girls in Aerocity (Delhi NCR)Call Us ➥97111√47426🤳Call Girls in Aerocity (Delhi NCR)
Call Us ➥97111√47426🤳Call Girls in Aerocity (Delhi NCR)jennyeacort
 
dokumen.tips_chapter-4-transient-heat-conduction-mehmet-kanoglu.ppt
dokumen.tips_chapter-4-transient-heat-conduction-mehmet-kanoglu.pptdokumen.tips_chapter-4-transient-heat-conduction-mehmet-kanoglu.ppt
dokumen.tips_chapter-4-transient-heat-conduction-mehmet-kanoglu.pptSonatrach
 
办理(Vancouver毕业证书)加拿大温哥华岛大学毕业证成绩单原版一比一
办理(Vancouver毕业证书)加拿大温哥华岛大学毕业证成绩单原版一比一办理(Vancouver毕业证书)加拿大温哥华岛大学毕业证成绩单原版一比一
办理(Vancouver毕业证书)加拿大温哥华岛大学毕业证成绩单原版一比一F La
 

Recently uploaded (20)

Call Girls In Mahipalpur O9654467111 Escorts Service
Call Girls In Mahipalpur O9654467111  Escorts ServiceCall Girls In Mahipalpur O9654467111  Escorts Service
Call Girls In Mahipalpur O9654467111 Escorts Service
 
9711147426✨Call In girls Gurgaon Sector 31. SCO 25 escort service
9711147426✨Call In girls Gurgaon Sector 31. SCO 25 escort service9711147426✨Call In girls Gurgaon Sector 31. SCO 25 escort service
9711147426✨Call In girls Gurgaon Sector 31. SCO 25 escort service
 
(PARI) Call Girls Wanowrie ( 7001035870 ) HI-Fi Pune Escorts Service
(PARI) Call Girls Wanowrie ( 7001035870 ) HI-Fi Pune Escorts Service(PARI) Call Girls Wanowrie ( 7001035870 ) HI-Fi Pune Escorts Service
(PARI) Call Girls Wanowrie ( 7001035870 ) HI-Fi Pune Escorts Service
 
1:1定制(UQ毕业证)昆士兰大学毕业证成绩单修改留信学历认证原版一模一样
1:1定制(UQ毕业证)昆士兰大学毕业证成绩单修改留信学历认证原版一模一样1:1定制(UQ毕业证)昆士兰大学毕业证成绩单修改留信学历认证原版一模一样
1:1定制(UQ毕业证)昆士兰大学毕业证成绩单修改留信学历认证原版一模一样
 
High Class Call Girls Noida Sector 39 Aarushi 🔝8264348440🔝 Independent Escort...
High Class Call Girls Noida Sector 39 Aarushi 🔝8264348440🔝 Independent Escort...High Class Call Girls Noida Sector 39 Aarushi 🔝8264348440🔝 Independent Escort...
High Class Call Girls Noida Sector 39 Aarushi 🔝8264348440🔝 Independent Escort...
 
Brighton SEO | April 2024 | Data Storytelling
Brighton SEO | April 2024 | Data StorytellingBrighton SEO | April 2024 | Data Storytelling
Brighton SEO | April 2024 | Data Storytelling
 
PKS-TGC-1084-630 - Stage 1 Proposal.pptx
PKS-TGC-1084-630 - Stage 1 Proposal.pptxPKS-TGC-1084-630 - Stage 1 Proposal.pptx
PKS-TGC-1084-630 - Stage 1 Proposal.pptx
 
Dubai Call Girls Wifey O52&786472 Call Girls Dubai
Dubai Call Girls Wifey O52&786472 Call Girls DubaiDubai Call Girls Wifey O52&786472 Call Girls Dubai
Dubai Call Girls Wifey O52&786472 Call Girls Dubai
 
Call Girls In Dwarka 9654467111 Escorts Service
Call Girls In Dwarka 9654467111 Escorts ServiceCall Girls In Dwarka 9654467111 Escorts Service
Call Girls In Dwarka 9654467111 Escorts Service
 
Industrialised data - the key to AI success.pdf
Industrialised data - the key to AI success.pdfIndustrialised data - the key to AI success.pdf
Industrialised data - the key to AI success.pdf
 
VIP Call Girls Service Miyapur Hyderabad Call +91-8250192130
VIP Call Girls Service Miyapur Hyderabad Call +91-8250192130VIP Call Girls Service Miyapur Hyderabad Call +91-8250192130
VIP Call Girls Service Miyapur Hyderabad Call +91-8250192130
 
EMERCE - 2024 - AMSTERDAM - CROSS-PLATFORM TRACKING WITH GOOGLE ANALYTICS.pptx
EMERCE - 2024 - AMSTERDAM - CROSS-PLATFORM  TRACKING WITH GOOGLE ANALYTICS.pptxEMERCE - 2024 - AMSTERDAM - CROSS-PLATFORM  TRACKING WITH GOOGLE ANALYTICS.pptx
EMERCE - 2024 - AMSTERDAM - CROSS-PLATFORM TRACKING WITH GOOGLE ANALYTICS.pptx
 
RA-11058_IRR-COMPRESS Do 198 series of 1998
RA-11058_IRR-COMPRESS Do 198 series of 1998RA-11058_IRR-COMPRESS Do 198 series of 1998
RA-11058_IRR-COMPRESS Do 198 series of 1998
 
Predictive Analysis - Using Insight-informed Data to Determine Factors Drivin...
Predictive Analysis - Using Insight-informed Data to Determine Factors Drivin...Predictive Analysis - Using Insight-informed Data to Determine Factors Drivin...
Predictive Analysis - Using Insight-informed Data to Determine Factors Drivin...
 
{Pooja: 9892124323 } Call Girl in Mumbai | Jas Kaur Rate 4500 Free Hotel Del...
{Pooja:  9892124323 } Call Girl in Mumbai | Jas Kaur Rate 4500 Free Hotel Del...{Pooja:  9892124323 } Call Girl in Mumbai | Jas Kaur Rate 4500 Free Hotel Del...
{Pooja: 9892124323 } Call Girl in Mumbai | Jas Kaur Rate 4500 Free Hotel Del...
 
Call Girls in Defence Colony Delhi 💯Call Us 🔝8264348440🔝
Call Girls in Defence Colony Delhi 💯Call Us 🔝8264348440🔝Call Girls in Defence Colony Delhi 💯Call Us 🔝8264348440🔝
Call Girls in Defence Colony Delhi 💯Call Us 🔝8264348440🔝
 
Call Us ➥97111√47426🤳Call Girls in Aerocity (Delhi NCR)
Call Us ➥97111√47426🤳Call Girls in Aerocity (Delhi NCR)Call Us ➥97111√47426🤳Call Girls in Aerocity (Delhi NCR)
Call Us ➥97111√47426🤳Call Girls in Aerocity (Delhi NCR)
 
꧁❤ Aerocity Call Girls Service Aerocity Delhi ❤꧂ 9999965857 ☎️ Hard And Sexy ...
꧁❤ Aerocity Call Girls Service Aerocity Delhi ❤꧂ 9999965857 ☎️ Hard And Sexy ...꧁❤ Aerocity Call Girls Service Aerocity Delhi ❤꧂ 9999965857 ☎️ Hard And Sexy ...
꧁❤ Aerocity Call Girls Service Aerocity Delhi ❤꧂ 9999965857 ☎️ Hard And Sexy ...
 
dokumen.tips_chapter-4-transient-heat-conduction-mehmet-kanoglu.ppt
dokumen.tips_chapter-4-transient-heat-conduction-mehmet-kanoglu.pptdokumen.tips_chapter-4-transient-heat-conduction-mehmet-kanoglu.ppt
dokumen.tips_chapter-4-transient-heat-conduction-mehmet-kanoglu.ppt
 
办理(Vancouver毕业证书)加拿大温哥华岛大学毕业证成绩单原版一比一
办理(Vancouver毕业证书)加拿大温哥华岛大学毕业证成绩单原版一比一办理(Vancouver毕业证书)加拿大温哥华岛大学毕业证成绩单原版一比一
办理(Vancouver毕业证书)加拿大温哥华岛大学毕业证成绩单原版一比一
 

Persistent 1QFY18

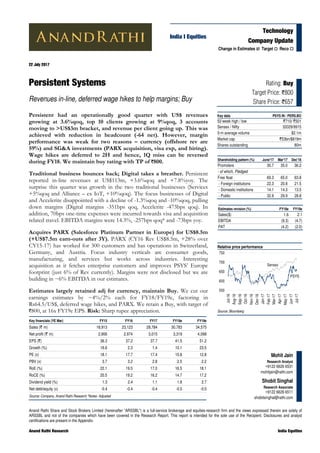
  • 1. Anand Rathi Share and Stock Brokers Limited (hereinafter “ARSSBL”) is a full-service brokerage and equities-research firm and the views expressed therein are solely of ARSSBL and not of the companies which have been covered in the Research Report. This report is intended for the sole use of the Recipient. Disclosures and analyst certifications are present in the Appendix. Anand Rathi Research India Equities Technology Company Update India I Equities Mohit Jain Research Analyst +9122 6626 6531 mohitjain@rathi.com Shobit Singhal Research Associate +9122 6626 6511 shobitsinghal@rathi.com Key financials (YE Mar) FY15 FY16 FY17 FY18e FY19e Sales (` m) 18,913 23,123 28,784 30,783 34,575 Net profit (` m) 2,906 2,974 3,015 3,319 4,098 EPS (`) 36.3 37.2 37.7 41.5 51.2 Growth (%) 16.6 2.3 1.4 10.1 23.5 PE (x) 18.1 17.7 17.4 15.8 12.8 PBV (x) 3.7 3.2 2.8 2.5 2.2 RoE (%) 22.1 19.5 17.0 16.5 18.1 RoCE (%) 20.5 19.2 16.2 14.7 17.2 Dividend yield (%) 1.3 2.4 1.1 1.8 2.7 Net debt/equity (x) -0.4 -0.4 -0.4 -0.5 -0.5 Source: Company, Anand Rathi Research *Notes- Adjusted sequentially. , Rating: Buy Target Price: `800 Share Price: `657 Key data PSYS IN / PERS.BO 52-week high / low `710/ `501 Sensex / Nifty 32029/9915 3-m average volume $2.1m Market cap `53bn/$819m Shares outstanding 80m Shareholding pattern (%) June'17 Mar'17 Dec'16 Promoters 30.7 35.0 36.2 - of which, Pledged Free float 69.3 65.0 63.8 - Foreign institutions 22.3 20.8 21.5 - Domestic institutions 14.1 14.3 13.5 - Public 32.9 29.9 28.8 22 July 2017 Persistent Systems Revenues in-line, deferred wage hikes to help margins; Buy Persistent had an operationally good quarter with US$ revenues growing at 3.6%qoq, top 10 clients growing at 9%qoq, 3 accounts moving to >US$3m bracket, and revenue per client going up. This was achieved with reduction in headcount (-64 net). However, margin performance was weak for two reasons – currency (offshore rev are 59%) and SG&A investments (PARX acquisition, visa exp, and hiring). Wage hikes are deferred to 2H and hence, 1Q miss can be reversed during FY18. We maintain buy rating with TP of `800. Traditional business bounces back; Digital takes a breather. Persistent reported in-line revenues at US$113m, +3.6%qoq and +7.8%yoy. The surprise this quarter was growth in the two traditional businesses (Services +5%qoq and Alliance – ex IoT, +10%qoq). The focus businesses of Digital and Accelerite disappointed with a decline of -1.3%qoq and -10%qoq, pulling down margins (Digital margins -351bps qoq, Accelerite -473bps qoq). In addition, 70bps one-time expenses were incurred towards visa and acquisition related travel. EBITDA margins were 14.3%, -257bps qoq* and -73bps yoy. Acquires PARX (Salesforce Platinum Partner in Europe) for US$8.5m (+US$7.5m earn-outs after 3Y). PARX (CY16 Rev US$8.5m, +28% over CY15-17) has worked for 300 customers and has operations in Switzerland, Germany, and Austria. Focus industry verticals are consumer goods, manufacturing, and services but works across industries. Interesting acquisition as it fetches enterprise customers and improves PSYS’ Europe footprint (just 6% of Rev currently). Margins were not disclosed but we are building in ~6% EBITDA in our estimates. Estimates largely retained adj for currency, maintain Buy. We cut our earnings estimates by ~4%/2% each for FY18/FY19e, factoring in Rs64.5/US$, deferred wage hikes, and PARX. We retain a Buy, with target of `800, at 16x FY19e EPS. Risk: Sharp rupee appreciation. Relative price performance Source: Bloomberg PSYS Sensex 550 600 650 700 750 Jul-16 Aug-16 Sep-16 Oct-16 Nov-16 Dec-16 Jan-17 Feb-17 Mar-17 Apr-17 May-17 Jun-17 Jul-17 Estimates revision (%) FY18e FY19e Sales($) 1.6 2.1 EBITDA (9.3) (4.7) PAT (4.2) (2.0) Change in Estimates  Target  Reco 
  • 2. 22 July 2017 Persistent Systems – Revenues in-line, deferred wage hikes to help margins; Buy Anand Rathi Research 2 Quick Glance – Financials and Valuations Fig 1 – Income statement (`m) Year-end: Mar FY15 FY16 FY17 FY18e FY19e Net revenues 18,913 23,123 28,784 30,783 34,575 Revenue growth (%) 13.3 22.3 24.5 6.9 12.3 - Oper. expenses 15,007 18,952 24,131 25,942 28,585 EBIDTA 3,906 4,171 4,653 4,842 5,990 EBITDA margins (%) 20.7 18.0 16.2 15.7 17.3 - Interest - - - - - - Depreciation 939 965 1,490 1,548 1,621 + Other income 932 750 843 1,106 1,050 - Tax 993 983 992 1,080 1,320 Effective tax rate (%) 25.5 24.8 24.8 24.6 24.4 + Associates/(minorities) - - - - - Adjusted PAT 2,906 2,974 3,015 3,319 4,098 + Extraordinary items - - - - - Reported PAT 2,906 2,974 3,015 3,319 4,098 Adj. FDEPS (`/sh) 36.3 37.2 37.7 41.5 51.2 Adj. FDEPS growth (%) 16.6 2.3 1.4 10.1 23.5 Source: Company, Anand Rathi Research Fig 3 – Cash-flow statement (`m) Year-end: Mar FY15 FY16 FY17 FY18e FY19e Adjusted PAT 2,906 2,974 3,015 3,319 4,098 + Non-cash items 939 965 1,490 1,548 1,621 Cash profit 3,845 3,939 4,505 4,867 5,719 - Incr./(decr.) in WC 186 1,594 614 34 347 Operating cash-flow 3,659 2,344 3,891 4,833 5,372 - Capex 670 1,477 2,511 569 1,150 Free cash-flow 2,989 868 1,379 4,264 4,222 - Dividend 667 1,251 578 963 1,393 + Equity raised -405 613 163 -0 - + Debt raised -62 84 -172 - - - Investments 1,854 297 716 1,627 2,115 - Misc. items - - - - - Net cash-flow 0 16 76 1,675 714 + Op. cash & bank bal. 1,416 1,416 1,432 1,510 3,184 Cl. Cash & bank bal. 1,416 1,432 1,510 3,184 3,898 Source: Company, Anand Rathi Research Fig 5 – Price movement Source: Bloomberg Fig 2 – Balance sheet (`m) Year-end: Mar FY15 FY16 FY17 FY18e FY19e Share capital 800 800 800 800 800 Reserves & surplus 13,258 15,593 18,193 20,549 23,254 Net worth 14,058 16,393 18,993 21,349 24,054 Total debt 25 26 22 22 22 Minority interest - - - - - Def. tax liab. (net) -315 -233 -401 -401 -401 Capital employed 13,767 16,186 18,614 20,970 23,675 Net fixed assets 3,097 3,031 2,817 3,021 3,162 Intangible assets 1,019 1,597 2,832 1,648 1,037 Investments 6,749 7,046 7,761 9,388 11,503 - of which, Liquid 4,620 4,828 5,422 7,049 9,163 Working capital 1,486 3,080 3,694 3,728 4,075 Cash 1,416 1,432 1,510 3,184 3,898 Capital deployed 13,767 16,186 18,614 20,970 23,675 Working capital (days) 29 49 47 44 43 Book value (`/sh) 175.7 204.9 237.4 266.9 300.7 Source: Company, Anand Rathi Research Fig 4 – Ratio analysis@ `657 Year-end: Mar FY15 FY16 FY17 FY18e FY19e P/E (x) 18.1 17.7 17.4 15.8 12.8 Cash P/E (x) 13.7 13.3 11.7 10.8 9.2 EV/EBITDA (x) 11.9 11.1 9.8 8.7 6.6 EV/sales (x) 2.5 2.0 1.6 1.4 1.1 P/B (x) 3.7 3.2 2.8 2.5 2.2 RoE (%) 22.1 19.5 17.0 16.5 18.1 RoCE (%) 20.5 19.2 16.2 14.7 17.2 Dividend yield (%) 1.3 2.4 1.1 1.8 2.7 Dividend payout (%) 23.0 42.1 19.2 29.0 34.0 Net debt/equity (x) -0.4 -0.4 -0.4 -0.5 -0.5 Debtor (days) 69 67 60 60 60 Inventory (days) - - - - - Payables (days) 10 26 15 15 15 CFO:EBITDA% 79.8 60.9 61.5 85.3 73.8 FCF:EBITDA% 55.3 21.1 14.8 61.6 54.6 Source: Company, Anand Rathi Research Fig 6 – Digital revenue Source: Company 100 200 300 400 500 600 700 800 900 1,000 Jul-12 Nov-12 Mar-13 Jul-13 Nov-13 Mar-14 Jul-14 Nov-14 Mar-15 Jul-15 Nov-15 Mar-16 Jul-16 Nov-16 Mar-17 Jul-17 (`) PSYS 15 16 19 21 20 0 5 10 15 20 25 1QFY17 2QFY17 3QFY17 4QFY17 1QFY18 ($m)
  • 3. 22 July 2017 Persistent Systems – Revenues in-line, deferred wage hikes to help margins; Buy Anand Rathi Research 3 Result Highlights Q1FY18 Results at a Glance Fig 8 – Quarterly result Year-end: Mar Q1FY18 % qoq % yoy FY17 FY16 % yoy Sales ($ m) 113 3.6 7.8 429 352 22.0 Sales (`m) 7,280 0.1 3.7 28,784 23,123 24.5 EBITDA (`m) 1,044 (19.8) (1.3) 4,653 4,171 11.6 EBITDA margin (%) 14.3 -357 bps -73 bps 16.2 18.0 -187 bps EBIT (`m) 652 (28.2) (8.8) 3,163 3,206 (1.3) EBIT margin (%) 9.0 -353 bps -123 bps 11.0 13.9 -287 bps PBT (`m) 1,019 8.8 5.3 4,007 3,956 1.3 Tax (`m) (269) 28.8 14.2 (992) (983) 1.0 Tax rate (%) (26.3) -407 bps -205 bps (24.8) (24.8) 8 bps Net Income (`m) 751 3.1 2.5 3,015 2,974 1.4 Source: Company Fig 7 – Segment-wise results Q1FY17 Q2FY17 Q3FY17 Q4FY17 Q1FY18 QoQ% YoY% Revenues ($ m) 105 105 110 109 113 3.6% 7.8% Growth YoY % 33% 27% 23% 9% 8% -73bps -2543bps Volume growth % ND ND ND ND ND Revenues (` m) 7,018 7,040 7,455 7,271 7,280 0% 4% Eff. exchange rate 67.0 66.9 67.8 66.7 64.4 -3% -4% Employees (EoP) 8,698 8,612 8,562 8,808 8,744 Revenue Productivity ($ ‘000/employee) 12.0 12.2 12.9 12.4 12.9 4% 7.3% Gross Utilization (IT services) 75.3% 74.2% 78.9% 77.8% 77.2% -61bps 190bps Attrition 16.7% 15.9% 15.8% 15.7% 15.5% -20bps -120bps CoR (excluding D&A) (4,585) (4,539) (4,751) (4,644) (4,783) 3% 4% As % of Revenues -65% -64% -64% -64% -66% -183bps -37bps SG&A (1,376) (1,394) (1,518) (1,326) (1,453) 10% 6% As % of Revenues -20% -20% -20% -18% -20% -173bps -36bps EBITDA 1,058 1,108 1,187 1,302 1,044 -20% -1% EBITDA margins % 15% 16% 16% 18% 14% -357bps -73bps EBIT 715 741 800 907 652 -28% -9% EBIT margins % 10% 11% 11% 12% 9% -353bps -123bps Other Income 172 203 143 57 183 224% 6% Forex gain/loss 81 41 174 (28) 184 -768% 128% Interest expense PBT 968 984 1,118 936 1,019 9% 5% PBT margins % 14% 14% 15% 13% 14% 112bps 21bps Taxes (235) (250) (299) (209) (269) 29% 14% ETR % -24% -25% -27% -22% -26% 407bps 205bps PAT 733 735 819 728 751 3% 2% PAT Margin % 10% 10% 11% 10% 10% 30bps -13bps Source: Company, Anand Rathi Research
  • 4. 22 July 2017 Persistent Systems – Revenues in-line, deferred wage hikes to help margins; Buy Anand Rathi Research 4 Conference Call Takeaways Company  Impact on margins in Q1FY18- lower offshore utilization impacted 40bps, Currency impacted 120bps, visa cost and PARX acquisition impacted 70bps, incremental onsite hiring impacted 30bps and provisioning of bad debts impacted 40bps.  Hike in wages is deferred from July to October for some employees and from July to January for others.  The rise in `200m for cost of professional is due to hiring of special skill professional for new projects which is of recurring nature.  Acquisition of PARX- Acquired for consideration of upfront $8.5mn and $7.5m after 3 years based on earn-outs. PARX reported revenues of CHF 8mn (~`54cr) in 2016 and consists of 80 people in its workforce (including contractors). The company is profitable although PSYS did not disclose its EBITDA margins.  Management restated that last quarter they managed to move some IBM employees to lower cost geographies. Thus, can expect better management on margins in the IBM alliance going forward.  The company’s product business, Accelerite declined sequentially this quarter due to settlement dispute with one of the customers. Overall pipeline is robust and expects this segment to do well. Notes from the last two quarters’ conference calls From Q4FY17  Revenue growth is expected to be in double digits as Accelerite, Alliance and Digital are expected to continue their growth momentum. Services may continue to be a drag on overall growth rates.  FY18 margins are likely to be better than FY17, as IoT breakseven and some benefits of non-linearity start coming in. From Q3FY17  The services business (44% of revenue) may have constrained growth but the balance (56% of revenue) would grow fast.  The IBM IoT business is likely to break even in FY18. Costs are fixed and hence may not increase in FY18. There are additional levers to reduce costs.
  • 5. 22 July 2017 Persistent Systems – Revenues in-line, deferred wage hikes to help margins; Buy Anand Rathi Research 5 Factsheet Fig 9 – Revenue split (%) Q1FY17 Q2FY17 Q3FY17 Q4FY17 Q1FY18 Effort-Led 71.8 72.2 71.6 72.4 72.8 IP-Led 28.2 27.8 28.4 27.6 27.2 Source: Company Fig 10 – Revenue-split, by region (%) Q1FY17 Q2FY17 Q3FY17 Q4FY17 Q1FY18 North America 87.0 85.4 86.6 86.5 85.5 Europe 5.2 6.1 5.3 5.3 5.9 Asia-Pacific 7.8 8.5 8.1 8.2 8.6 Source: Company Fig 11 – Revenue-split, by segment ($m) Q1FY17 Q2FY17 Q3FY17 Q4FY17 Q1FY18 Services 49.9 49.0 48.3 47.9 50.3 Digital 15 16 19 21 20 Alliance 31.4 30.9 33.7 30.1 33.0 Accelerite 9 9 9 10 9 Source: Company Fig 12 – Client concentration (%) Q1FY17 Q2FY17 Q3FY17 Q4FY17 Q1FY18 Top 1 29.0 28.4 29.5 26.5 27.9 Top 5 44.7 44.3 46.0 43.3 45.7 Top 10 52.7 52.8 54.6 52.4 55.2 Source: Company Fig 13 – Workforce (%) Q1FY17 Q2FY17 Q3FY17 Q4FY17 Q1FY18 Employee Movement Technical(EOP) 8,698 8,612 8,562 8,808 8,744 Net Adds (Qtr) 80 -86 -50 246 -64 Net Adds (LTM) 888 707 228 190 46 Utilization % 75.3 74.2 78.9 77.8 77.2 Attrition % 16.7 15.9 15.8 15.7 15.5 Sales(EOP) 204 207 200 193 210 Net Adds (Qtr) 3 3 (7) (7) 17 Net Adds (LTM) (12) (1) (3) (8) 6 Source: Company
  • 6. 22 July 2017 Persistent Systems – Revenues in-line, deferred wage hikes to help margins; Buy Anand Rathi Research 6 Fig 14 – Revenue-split, by delivery type and billing rates Q1FY17 Q2FY17 Q3FY17 Q4FY17 Q1FY18 Delivery type (%) On-site 26.3 26.3 26.7 27.8 29.9 Offshore 45.5 45.5 44.9 44.6 42.9 Reported billing rates ($ /hr) On-site 82.6 86.1 84.0 85.1 85.8 Offshore 23.1 22.9 22.8 22.7 22.5 Source: Company Fig 15 – Key geographies and horizontals growth (%) (%) Q1FY17 Q2FY17 Q3FY17 Q4FY17 Q1FY18 Horizontals growth (qoq) Services NA -1.7% -1.5% -0.9% 5.0% Digital NA 7.5% 16.3% 10.8% -1.3% Alliance NA -2% 9% -11% 10% Accelerite NA 8% 2% 11% -10% Key area-wise growth (yoy) North America 37.4 25.6 24.6 9.1 6.0 Europe 10.0 13.7 3.3 (14.1) 22.4 Asia-Pacific 11.8 54.0 18.3 23.6 18.9 Source: Company Fig 16 – Segment-wise growth (yoy) (%) Q1FY17 Q2FY17 Q3FY17 Q4FY17 Q1FY18 Effort-Led 17.4 9.2 10.0 9.5 9.2 IP-Led 103.7 117.7 73.5 6.1 4.3 Source: Company
  • 7. 22 July 2017 Persistent Systems – Revenues in-line, deferred wage hikes to help margins; Buy Anand Rathi Research 7 Valuations The stock trades at 12.8x FY19e EPS of `51.2. This, we reckon, is attractive, given that Persistent has a differentiated range of service offerings and is expected to grow at a faster-than-industry rate of ~10%, organically. With a strong balance sheet (cash balance: ~$140m) and cash-flow generation (CFO:NI ~90%), it is one of the best midcap IT stocks, which could command a higher multiple if growth accelerates. The company is likely to touch $536m in revenue by FY19, helping it morph into a reasonably large and differentiated IT-services company. Also, it has margin levers in the business, primarily the offshore mix and utilisation to absorb potential headwinds in margins. More than 50% of Persistent’s business is non-linear (or not dependent on T&M billing), giving it a potential margin upswing if the growth here turns out to be higher. Its reliance on one client is at present a high 28%, but that gives it a better positioning to grow faster by aligning its interests with its largest client. We value Persistent based on a target PE of 16x FY19e EPS, similar to Mindtree and Cyient. This reflects constrained profitability and the potential to grow faster than the industry. Fig 17 – Change in estimates FY18 FY19 New Old Chg % New Old Chg % Revenues ($m) 477 470 1.6 536 525 2.1 Revenues (`m) 30,783 31,335 (1.8) 34,575 35,001 (1.2) EBITDA (`m) 4,842 5,336 (9.3) 5,990 6,287 (4.7) EBITDA margin % 16% 17% (130) 17% 18% (64) EBIT (`m) 3,294 3,742 (12.0) 4,369 4,574 (4.5) EBIT margin % 10.7% 11.9% (124) 12.6% 13.1% (43) PBT 4,399 4,563 (3.6) 5,419 5,510 (1.7) Net profit 3,319 3,464 (4.2) 4,098 4,183 (2.0) Source: Anand Rathi Research Fig 18 – PE band Source: Bloomberg, Anand Rathi Research Risks  Sharp rupee appreciation. 5 9 13 17 21 25 Sep-11 Dec-11 Apr-12 Aug-12 Dec-12 Apr-13 Aug-13 Dec-13 Apr-14 Aug-14 Dec-14 Apr-15 Jul-15 Nov-15 Mar-16 Jul-16 Nov-16 Mar-17 Jul-17 PSYS
  • 8. Appendix Analyst Certification The views expressed in this Research Report accurately reflect the personal views of the analyst(s) about the subject securities or issuers and no part of the compensation of the research analyst(s) was, is, or will be directly or indirectly related to the specific recommendations or views expressed by the research analyst(s) in this report. The research analysts are bound by stringent internal regulations and also legal and statutory requirements of the Securities and Exchange Board of India (hereinafter “SEBI”) and the analysts’ compensation are completely delinked from all the other companies and/or entities of Anand Rathi, and have no bearing whatsoever on any recommendation that they have given in the Research Report. Important Disclosures on subject companies Rating and Target Price History (as of 21 July 2017) Persistent 10 7 1 2 3 4 5 6 8 9 400 500 600 700 800 900 1000 Jan-14 Apr-14 Jul-14 Oct-14 Jan-15 Apr-15 Jul-15 Oct-15 Jan-16 Apr-16 Jul-16 Oct-16 Jan-17 Apr-17 Jul-17 Date Rating TP (`) Share Price (`) 1 30-Sep-14 Buy 975 693 2 05-Jan-15 Buy 1,000 932 3 28-Jan-15 Hold 975 902 4 09-Apr-15 Buy 930 780 5 24-Jun-15 Buy 860 647 6 08-Apr-16 Buy 950 727 7 26-Jul-16 Buy 900 664 8 25-Oct-16 Buy 875 662 9 21-Dec-16 Buy 840 609 10 25-Apr-17 Buy 800 568 Anand Rathi Ratings Definitions Analysts’ ratings and the corresponding expected returns take into account our definitions of Large Caps (>US$1bn) and Mid/Small Caps (<US$1bn) as described in the Ratings Table below: Ratings Guide (12 months) Buy Hold Sell Large Caps (>US$1bn) >15% 5-15% <5% Mid/Small Caps (<US$1bn) >25% 5-25% <5% Research Disclaimer and Disclosure inter-alia as required under Securities and Exchange Board of India (Research Analysts) Regulations, 2014 Anand Rathi Share and Stock Brokers Ltd. (hereinafter refer as ARSSBL) (Research Entity) is a subsidiary of Anand Rathi Financial Services Ltd. ARSSBL is a corporate trading and clearing member of Bombay Stock Exchange Ltd, National Stock Exchange of India Ltd. (NSEIL), Multi Stock Exchange of India Ltd (MCX- SX), United Stock Exchange and also depository participant with National Securities Depository Ltd (NSDL) and Central Depository Services Ltd. ARSSBL is engaged in the business of Stock Broking, Depository Participant and Mutual Fund distributor. The research analysts, strategists, or research associates principally responsible for the preparation of Anand Rathi research have received compensation based upon various factors, including quality of research, investor client feedback, stock picking, competitive factors and firm revenues. General Disclaimer: This Research Report (hereinafter called “Report”) is meant solely for use by the recipient and is not for circulation. This Report does not constitute a personal recommendation or take into account the particular investment objectives, financial situations, or needs of individual clients. The recommendations, if any, made herein are expression of views and/or opinions and should not be deemed or construed to be neither advice for the purpose of purchase or sale of any security, derivatives or any other security through ARSSBL nor any solicitation or offering of any investment /trading opportunity on behalf of the issuer(s) of the respective security (ies) referred to herein. These information / opinions / views are not meant to serve as a professional investment guide for the readers. No action is solicited based upon the information provided herein. Recipients of this Report should rely on information/data arising out of their own investigations. Readers are advised to seek independent professional advice and arrive at an informed trading/investment decision before executing any trades or making any investments. This Report has been prepared on the basis of publicly available information, internally developed data and other sources believed by ARSSBL to be reliable. ARSSBL or its directors, employees, affiliates or representatives do not assume any responsibility for, or warrant the accuracy, completeness, adequacy and reliability of such information / opinions / views. While due care has been taken to ensure that the disclosures and opinions given are fair and reasonable, none of the directors, employees, affiliates or representatives of ARSSBL shall be liable for any direct, indirect, special, incidental, consequential, punitive or exemplary damages, including lost profits arising in any way whatsoever from the information / opinions / views contained in this Report. The price and value of the investments referred to in this Report and the income from them may go down as well as up, and investors may realize losses on any investments. Past performance is not a guide for future performance. ARSSBL does not provide tax advice to its clients, and all investors are strongly advised to consult with their tax advisers regarding taxation aspects of any potential investment. Opinions expressed are our current opinions as of the date appearing on this Research only. We do not undertake to advise you as to any change of our views expressed in this Report. Research Report may differ between ARSSBL’s RAs and/ or ARSSBL’s associate companies on account of differences in research methodology, personal judgment and difference in time horizons for which recommendations are made. User should keep this risk in mind and not hold ARSSBL, its employees and associates responsible for any losses, damages of any type whatsoever.
  • 9. ARSSBL and its associates or employees may; (a) from time to time, have long or short positions in, and buy or sell the investments in/ security of company (ies) mentioned herein or (b) be engaged in any other transaction involving such investments/ securities of company (ies) discussed herein or act as advisor or lender / borrower to such company (ies) these and other activities of ARSSBL and its associates or employees may not be construed as potential conflict of interest with respect to any recommendation and related information and opinions. Without limiting any of the foregoing, in no event shall ARSSBL and its associates or employees or any third party involved in, or related to computing or compiling the information have any liability for any damages of any kind. Details of Associates of ARSSBL and Brief History of Disciplinary action by regulatory authorities & its associates are available on our website i.e. www.rathionline.com Disclaimers in respect of jurisdiction: This report is not directed to, or intended for distribution to or use by, any person or entity who is a citizen or resident of or located in any locality, state, country or other jurisdiction where such distribution, publication, availability or use would be contrary to law or regulation or which would subject ARSSBL to any registration or licensing requirement within such jurisdiction(s). No action has been or will be taken by ARSSBL in any jurisdiction (other than India), where any action for such purpose(s) is required. Accordingly, this Report shall not be possessed, circulated and/or distributed in any such country or jurisdiction unless such action is in compliance with all applicable laws and regulations of such country or jurisdiction. ARSSBL requires such recipient to inform himself about and to observe any restrictions at his own expense, without any liability to ARSSBL. Any dispute arising out of this Report shall be subject to the exclusive jurisdiction of the Courts in India. Statements on ownership and material conflicts of interest, compensation - ARSSBL and Associates Answers to the Best of the knowledge and belief of ARSSBL/ its Associates/ Research Analyst who is preparing this report ARSSBL/its Associates/ Research Analyst/ his Relative have actual/beneficial ownership of one per cent or more securities of the subject company, at the end of the month immediately preceding the date of publication of the research report? No ARSSBL/its Associates/ Research Analyst/ his Relative have actual/beneficial ownership of one per cent or more securities of the subject company No ARSSBL/its Associates/ Research Analyst/ his Relative have any other material conflict of interest at the time of publication of the research report? No ARSSBL/its Associates/ Research Analyst/ his Relative have received any compensation from the subject company in the past twelve months No ARSSBL/its Associates/ Research Analyst/ his Relative have managed or co-managed public offering of securities for the subject company in the past twelve months No ARSSBL/its Associates/ Research Analyst/ his Relative have received any compensation for investment banking or merchant banking or brokerage services from the subject company in the past twelve months No ARSSBL/its Associates/ Research Analyst/ his Relative have received any compensation for products or services other than investment banking or merchant banking or brokerage services from the subject company in the past twelve months No ARSSBL/its Associates/ Research Analyst/ his Relative have received any compensation or other benefits from the subject company or third party in connection with the research report No ARSSBL/its Associates/ Research Analyst/ his Relative have served as an officer, director or employee of the subject company. No Other Disclosures pertaining to distribution of research in the United States of America This report was prepared, approved, published and distributed by the Anand Rathi Share and Stock Brokers Limited (ARSSBL) located outside of the United States (a “non- US Group Company”). This report is distributed in the U.S. by Enclave Capital LLC, a U.S. registered broker dealer, on behalf of ARSSBL only to major U.S. institutional investors (as defined in Rule 15a-6 under the U.S. Securities Exchange Act of 1934 (the “Exchange Act”)) pursuant to the exemption in Rule 15a-6 and any transaction effected by a U.S. customer in the securities described in this report must be effected through Enclave Capital. ARSSBL accepts responsibility for its contents. Any US customer wishing to effect transactions in any securities referred to herein or options thereon should do so only by contacting a representative of Enclave Capital LLC at 646- 454-8600 Neither the report nor any analyst who prepared or approved the report is subject to U.S. legal requirements or the Financial Industry Regulatory Authority, Inc. (“FINRA”) or other regulatory requirements pertaining to research reports or research analysts. No non-US Group Company is registered as a broker-dealer under the Exchange Act or is a member of the Financial Industry Regulatory Authority, Inc. or any other U.S. self-regulatory organization. This material was produced by ARSSBL, solely for information purposes and for the use of the recipient. It is not to be reproduced under any circumstances and is not to be copied or made available to any person other than the recipient. It is distributed in the United States of America by Enclave Capital LLC (19 West 44th Street, Suite 1700, New York, NY 10036) and elsewhere in the world by ARSSBL or an authorized affiliate of ARSSBL (such entities and any other entity, directly or indirectly, controlled by ARSSBL, the “Affiliates”). This document does not constitute an offer of, or an invitation by or on behalf of ARSSBL or its Affiliates or any other company to any person, to buy or sell any security. The information contained herein has been obtained from published information and other sources, which ARSSBL or its Affiliates consider to be reliable. None of ARSSBL or its Affiliates accepts any liability or responsibility whatsoever for the accuracy or completeness of any such information. All estimates, expressions of opinion and other subjective judgments contained herein are made as of the date of this document. Emerging securities markets may be subject to risks significantly higher than more established markets. In particular, the political and economic environment, company practices and market prices and volumes may be subject to significant variations. The ability to assess such risks may also be limited due to significantly lower information quantity and quality. By accepting this document, you agree to be bound by all the foregoing provisions. 1. ARSSBL or its Affiliates may or may not have been beneficial owners of the securities mentioned in this report. 2. ARSSBL or its affiliates may have or not managed or co-managed a public offering of the securities mentioned in the report in the past 12 months. 3. ARSSBL or its affiliates may have or not received compensation for investment banking services from the issuer of these securities in the past 12 months and do not expect to receive compensation for investment banking services from the issuer of these securities within the next three months. 4. However, one or more of ARSSBL or its Affiliates may, from time to time, have a long or short position in any of the securities mentioned herein and may buy or sell those securities or options thereon, either on their own account or on behalf of their clients. 5. As of the publication of this report, ARSSBL does not make a market in the subject securities. 6. ARSSBL or its Affiliates may or may not, to the extent permitted by law, act upon or use the above material or the conclusions stated above, or the research or analysis on which they are based before the material is published to recipients and from time to time, provide investment banking, investment management or other services for or solicit to seek to obtain investment banking, or other securities business from, any entity referred to in this report. Enclave Capital LLC is distributing this document in the United States of America. ARSSBL accepts responsibility for its contents. Any US customer wishing to effect transactions in any securities referred to herein or options thereon should do so only by contacting a representative of Enclave Capital LLC. © 2016. This report is strictly confidential and is being furnished to you solely for your information. All material presented in this report, unless specifically indicated otherwise, is under copyright to ARSSBL. None of the material, its content, or any copy of such material or content, may be altered in any way, transmitted, copied or reproduced (in whole or in part) or redistributed in any form to any other party, without the prior express written permission of ARSSBL. All trademarks, service marks and logos used in this report are trademarks or service marks or registered trademarks or service marks of ARSSBL or its affiliates, unless specifically mentioned otherwise. Additional information on recommended securities/instruments is available on request. ARSSBL registered address: 4th Floor, Silver Metropolis, Jaicoach Compound, Opposite Bimbisar Nagar, Goregaon (East), Mumbai - 400 063. Tel No: +91 22 4001 3700 | Fax No: +91 22 4001 3770 | CIN: U67120MH1991PLC064106.