Chembond Chemicals: To keep its growth story; Maintain buy
•
1 like•314 views

The document provides a research report on Chembond Chemicals Ltd by CMP Securities. Some key points: - Chembond reported a 34.88% increase in net profit to Rs. 48.76 million for Q4 FY15 compared to the same period last year. - Revenue was up 0.47% to Rs. 741.44 million for Q4 FY15. Earnings per share increased 34.88% to Rs. 7.32. - The report recommends buying Chembond shares with a target price of Rs. 460, citing expected sales and profit growth over the next few years. Net sales and profit are estimated to grow at a CAGR of 9%

Recommended
Recommended
More Related Content
What's hot
What's hot (19)
Similar to Chembond Chemicals: To keep its growth story; Maintain buy
Similar to Chembond Chemicals: To keep its growth story; Maintain buy (20)
More from IndiaNotes.com
More from IndiaNotes.com (20)
Recently uploaded
Recently uploaded (20)
Chembond Chemicals: To keep its growth story; Maintain buy
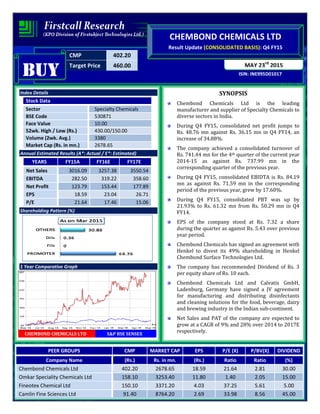
- 1. CMP 402.20 Target Price 460.00 ISIN: INE995D01017 MAY 23rd 2015 CHEMBOND CHEMICALS LTD Result Update (CONSOLIDATED BASIS): Q4 FY15 BUYBUYBUYBUY Index Details Stock Data Sector Specialty Chemicals BSE Code 530871 Face Value 10.00 52wk. High / Low (Rs.) 430.00/150.00 Volume (2wk. Avg.) 3380 Market Cap (Rs. in mn.) 2678.65 Annual Estimated Results (A*: Actual / E*: Estimated) YEARS FY15A FY16E FY17E Net Sales 3016.09 3257.38 3550.54 EBITDA 282.50 319.22 358.60 Net Profit 123.79 153.44 177.89 EPS 18.59 23.04 26.71 P/E 21.64 17.46 15.06 Shareholding Pattern (%) 1 Year Comparative Graph CHEMBOND CHEMICALS LTD S&P BSE SENSEX SYNOPSIS Chembond Chemicals Ltd is the leading manufacturer and supplier of Specialty Chemicals to diverse sectors in India. During Q4 FY15, consolidated net profit jumps to Rs. 48.76 mn against Rs. 36.15 mn in Q4 FY14, an increase of 34.88%. The company achieved a consolidated turnover of Rs. 741.44 mn for the 4th quarter of the current year 2014-15 as against Rs. 737.99 mn in the corresponding quarter of the previous year. During Q4 FY15, consolidated EBIDTA is Rs. 84.19 mn as against Rs. 71.59 mn in the corresponding period of the previous year, grew by 17.60%. During Q4 FY15, consolidated PBT was up by 21.93% to Rs. 61.32 mn from Rs. 50.29 mn in Q4 FY14. EPS of the company stood at Rs. 7.32 a share during the quarter as against Rs. 5.43 over previous year period. Chembond Chemicals has signed an agreement with Henkel to divest its 49% shareholding in Henkel Chembond Surface Technologies Ltd. The company has recommended Dividend of Rs. 3 per equity share of Rs. 10 each. Chembond Chemicals Ltd and Calvatis GmbH, Ladenburg, Germany have signed a JV agreement for manufacturing and distributing disinfectants and cleaning solutions for the food, beverage, dairy and brewing industry in the Indian sub-continent. Net Sales and PAT of the company are expected to grow at a CAGR of 9% and 28% over 2014 to 2017E respectively. PEER GROUPS CMP MARKET CAP EPS P/E (X) P/BV(X) DIVIDEND Company Name (Rs.) Rs. in mn. (Rs.) Ratio Ratio (%) Chembond Chemicals Ltd 402.20 2678.65 18.59 21.64 2.81 30.00 Omkar Speciality Chemicals Ltd 158.10 3253.40 11.80 1.40 2.05 15.00 Fineotex Chemical Ltd 150.10 3371.20 4.03 37.25 5.61 5.00 Camlin Fine Sciences Ltd 91.40 8764.20 2.69 33.98 8.56 45.00
- 2. QUARTERLY HIGHLIGHTS (CONSOLIDATED) Results updates- Q4 FY15, Months Mar-15 Mar-14 % Change Net Sales 741.44 737.99 0.47 Net Profit 48.76 36.15 34.88 EPS 7.32 5.43 34.88 EBITDA 84.19 71.59 17.60 The consolidated net profit jumps to Rs. 48.76 million against Rs. 36.15 million in the corresponding quarter ending of previous year, an increase of 34.88%. The company achieved a turnover of Rs. 741.44 million registering an increase of 0.47% for the 4th quarter of the current year 2014-15 as against Rs. 737.99 millions in the corresponding quarter of the previous year. Reported earnings per share of the company stood at Rs. 7.32 a share during the quarter as against Rs. 5.43 over previous year period. Profit before interest, depreciation and tax is Rs. 84.19 million as against Rs. 71.59 million in the corresponding period of the previous year. Break up of Expenditure Particulars (Rs. mn) Q4 FY15 Q4 FY14 % Change Cost of material Consumed 405.47 427.34 -5% Employee Benefit Expenses 81.90 75.78 8% Depreciation & Amortization Expense 13.69 8.08 69% Other Expenses 158.40 148.72 7%
- 3. Latest Updates • Chembond Chemicals Ltd has signed an agreement with Henkel to divest its 49% shareholding in Henkel Chembond Surface Technologies Ltd. • Chembond Chemicals Ltd has recommended Dividend of Rs. 3 per equity share of Rs. 10 each. • Chembond Chemicals Ltd, Mumbai, India and Calvatis GmbH, Ladenburg, Germany have signed a joint venture agreement for manufacturing and distributing disinfectants and cleaning solutions for the food, beverage, dairy and brewing industry in the Indian sub-continent. COMPANY PROFILE Chembond Chemicals Ltd is the leading manufacturer and supplier of Specialty Chemicals to diverse sectors of industry such as automobile, steel mills, fertilizers, refineries and petrochemicals, power plants and infrastructure projects such as metro systems, bridges and expressways. Chembond has identified Water as the major area of thrust and has taken steps with the formation of JV - H2O Innovation India Ltd to offer 'State of Art Technology' that provides complete solution to water problems - from RW treatment to waste water recycling. Chembond has prided itself on being the "First Choice" for many 'quality conscious' customers throughout India. With technical service being an important component of its proposition, all their products are backed up by technical service provided by a well trained and experienced team of technical personnel. The Company has four subsidiaries namely Chembond Ashland Water Technologies Limited, Protochem Industries Private Limited, Chembond Inver Coatings Limited and Chembond Clean Water Technologies Limiteed (formerly H2O Innovation India Limited).
- 4. FINANCIAL HIGHLIGHT (CONSOLIDATED BASIS) (A*- Actual, E* -Estimations & Rs. In Millions) Balance Sheet as at March 31, 2014 -2017E FY14A FY15A FY16E FY17E EQUITY AND LIABILITIES: Shareholders’ Funds: Share Capital 66.60 66.60 66.60 66.60 Reserves and Surplus 796.14 885.86 1018.74 1161.36 Minority Interest 126.05 125.44 130.46 136.98 A) Net worth 988.79 1077.90 1215.80 1364.94 B) ESOP Application money pending allotment 0.00 2.41 0.00 0.00 Non-Current Liabilities: Long-term borrowings 96.93 19.97 16.77 14.76 Deferred Tax Liabilities [Net] 32.65 26.24 27.55 28.65 Long Term Provisions 9.86 19.06 22.11 24.54 C) Sub Total - Non-Current Liabilities 139.44 65.27 66.44 67.96 Current Liabilities: Short-term borrowings 210.46 196.72 184.92 170.12 Trade Payables 531.98 485.96 505.40 530.67 Other Current Liabilities 132.83 159.19 181.48 199.62 Short Term Provisions 48.24 41.16 43.22 44.95 D) Sub Total - Current Liabilities 923.51 883.03 915.01 945.36 Total Liabilities (A+B+C+D) 2051.74 2028.61 2197.24 2378.26 ASSETS: Non-Current Assets: Fixed Assets Tangible Assets 461.09 441.79 477.13 515.30 Intangible Assets 75.05 72.91 80.20 86.62 Capital work-in-progress 31.16 33.90 36.27 38.09 a) Sub Total - Fixed Assets 567.30 548.60 593.61 640.01 b) Non Current Investments 5.65 7.72 8.41 8.92 c) Long Term Loans and Advances 36.27 60.45 70.12 78.54 E) Sub Total - Non-Current Assets 609.22 616.77 672.14 727.46 Current Assets: Current Investments 0.06 0.06 0.20 0.22 Inventories 347.67 305.00 326.35 349.00 Trade Receivables 868.06 860.48 912.11 975.96 Cash and Bank Balances 126.30 160.79 191.52 222.16 Short-terms loans & advances 100.43 85.51 94.92 103.46 F) Sub Total - Current Assets 1442.52 1411.84 1525.09 1650.80 Total Assets (E+F) 2051.74 2028.61 2197.24 2378.26
- 5. Annual Profit & Loss Statement for the period of 2014 to 2017E Value(Rs. mn) FY14A FY15A FY16E FY17E Description 12m 12m 12m 12m Net Sales 2756.67 3016.09 3257.38 3550.54 Other Income 0.00 0.00 0.00 0.00 Total Income 2756.67 3016.09 3257.38 3550.54 Expenditure -2536.72 -2733.59 -2938.15 -3191.94 Operating Profit 219.95 282.50 319.22 358.60 Interest -40.29 -36.11 -33.22 -31.23 Gross profit 179.66 246.39 286.00 327.38 Depreciation -28.14 -43.23 -51.01 -58.15 Profit Before Tax 151.52 203.16 234.99 269.22 Tax -59.84 -56.76 -65.33 -76.73 Profit After Tax 91.68 146.40 169.66 192.49 Minority Interest -14.71 -20.54 -16.23 -14.60 Share of Profit & Loss of Asso 0.62 -2.07 0.00 0.00 Net Profit 77.59 123.79 153.44 177.89 Equity capital 66.60 66.60 66.60 66.60 Reserves 790.74 885.86 1018.74 1161.36 Face value 10.00 10.00 10.00 10.00 EPS 11.65 18.59 23.04 26.71 Quarterly Profit & Loss Statement for the period of 30th Sep, 2014 to 30th June, 2015E Value(Rs. mn) 30-Sep-14 31-Dec-14 31-Mar-15 30-Jun-15E Description 3m 3m 3m 3m Net sales 776.56 775.01 741.44 726.61 Other income 0.00 0.00 0.00 0.00 Total Income 776.56 775.01 741.44 726.61 Expenditure -704.72 -698.57 -657.25 -652.50 Operating profit 71.84 76.44 84.19 74.11 Interest -9.26 -8.67 -9.18 -8.45 Gross profit 62.58 67.77 75.01 65.67 Depreciation -9.65 -10.77 -13.69 -14.92 Profit Before Tax 52.93 57.00 61.32 50.75 Tax -18.34 -19.22 -8.43 -14.72 Profit After Tax 34.59 37.78 52.89 36.03 Minority Interest -7.12 -7.16 -2.06 -1.75 Share of Profit & Loss of Asso 0.00 0.00 -2.07 0.00 Net Profit 27.47 30.62 48.76 34.28 Equity capital 66.60 66.60 66.60 66.60 Face value 10.00 10.00 10.00 10.00 EPS 4.12 4.60 7.32 5.15
- 6. Ratio Analysis Particulars FY14A FY15A FY16E FY17E EPS (Rs.) 11.65 18.59 23.04 26.71 EBITDA Margin (%) 7.98% 9.37% 9.80% 10.10% PBT Margin (%) 5.50% 6.74% 7.21% 7.58% PAT Margin (%) 3.33% 4.85% 5.21% 5.42% P/E Ratio (x) 34.52 21.64 17.46 15.06 ROE (%) 10.69% 15.37% 15.63% 15.68% ROCE (%) 21.30% 27.86% 28.77% 29.50% Debt Equity Ratio 0.36 0.23 0.19 0.15 EV/EBITDA (x) 13.00 9.68 8.42 7.37 Book Value (Rs.) 128.73 143.01 162.96 184.38 P/BV 3.12 2.81 2.47 2.18 Charts
- 7. OUTLOOK AND CONCLUSION At the current market price of Rs. 402.20, the stock P/E ratio is at 17.46 x FY16E and 15.06 x FY17E respectively. Earning per share (EPS) of the company for the earnings for FY16E and FY17E is seen at Rs.23.04 and Rs.26.71 respectively. Net Sales and PAT of the company are expected to grow at a CAGR of 9% and 28% over 2014 to 2017E respectively. On the basis of EV/EBITDA, the stock trades at 8.42 x for FY16E and 7.37 x for FY17E. Price to Book Value of the stock is expected to be at 2.47 x and 2.18 x for FY16E and FY17E respectively. We expect that the company surplus scenario is likely to continue for the next three years, will keep its growth story in the coming quarters also. Hence, we recommend ‘BUY’ in this particular scrip with a target price of Rs.460.00 for Medium to Long term investment.
- 8. INDUSTRY OVERVIEW The Indian chemical industry stands as the third largest producer in Asia and 12th in world, in terms of volume. This industry could grow at 14 per cent per annum to reach a size of US$ 350 billion by 2021. India accounts for approximately 7 per cent of the world production of dyestuff and dye intermediates and is currently the world's third largest consumer of polymers and fourth largest producer of agrochemicals. The market size of the chemical industry is expected to grow to US$ 350 billion by 2021. With 72 per cent of the total production share, alkali chemicals form the largest segment in the Indian chemical industry. Total exports of chemicals grew at a compound annual growth rate (CAGR) of 16.2 per cent to reach US$ 15.5 billion in FY13. The Government of India has announced a number of measures to improve competitiveness in this sector, which includes abolishing of industrial licensing for most sub-sectors and granting 100 per cent approval to FDI. The chemical industry has scope for growth in the specialty chemicals market which has expanded at a CAGR of about 12 per cent over FY07-11. The figure is expected to rise to 13 per cent over the next five years to reach US$ 45 billion by FY17. By 2017, the construction chemicals sector is also set to touch US$ 1,040 million. The polymer chemicals sector is anticipated to grow at a higher rate due to growth in plastic demand resulting from increased usage in packaging, construction and automotive sectors. Disclaimer: This document is prepared by our research analysts and it does not constitute an offer or solicitation for the purchase or sale of any financial instrument or as an official confirmation of any transaction. The information contained herein is from publicly available data or other sources believed to be reliable but we do not represent that it is accurate or complete and it should not be relied on as such. Firstcall Research or any of its affiliates shall not be in any way responsible for any loss or damage that may arise to any person from any inadvertent error in the information contained in this report. Firstcall Research and/ or its affiliates and/or employees will not be liable for the recipients’ investment decision based on this document.
- 9. Firstcall India Equity Research: Email – info@firstobjectindia.com C.V.S.L.Kameswari Pharma & Diversified U. Janaki Rao Capital Goods B. Anil Kumar Auto, IT & FMCG M. Vinayak Rao Diversified G. Amarender Diversified Firstcall Research Provides Industry Research on all the Sectors and Equity Research on Major Companies forming part of Listed and Unlisted Segments For Further Details Contact: Tel.: 022-2527 2510/2527 6077 / 25276089 Telefax: 022-25276089 040-20000235 /20000233 E-mail: info@firstobjectindia.com www.firstcallresearch.com