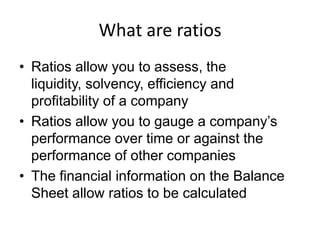
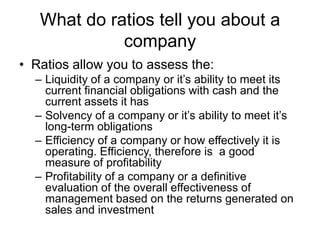
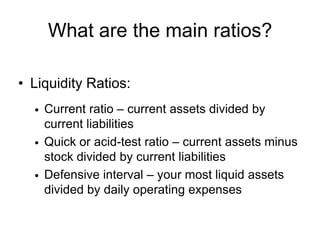
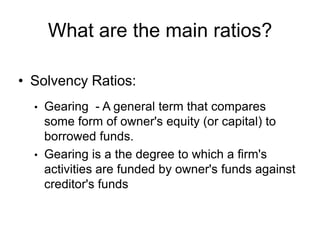
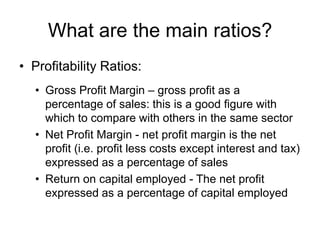
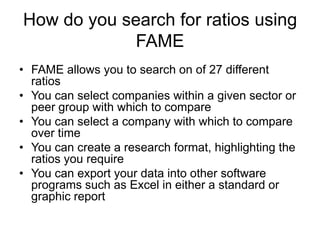
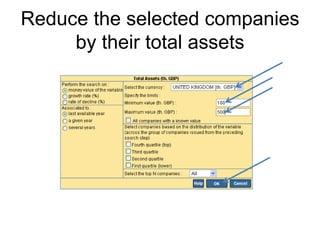
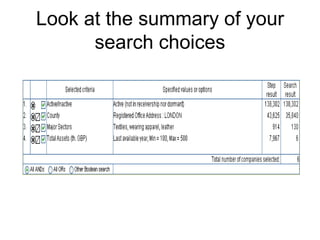
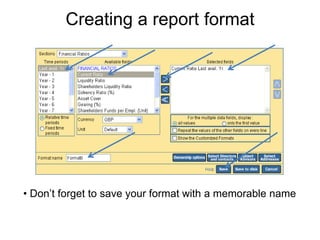
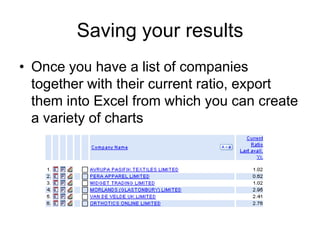
Searching for Ratios using FAME
What are ratiosRatios allow you to assess, the liquidity, solvency, efficiency and profitability of a company Ratios allow you to gauge a company’s performance over time or against the performance of other companiesThe financial information on the Balance Sheet allow ratios to be calculated
What do ratios tell you about a companyRatios allow you to assess the:Liquidity of a company or it’s ability to meet its current financial obligations with cash and the current assets it hasSolvency of a company or it’s ability to meet it’s long-term obligations Efficiency of a company or how effectively it is operating. Efficiency, therefore is  a good measure of profitabilityProfitability of a company or a definitive evaluation of the overall effectiveness of management based on the returns generated on sales and investment
What are the main ratios?Liquidity Ratios:Current ratio – current assets divided by current liabilities
Quick or acid-test ratio – current assets minus stock divided by current liabilities
Defensive interval – your most liquid assets divided by daily operating expensesWhat are the main ratios?Solvency Ratios:Gearing  - A general term that compares some form of owner's equity (or capital) to borrowed funds.
Gearing is a the degree to which a firm's activities are funded by owner's funds against creditor's fundsWhat are the main ratios?Efficiency RatiosDebtors’ turnover – average credit sales divided by debtors over 365 days or how quickly you are collecting the debts that are due to you within a year
Creditors’ turnovers – average purchases divided by average credit purchases or how long you take to pay suppliers for items bought on credit
Stock turnover – average stock, i.e. opening stock + closing stock divided by 2 and thendivided by cost of sales or how long you hold stock before sellingWhat are the main ratios?Profitability Ratios:Gross Profit Margin – gross profit as a percentage of sales: this is a good figure with which to compare with others in the same sector
Net Profit Margin - net profit margin is the net profit (i.e. profit less costs except interest and tax) expressed as a percentage of sales
Return on capital employed - The net profit expressed as a percentage of capital employedHow do you search for ratios using FAMEFAME allows you to search on of 27 different ratiosYou can select companies within a given sector or peer group with which to compareYou can select a company with which to compare over timeYou can create a research format, highlighting the ratios you requireYou can export your data into other software programs such as Excel in either a standard or graphic report
Open your browser and type in the Learning Resources web address into the location bar ……..  www.lr.mdx.ac.ukSelect Electronic Resources
Make sure that you have set your institutional cookieScroll down to the bottom of the Electronic  Resources page and click on to the linkOnce you’ve clicked on to the link, a pop-up window will appear and then close automatically – you only need to do this once
Log into AthensAthens is an authenticating system which allows students to access Middlesex University databases outside of the universityClick on to the Athens linkLog in using your IT user ID and your network password and once you have accepted the terms and conditions, you will be presented with a list of databases
Searching FAMEScroll down and choose FAME from the list of databases
About FAMEFAME is a database that contains information about companies in the UK and IrelandThey provide extensive support from their user guide
Extracting ratios from FAMEImagine that you are interested in comparing the ratios of companies in the clothing industry in LondonMaking sure that you are in Expert Search, click on Activity/IndustrySelect Major Sectors and then Textiles…..
Comparing ratios across companiesRefine your results by geography Click on Geographical Location, County and then choose LondonReducing your results for analysisReduce your results in order to perform a ratio analysis – FAME will, however, pick out 10 standard companies from your search resultsChoose companies with total assets of between 100 and 500 thousandSelect Financials – key financial – total assets from the left hand panel The default is thousands of pounds – put in a minimum of 100 and a maximum of 500
Reduce the selected companies by their total assets
Look at the summary of your search choices
Comparing ratios across companiesImagine that you want to perform a current ratio analysis of a selection of companies for the last available yearClick on List from the left hand selection of tabsIgnore the preset list of formats and select newChoose ratios from the Sections pull down list
Creating a report format Don’t forget to save your format with a memorable nameSaving your resultsOnce you have a list of companies together with their current ratio, export them into Excel from which you can create a variety of charts
Exporting your Report into ExcelSelect ExportChoose a file name and then export
Exporting…..A pop-up window will appear
Opening the reportDouble click on the link to open the report in Excel
A graphic representation of ratiosWithin Excel, there are options to represent your ratio information graphicallySelect InsertHighlight the rows and columns that you want to include and choose a chart

Using FAME to look at ratios

  • 1.
  • 2.
    What are ratiosRatiosallow you to assess, the liquidity, solvency, efficiency and profitability of a company Ratios allow you to gauge a company’s performance over time or against the performance of other companiesThe financial information on the Balance Sheet allow ratios to be calculated
  • 3.
    What do ratiostell you about a companyRatios allow you to assess the:Liquidity of a company or it’s ability to meet its current financial obligations with cash and the current assets it hasSolvency of a company or it’s ability to meet it’s long-term obligations Efficiency of a company or how effectively it is operating. Efficiency, therefore is a good measure of profitabilityProfitability of a company or a definitive evaluation of the overall effectiveness of management based on the returns generated on sales and investment
  • 4.
    What are themain ratios?Liquidity Ratios:Current ratio – current assets divided by current liabilities
  • 5.
    Quick or acid-testratio – current assets minus stock divided by current liabilities
  • 6.
    Defensive interval –your most liquid assets divided by daily operating expensesWhat are the main ratios?Solvency Ratios:Gearing - A general term that compares some form of owner's equity (or capital) to borrowed funds.
  • 7.
    Gearing is athe degree to which a firm's activities are funded by owner's funds against creditor's fundsWhat are the main ratios?Efficiency RatiosDebtors’ turnover – average credit sales divided by debtors over 365 days or how quickly you are collecting the debts that are due to you within a year
  • 8.
    Creditors’ turnovers –average purchases divided by average credit purchases or how long you take to pay suppliers for items bought on credit
  • 9.
    Stock turnover –average stock, i.e. opening stock + closing stock divided by 2 and thendivided by cost of sales or how long you hold stock before sellingWhat are the main ratios?Profitability Ratios:Gross Profit Margin – gross profit as a percentage of sales: this is a good figure with which to compare with others in the same sector
  • 10.
    Net Profit Margin- net profit margin is the net profit (i.e. profit less costs except interest and tax) expressed as a percentage of sales
  • 11.
    Return on capitalemployed - The net profit expressed as a percentage of capital employedHow do you search for ratios using FAMEFAME allows you to search on of 27 different ratiosYou can select companies within a given sector or peer group with which to compareYou can select a company with which to compare over timeYou can create a research format, highlighting the ratios you requireYou can export your data into other software programs such as Excel in either a standard or graphic report
  • 12.
    Open your browserand type in the Learning Resources web address into the location bar …….. www.lr.mdx.ac.ukSelect Electronic Resources
  • 13.
    Make sure thatyou have set your institutional cookieScroll down to the bottom of the Electronic Resources page and click on to the linkOnce you’ve clicked on to the link, a pop-up window will appear and then close automatically – you only need to do this once
  • 14.
    Log into AthensAthensis an authenticating system which allows students to access Middlesex University databases outside of the universityClick on to the Athens linkLog in using your IT user ID and your network password and once you have accepted the terms and conditions, you will be presented with a list of databases
  • 15.
    Searching FAMEScroll downand choose FAME from the list of databases
  • 16.
    About FAMEFAME isa database that contains information about companies in the UK and IrelandThey provide extensive support from their user guide
  • 17.
    Extracting ratios fromFAMEImagine that you are interested in comparing the ratios of companies in the clothing industry in LondonMaking sure that you are in Expert Search, click on Activity/IndustrySelect Major Sectors and then Textiles…..
  • 18.
    Comparing ratios acrosscompaniesRefine your results by geography Click on Geographical Location, County and then choose LondonReducing your results for analysisReduce your results in order to perform a ratio analysis – FAME will, however, pick out 10 standard companies from your search resultsChoose companies with total assets of between 100 and 500 thousandSelect Financials – key financial – total assets from the left hand panel The default is thousands of pounds – put in a minimum of 100 and a maximum of 500
  • 19.
    Reduce the selectedcompanies by their total assets
  • 20.
    Look at thesummary of your search choices
  • 21.
    Comparing ratios acrosscompaniesImagine that you want to perform a current ratio analysis of a selection of companies for the last available yearClick on List from the left hand selection of tabsIgnore the preset list of formats and select newChoose ratios from the Sections pull down list
  • 22.
    Creating a reportformat Don’t forget to save your format with a memorable nameSaving your resultsOnce you have a list of companies together with their current ratio, export them into Excel from which you can create a variety of charts
  • 23.
    Exporting your Reportinto ExcelSelect ExportChoose a file name and then export
  • 24.
  • 25.
    Opening the reportDoubleclick on the link to open the report in Excel
  • 26.
    A graphic representationof ratiosWithin Excel, there are options to represent your ratio information graphicallySelect InsertHighlight the rows and columns that you want to include and choose a chart