Downloaded 360 times


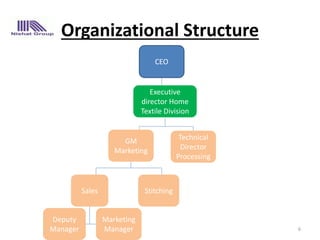


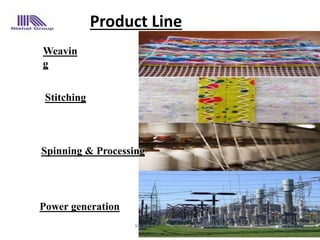
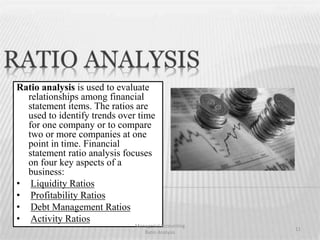
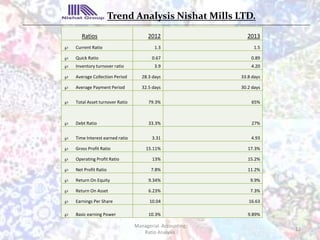
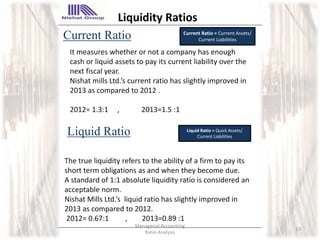
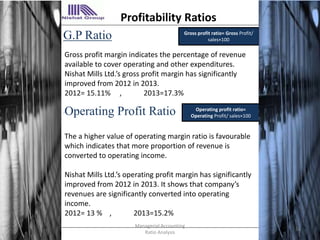
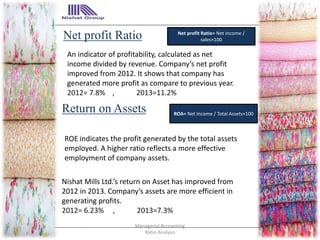

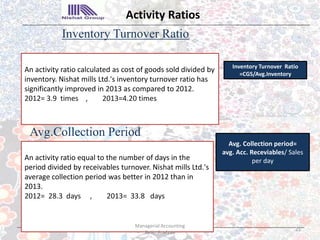
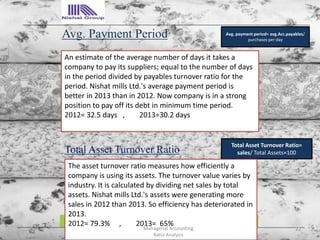


This document provides a presentation on ratio analysis of Nishat Mills Limited, a textile company in Pakistan. It includes an introduction to the company, its mission statement, organizational structure, and product lines. The presentation then covers various financial ratios analyzed for Nishat Mills for 2012-2013, including liquidity, profitability, debt management, and activity ratios. Key findings are that liquidity, profitability, and debt management ratios improved from 2012 to 2013, while some activity ratios declined. The presentation concludes with recommendations for Nishat Mills to improve average collection period, asset turnover ratio, and basic earning power.


