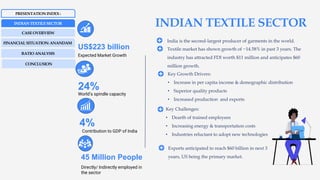
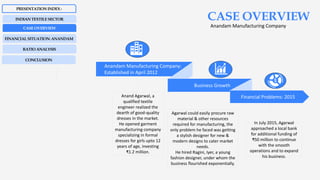
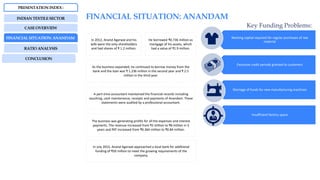
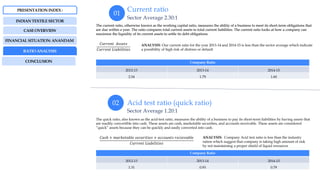
The document provides an overview of the Indian textile sector and a case study on Anandam Manufacturing Company. It discusses key details about the Indian textile market size, growth drivers, challenges. It then presents the case of Anandam, a garment manufacturer established in 2012. By 2015, the company was facing financial problems due to working capital requirements and sought additional bank funding of Rs. 50 million. Ratio analyses are presented comparing Anandam's ratios to industry averages for current ratio, debt-to-equity, inventory turnover, and others, showing some areas where the company lags industry standards.
A financial ratio (or accounting ratio) is a relative magnitude of two selected numerical values taken from an enterprise's financial statements. Often used in accounting, there are many standard ratios used to try to evaluate the overall financial condition of a corporation or other organization. Financial ratios may be used by managers within a firm, by current and potential shareholders (owners) of a firm, and by a firm's creditors. Financial analysts use financial ratios to compare the strengths and weaknesses in various companies.[1] If shares in a company are traded in a financial market, the market price of the shares is used in certain financial ratios.
Ratios can be expressed as a decimal value, such as 0.10, or given as an equivalent percent value, such as 10%. Some ratios are usually quoted as percentages, especially ratios that are usually or always less than 1, such as earnings yield, while others are usually quoted as decimal numbers, especially ratios that are usually more than 1, such as P/E ratio; these latter are also called multiples. Given any ratio, one can take its reciprocal; if the ratio was above 1, the reciprocal will be below 1, and conversely. The reciprocal expresses the same information, but may be more understandable: for instance, the earnings yield can be compared with bond yields, while the P/E ratio cannot be: for example, a P/E ratio of 20 corresponds to an earnings yield of 5%.
Values used in calculating financial ratios are taken from the balance sheet, income statement, statement of cash flows or (sometimes) the statement of retained earnings. These comprise the firm's "accounting statements" or financial statements. The statements' data is based on the accounting method and accounting standards used by the organization.
Ratios
Profitability ratios
Liquidity ratios
Activity ratios (Efficiency Ratios)
Debt ratios (leveraging ratios)
Market ratios
Capital budgeting ratios
Financial ratios quantify many aspects of a business and are an integral part of the financial statement analysis. Financial ratios are categorized according to the financial aspect of the business which the ratio measures. Liquidity ratios measure the availability of cash to pay debt.[2] Activity ratios measure how quickly a firm converts non-cash assets to cash assets.[3] Debt ratios measure the firm's ability to repay long-term debt.[4] Profitability ratios measure the firm's use of its assets and control of its expenses to generate an acceptable rate of return.[5] Market ratios measure investor response to owning a company's stock and also the cost of issuing stock.[6] These are concerned with the return on investment for shareholders, and with the relationship between return and the value of an investment in company’s shares.
Financial ratios allow for comparisons
between companies
between industries
between different time periods for one company
between a single company and its industry average
Dabur India Ltd. is an Indian FMCG company that plans to increase sales aggressively over the next two years. This will require investing Rs. 500 crores in capital expenditures and increase working capital needs by Rs. 941.43 crores. The company proposes to fund the capital expenditures through the sale of non-current investments. It plans to fund the working capital requirements through internal accruals of Rs. 619.61 crores and a short-term bank loan of Rs. 321.82 crores secured against inventory and receivables. The company's creditworthiness is strong with high liquidity, profitability, and solvency ratios supporting its loan application.
This document analyzes the past, present, and future financial conditions of Nadeem Textile Mills Limited using ratio analysis. It calculates key financial ratios for the company and compares them to industry norms to identify strengths and weaknesses. The analysis finds that the company has weaker liquidity, higher debt, lower profitability, and longer operating cycles compared to industry standards. Specifically, it has negative working capital and net profit. This suggests the company is suffering losses and not efficiently converting sales into profits. In conclusion, the company is in a worse financial position than its industry peers based on this ratios analysis.
This document provides an overview and analysis of the working capital management of A2IT Soft Pvt. Ltd from 2014-2016. The company has negative working capital over this period due to higher current liabilities than current assets. Inventory levels increased each year but the current ratio is below standard, indicating potential liquidity issues. To improve its financial position, the company should focus on increasing profits, collecting receivables faster, and reducing current liabilities.
- Marico is an Indian consumer goods company founded in 1991 and headquartered in Mumbai. It produces edible oils, hair oils, and personal care products.
- The company's revenue grew from Rs. 5733.3 crore in 2012 to 2015. During this period, its operating margin, gross profit margin, and return on equity also increased, while return on assets and asset turnover ratio declined slightly.
- The company aims to maintain sufficient liquidity as seen from its current ratio hovering around 1 and gradual increase in quick ratio from 0.32 to 0.55 from 2012 to 2015.
Dabur India Ltd. is one of India's leading consumer goods companies with a long and rich history. Here is a description of Dabur India:
**Overview:**
- **Founding Year:** Dabur was founded in 1884 by Dr. S. K. Burman in Calcutta, India. It started as an Ayurvedic medicines company and has since evolved into a diversified consumer goods conglomerate.
**Business Segments:**
Dabur operates across various business segments, including:
1. **Healthcare**: This is where Dabur began its journey, and it's known for its Ayurvedic and natural health products, including Chyawanprash, Honey, and a wide range of herbal medicines and supplements.
2. **Personal Care**: Dabur has a vast portfolio of personal care products, including hair care (Vatika, Dabur Amla), oral care (Dabur Red Toothpaste), skincare (Fem, Gulabari), and more.
3. **Food**: Dabur offers a range of food products, including fruit juices (Real), digestive aids (Pudin Hara), and a variety of other food items.
4. **Home Care**: Dabur has ventured into the home care segment with products such as Odonil air fresheners and sanitization products.
5. **International Business**: Dabur has a significant global presence and exports its products to over 120 countries. Its international portfolio includes a variety of products tailored to different markets.
**Ayurvedic and Natural Focus:**
Dabur's core strength lies in its use of Ayurvedic and natural ingredients in many of its products. It's known for its commitment to traditional Indian medicine, and many of its products are based on Ayurvedic formulations.
**Innovation:**
The company continually invests in research and development to create innovative products, often combining the wisdom of Ayurveda with modern science and technology.
**Sustainability:**
Dabur has also made efforts in sustainability and responsible business practices, focusing on environmental and social initiatives. It has undertaken several initiatives to reduce its carbon footprint and promote sustainable sourcing.
**Community Involvement:**
Dabur is involved in various community development and CSR (Corporate Social Responsibility) initiatives. They have programs aimed at promoting education, healthcare, and overall community development.
**Financial Performance:**
Dabur India has been a consistently profitable company and is listed on the National Stock Exchange (NSE) and the Bombay Stock Exchange (BSE) in India.
Dabur India has a significant presence in the Indian and international markets and is known for its commitment to Ayurveda and natural products. It has a strong brand reputation and a diverse product portfolio that caters to the health and wellness needs of consumers.
This document analyzes financial ratios for Reliance Infrastructure Limited over three fiscal years. It calculates and interprets ratios related to liquidity, leverage, activity and profitability. Key findings include a declining current ratio, increasing operating expenses, fluctuating proprietary ratio, and adequate interest coverage. Overall, the analysis concludes Reliance Infrastructure's financial condition is good, though it could diversify funds across sectors for stability in changing markets.
This document discusses various techniques of financial analysis used to analyze financial statements, including ratio analysis. It provides background on ratio analysis and defines key financial ratios such as current ratio, quick ratio, debt equity ratio, proprietary ratio, net profit ratio, and capital turnover ratio. Ratio analysis of Punjab National Bank from 2011-2015 is then presented, calculating and interpreting various ratios to analyze the bank's financial performance and position over those years. The ratios indicate the bank has maintained strong liquidity and an increasing equity position over time.
The document analyzes various financial ratios of BEXIMCO Pharmaceuticals Ltd. based on their annual reports from 2012-2013. Some key ratios that declined from 2012 to 2013 included current ratio, quick ratio, cash ratio, cash flow from operations ratio, gross margin, operating margin, pre-tax margin, and profit margin. However, inventory turnover, receivables turnover, payables turnover, and some measures of return on equity increased from 2012 to 2013. Overall, the ratio analysis found that the company's liquidity, profitability, and efficiency declined slightly from 2012 to 2013, though some measures of long-term performance improved.
Ratio Analysis of Apex Adelchi Footwear LtdMoin Sarker
The document discusses key financial statements and the information they provide to stakeholders. It explains that the balance sheet provides information on a company's financial condition by showing assets, liabilities, and equity. The income statement reports operating results like revenues, expenses, and profits. The cash flow statement shows cash inflows and outflows from operating, investing, and financing activities. Ratio analysis is also discussed as a tool used to evaluate financial performance and position by comparing different financial metrics over time. The document provides examples of liquidity, asset management, and debt ratios calculated for a company to analyze its financial management.
This document discusses financial statement analysis and its importance. It covers key topics like the difference between an annual report and financial statements, tools for financial statement analysis including ratio analysis, horizontal analysis, and vertical analysis. Ratio analysis can evaluate a company's liquidity, asset management, debt management, profitability, and market value. The document also includes an example of fundamental analysis using financial ratios to evaluate a company. In summary, financial statement analysis is used to assess a company's financial health, make investment decisions, and plan for the future.
1. The document analyzes an investment in Dabur India Pvt. Ltd for three investors with different investment horizons of 1 year, 3 years, and 7 years.
2. Technical analysis and relative valuation are recommended for the 1 year investment, DCF and relative valuation for 3 years, and DCF for 7 years.
3. A fundamental analysis of Dabur finds the company has good profitability, liquidity, and cash flow ratios compared to industry averages. The analysis recommends Dabur as an investment.
- The document analyzes various financial ratios for Virat Industries Ltd, an Indian company that produces cotton socks.
- It calculates liquidity ratios like current ratio and acid-test ratio to assess the company's ability to meet short-term obligations. It also calculates leverage ratios like debt-equity ratio to examine the firm's capital structure.
- The document concludes that the company's current ratio and cash ratio indicate a marginally satisfactory liquidity position. It also finds that the debt-equity ratio has been continuously decreasing, showing efforts to reduce debt levels.
This document evaluates the financial performance of Jamuna Oil Company Limited (JOCL) through ratio analysis and trend analysis. It analyzes JOCL's liquidity, leverage, efficiency, profitability, and market prospect ratios from 2015-2013. It finds that JOCL's current and quick ratios, profit margins, and returns on assets and equity need improvement. Recommendations include increasing commissions from the government, improving working capital management, utilizing assets more efficiently, and maintaining accounting through one software system.
Financial Report and Ratio Analysis of Square Pharmaceuticals LimitedMD TOWFIQUR RAHMAN
This document analyzes the financial performance of Square Pharmaceuticals Ltd. for 2014-2015 using financial ratios. It provides Square's background and financial statements for the two years. The document then calculates and analyzes key ratios to evaluate Square's liquidity, activity, leverage, profitability, and growth. Specifically, it finds that in 2015 Square had a current ratio of 3.82 times, quick ratio of 2.52 times, inventory turnover of 4.51 times, and fixed asset turnover of 0.78 times. The analysis of ratios provides insight into Square's financial condition and efficiency over time.
PIA is Pakistan's national airline carrier. It was established in 1955 and operates flights out of major airports in Karachi, Lahore, and Islamabad. PIA's vision is to be a world-class airline that exceeds customer expectations through safety, innovation, and quality service. The document analyzes PIA's financial statements from 2011-2012 using various ratios to evaluate its short-term liquidity, long-term credit risk, profitability, and market performance. The analysis finds that PIA has weak liquidity and profitability, high debt, and losses over this period. While some ratios improved slightly from 2011-2012, PIA's financial position remains troubled.
This financial analysis report summarizes Gree Electric Appliances' financial performance from 2009-2013. It analyzes Gree's short-term liquidity, financial leverage, operational capacity, profitability, and development capacity compared to its peers. While Gree maintains high debt ratios, its strong relationships with suppliers and non-interest bearing debts allow it to effectively control financial risk. The report also uses DuPont analysis to evaluate Gree's profitability, asset utilization, and financial structure.
Reliance Industries Ltd is an Indian conglomerate company with diversified business activities. It has a presence in refining and petrochemicals, oil and gas exploration and production, retail, digital services, and media and entertainment. A financial analysis of Reliance reveals an increase in net cash from operating activities from 2019 to 2020 despite a decrease in net profit. The company's debt-equity ratio of 0.63 indicates good financial stability. Reliance has grown significantly over the years to become the largest company in India.
Britannia analysis of financial performanceImran Khan
This presentation is about the Study of Financial Performance of Britannia Industries Limited. For the study I have taken the data from 2011/12 to 2015/16. I have used different types of ratios to evaluate and analyze the financial performance like Liquidity ratio, Profitability ratio, Leverage, Activity ratios. Also, I have used valuation ratios in order to determine whether the stock of this industry was worthwhile to purchase or not as per the share price quoted on National Stock Exchange (NSE).
This document contains a summary of a group project on ratio analysis conducted by 5 students from the University of Haripur, Pakistan. It defines various types of ratios including liquidity, leverage, coverage, activity, and profitability ratios. It provides examples of specific ratios like current ratio, quick ratio, debt ratio, times interest earned ratio, inventory turnover ratio, and return on assets. The document also discusses the importance and limitations of ratio analysis for financial decision making.
Reliance Industries Limited (RIL) is one of the largest companies in India. A financial analysis of RIL found strengths such as high inventory and debtor turnover ratios, and a high debt service ratio. Weaknesses included low liquidity and current ratios. Opportunities include raising funds through debt. Threats include underutilized capital from a low capital gearing ratio.
This document discusses various financial ratios used to evaluate a company's financial performance. It provides details of liquidity, leverage, asset management and profitability ratios calculated for ICL for 2016-2017. The document analyzes ICL's current ratio, quick ratio, debt-to-equity ratio, interest coverage ratio and other key financial ratios, comparing them to industry standards. It finds that most of ICL's ratios are weaker than standards, indicating risks to creditors and need for ICL to improve earnings.
- ITC Limited is a large Indian conglomerate company headquartered in Kolkata, employing over 26,000 people across various businesses.
- Between 1995-96 and 2012-13, ITC saw rapid growth and scale-up of its FMCG businesses, with net revenue increasing from Rs. 2,536 crores to Rs. 29,606 crores - a 17-year CAGR of 15.6%.
- ITC aims to make a significant contribution to India's financial, environmental, and social capital by creating multiple drivers of growth while sustaining leadership in tobacco and focusing on triple bottom line performance.
This document analyzes financial ratios for Bharathi Cement Company over five years. It finds that the company's current and quick ratios indicate sufficient current assets to meet liabilities. Profitability ratios like net profit ratio have been decreasing since 2016-17, suggesting ineffective costs. Activity ratios show mostly positive trends, with fixed asset turnover and debtor's turnover ratios increasing in recent years. However, working capital turnover declined in 2018-19, potentially due to inefficient working capital use. Leverage ratios like debt-equity have fluctuated over the period but were highest in 2016-17, indicating greater risk from higher debt levels that year.
This document analyzes financial ratios for Bharathi Cement Company over five years. It finds that the company's current and quick ratios indicate sufficient current assets to meet liabilities. Profitability ratios like net profit ratio have been decreasing since 2016-17, suggesting ineffective costs. Activity ratios such as fixed asset turnover and debtor's turnover generally increased over time, while working capital turnover decreased in 2018-19, indicating inefficient working capital use. Leverage ratios like debt-equity were highest in 2016-17 and 2017-18, showing the company may have difficulty meeting debt obligations during those periods. Overall the analysis finds mixed financial performance with some ratios satisfactory but others indicating room for improvement.
A presentation on mastering key management concepts across projects, products, programs, and portfolios. Whether you're an aspiring manager or looking to enhance your skills, this session will provide you with the knowledge and tools to succeed in various management roles. Learn about the distinct lifecycles, methodologies, and essential skillsets needed to thrive in today's dynamic business environment.
Originally presented at XP2024 Bolzano
While agile has entered the post-mainstream age, possibly losing its mojo along the way, the rise of remote working is dealing a more severe blow than its industrialization.
In this talk we'll have a look to the cumulative effect of the constraints of a remote working environment and of the common countermeasures.
12 steps to transform your organization into the agile org you deservePierre E. NEIS
During an organizational transformation, the shift is from the previous state to an improved one. In the realm of agility, I emphasize the significance of identifying polarities. This approach helps establish a clear understanding of your objectives. I have outlined 12 incremental actions to delineate your organizational strategy.
Impact of Effective Performance Appraisal Systems on Employee Motivation and ...Dr. Nazrul Islam
Healthy economic development requires properly managing the banking industry of any
country. Along with state-owned banks, private banks play a critical role in the country's economy.
Managers in all types of banks now confront the same challenge: how to get the utmost output from
their employees. Therefore, Performance appraisal appears to be inevitable since it set the
standard for comparing actual performance to established objectives and recommending practical
solutions that help the organization achieve sustainable growth. Therefore, the purpose of this
research is to determine the effect of performance appraisal on employee motivation and retention.
Designing and Sustaining Large-Scale Value-Centered Agile Ecosystems (powered...Alexey Krivitsky
Is Agile dead? It depends on what you mean by 'Agile'. If you mean that the organizations are not getting the promised benefits because they were focusing too much on the team-level agile "ways of working" instead of systemic global improvements -- then we are in agreement. It is a misunderstanding of Agility that led us down a dead-end. At Org Topologies, we see bright sparks -- the signs of the 'second wave of Agile' as we call it. The emphasis is shifting towards both in-team and inter-team collaboration. Away from false dichotomies. Both: team autonomy and shared broad product ownership are required to sustain true result-oriented organizational agility. Org Topologies is a package offering a visual language plus thinking tools required to communicate org development direction and can be used to help design and then sustain org change aiming at higher organizational archetypes.
A team is a group of individuals, all working together for a common purpose. This Ppt derives a detail information on team building process and ats type with effective example by Tuckmans Model. it also describes about team issues and effective team work. Unclear Roles and Responsibilities of teams as well as individuals.
Colby Hobson: Residential Construction Leader Building a Solid Reputation Thr...dsnow9802
Colby Hobson stands out as a dynamic leader in the residential construction industry. With a solid reputation built on his exceptional communication and presentation skills, Colby has proven himself to be an excellent team player, fostering a collaborative and efficient work environment.
Ganpati Kumar Choudhary Indian Ethos PPT.pptx, The Dilemma of Green Energy Corporation
Green Energy Corporation, a leading renewable energy company, faces a dilemma: balancing profitability and sustainability. Pressure to scale rapidly has led to ethical concerns, as the company's commitment to sustainable practices is tested by the need to satisfy shareholders and maintain a competitive edge.
Addiction to Winning Across Diverse Populations.pdf
Group A FRA.pptx
1. GROUP A
Presented by
Section D
Ayesha Anjum Khan-2021PGP198
Himanshu Parashar-2021PGP206
Himanshu Bulchandani-2021PGP205
Ruchika Suthar-2021PGP230
Tarun Kant-2021PGP245
Naval Mittal-2021PGP219
R Rajsekar-2021PGP226
Indian Institute of Management, Shillong
Financial Reporting and Analysis
Group Project
PGP21 Term I
2. India is the second-largest producer of garments in the world.
INDIAN TEXTILE SECTOR
US$223 billion
Expected Market Growth
24%
World’s spindle capacity
45 Million People
Directly/ Indirectly employed in
the sector
4%
Contribution to GDP of India
Key Growth Drivers:
• Increase in per capita income & demographic distribution
• Superior quality products
• Increased production and exports
Textile market has shown growth of ~14.58% in past 3 years. The
industry has attracted FDI worth $11 million and anticipates $60
million growth.
Key Challenges:
• Dearth of trained employees
• Increasing energy & transportation costs
• Industries reluctant to adopt new technologies
Exports anticipated to reach $60 billion in next 3
years, US being the primary market.
INDIAN TEXTILE SECTOR
CASE OVERVIEW
FINANCIAL SITUATION: ANANDAM
RATIO ANALYSIS
PRESENTATION INDEX :
CONCLUSION
3. Agarwal could easily procure raw
material & other resources
required for manufacturing, the
only problem he faced was getting
a stylish designer for new &
modern designs to cater market
needs.
He hired Ragini, Iyer, a young
fashion designer, under whom the
business flourished exponentially.
Anandam Manufacturing Company:
Established in April 2012
Business Growth
Financial Problems: 2015
In July 2015, Agarwal
approached a local bank
for additional funding of
₹50 million to continue
with the smooth
operations and to expand
his business.
CASE OVERVIEW
Anand Agarwal, a
qualified textile
engineer realized the
dearth of good-quality
dresses in the market.
He opened garment
manufacturing company
specializing in formal
dresses for girls upto 12
years of age, investing
₹1.2 million.
Anandam Manufacturing Company
INDIAN TEXTILE SECTOR
CASE OVERVIEW
FINANCIAL SITUATION: ANANDAM
RATIO ANALYSIS
PRESENTATION INDEX :
CONCLUSION
4. Key Funding Problems:
FINANCIAL SITUATION: ANANDAM
Working capital required for regular purchases of raw
material
Excessive credit periods granted to customers
Shortage of funds for new manufacturing machines
Insufficient factory space
In 2012, Anand Agarwal and his
wife were the only shareholders
and had shares of ₹ 1.2 million.
He borrowed ₹0.736 million as
mortgage of his assets, which
had a value of ₹1.9 million.
As the business expanded, he continued to borrow money from the
bank and the loan was ₹ 1.236 million in the second year and ₹ 2.5
million in the third year.
A part-time accountant maintained the financial records including
vouching, cash maintenance, receipts and payments of Anandam. These
statements were audited by a professional accountant.
The business was generating profits for all the expenses and interest
payments. The revenue increased from ₹2 million to ₹8 million in 3
years and PAT increased from ₹0.364 million to ₹0.84 million.
In July 2015, Anand Agarwal approached a local bank for additional
funding of ₹50 million to meet the growing requirements of the
company.
INDIAN TEXTILE SECTOR
CASE OVERVIEW
FINANCIAL SITUATION: ANANDAM
RATIO ANALYSIS
PRESENTATION INDEX :
CONCLUSION
5. Current ratio
Acid test ratio (quick ratio)
01
02
Sector Average 2.30:1
Sector Average 1.20:1
The current ratio, otherwise known as the working capital ratio, measures the ability of a business to meet its short-term obligations that
are due within a year. The ratio compares total current assets to total current liabilities. The current ratio looks at how a company can
maximize the liquidity of its current assets to settle its debt obligations.
The quick ratio, also known as the acid-test ratio, measures the ability of a business to pay its short-term liabilities by having assets that
are readily convertible into cash. These assets are cash, marketable securities, and accounts receivable. These assets are considered
“quick” assets because they can be quickly and easily converted into cash.
𝐶𝑢𝑟𝑟𝑒𝑛𝑡 𝐴𝑠𝑠𝑒𝑡𝑠
𝐶𝑢𝑟𝑟𝑒𝑛𝑡 𝐿𝑖𝑎𝑏𝑖𝑙𝑖𝑡𝑖𝑒𝑠
𝐶𝑎𝑠ℎ + 𝑚𝑎𝑟𝑘𝑒𝑡𝑎𝑏𝑙𝑒 𝑠𝑒𝑐𝑢𝑟𝑖𝑡𝑖𝑒𝑠 + 𝑎𝑐𝑐𝑜𝑢𝑛𝑡𝑠 𝑟𝑒𝑐𝑖𝑒𝑣𝑎𝑏𝑙𝑒
𝐶𝑢𝑟𝑟𝑒𝑛𝑡 𝐿𝑖𝑎𝑏𝑖𝑙𝑖𝑡𝑖𝑒𝑠
INDIAN TEXTILE SECTOR
CASE OVERVIEW
FINANCIAL SITUATION: ANANDAM
RATIO ANALYSIS
PRESENTATION INDEX :
Company Ratio
2012-13 2013-14 2014-15
2.54 1.79 1.60
Company Ratio
2012-13 2013-14 2014-15
1.31 0.93 0.79
The current ratio, otherwise known as the working capital ratio, measures the ability of a business to meet its short-term obligations that
are due within a year. The ratio compares total current assets to total current liabilities. The current ratio looks at how a company can
maximize the liquidity of its current assets to settle its debt obligations.
ANALYSIS: Our current ratio for the year 2013-14 and 2014-15 is less than the sector average which indicate
a possibility of high risk of distress or default
ANALYSIS: Company Acid test ratio is less than the industry
ration which suggest that company is taking high amount of risk
by not maintaining a proper shield of liquid resources
CONCLUSION
6. Receivable turnover ratio
Receivable days
03
04
Sector Average 52 days
Sector Average 7 times
The accounts receivable turnover ratio, sometimes known as the debtor’s turnover ratio, measures the number of times over a specific period
that a company collects its average accounts receivable.
The accounts receivable turnover ratio can also be manipulated to obtain the average number of days it takes to collect credit sales from
customers, known as accounts receivable days.
𝑁𝑒𝑡 𝐶𝑟𝑒𝑑𝑖𝑡 𝑆𝑎𝑙𝑒𝑠
𝐴𝑣𝑒𝑟𝑎𝑔𝑒 𝑎𝑐𝑐𝑜𝑢𝑛𝑡𝑠 𝑟𝑒𝑐𝑖𝑒𝑣𝑎𝑏𝑙𝑒
365
𝑅𝑒𝑐𝑒𝑖𝑣𝑎𝑏𝑙𝑒 𝑇𝑢𝑟𝑛𝑜𝑣𝑒𝑟 𝑅𝑎𝑡𝑖𝑜
INDIAN TEXTILE SECTOR
CASE OVERVIEW
FINANCIAL SITUATION: ANANDAM
RATIO ANALYSIS
PRESENTATION INDEX :
Company Ratio
2012-13 2013-14 2014-15
54.75 114.0625 95.8125
Company Ratio
2012-13 2013-14 2014-15
6.666667 3.2 3.809524
ANALYSIS: Since the company receivable turnover ratio is less than the industry average, suggests that
company collection process is poor
ANALYSIS: Company receivable days is more than the sector average implies that time taken by company
to recover the amount is more when company to other companies which may lead to cash flow problems in
long run
CONCLUSION
7. Inventory turnover ratio
Inventory days
05
06
Sector Average 4.85 times
Sector Average 75 days
The days sales of inventory (DSI) is a financial ratio that indicates the average time in days that a company takes to turn its inventory, including
goods that are a work in progress, into sales.
The inventory turnover ratio measures how many times a business sells and replaces its stock of goods in a given period of time. This ratio looks
at cost of goods sold relative to average inventory in the period.
This ratio indicates how efficient a business is at clearing its inventories.
𝐶𝑂𝐺𝑆
𝐴𝑣𝑒𝑟𝑎𝑔𝑒 𝐼𝑛𝑣𝑒𝑛𝑡𝑜𝑟𝑦 𝑎𝑡 𝑠𝑒𝑙𝑙𝑖𝑛𝑔 𝑝𝑟𝑖𝑐𝑒
365
𝐼𝑛𝑣𝑒𝑛𝑡𝑟𝑜𝑦 𝑡𝑢𝑟𝑛 𝑜𝑣𝑒𝑟 𝑟𝑎𝑡𝑖𝑜
INDIAN TEXTILE SECTOR
CASE OVERVIEW
FINANCIAL SITUATION: ANANDAM
RATIO ANALYSIS
PRESENTATION INDEX :
Company Ratio
2012-13 2013-14 2014-15
94.19355 193.3263 171.0938
Company Ratio
2012-13 2013-14 2014-15
3.875 1.888 2.133333
ANALYSIS: Low inventory ratio indicate that company is carrying too much inventory, which could suggest
poor inventory management or low sales
ANALYSIS: A high days inventory outstanding indicates that a company is not able to quickly turn its
inventory into sales.
CONCLUSION
8. Long-term debt to total debt
Debt-to-equity ratio
07
08
Sector Average 24%
Sector Average 35%
Ratio between Long-Term Debt and Total Debt. This ratio indicates how much money the company owes in long-term debt for each
unit of money it owes in overall debt.
The debt-to-equity ratio is a leverage ratio that calculates the proportion of total debt and liabilities versus total shareholders’ equity. The ratio
compares whether a company’s capital structure utilizes more debt or equity financing.
The ratio looks at total debt which consists of short-term debt, long-term debt, and other fixed payment obligations (such as capital leases).
𝑆ℎ𝑜𝑟𝑡 𝑡𝑒𝑟𝑚 𝑑𝑒𝑏𝑡 + 𝑙𝑜𝑛𝑔 𝑡𝑒𝑟𝑚 𝑑𝑒𝑏𝑡 + 𝑜𝑡ℎ𝑒𝑟 𝑓𝑖𝑥𝑒𝑑 𝑝𝑎𝑦𝑚𝑒𝑛𝑡𝑠
𝑆ℎ𝑎𝑟𝑒 ℎ𝑜𝑙𝑑𝑒𝑟′𝑠 𝑒𝑞𝑢𝑖𝑡𝑦
INDIAN TEXTILE SECTOR
CASE OVERVIEW
FINANCIAL SITUATION: ANANDAM
RATIO ANALYSIS
PRESENTATION INDEX :
Company Ratio
2012-13 2013-14 2014-15
63.68% 112.44% 136.22%
Company Ratio
2012-13 2013-14 2014-15
73.90% 41.70% 47.35%
ANALYSIS: A high long term debt ratio indicate that company will have huge interest obligation in future
which will affect the cash flow and profit of the company
ANALYSIS: A higher than sector average implies that there is high risk of loan default and company may also have difficulty in
securing additional fund
CONCLUSION
𝐿𝑜𝑛𝑔 𝑡𝑒𝑟𝑚 𝑑𝑒𝑏𝑡
𝑇𝑜𝑡𝑎𝑙 𝐷𝑒𝑏𝑡
9. Gross profit ratio
Net profit ratio
09
10
Sector Average 40%
Sector Average 18%
The net profit percentage is the ratio of after-tax profits to net sales. It reveals the remaining profit after all costs of production, administration,
and financing have been deducted from sales, and income taxes recognized.
The gross margin ratio, also known as the gross profit margin ratio, is a profitability ratio that compares the gross margin of a company to its
revenue. It shows how much profit a company makes after paying off its cost of goods sold (COGS). The ratio indicates the percentage of each dollar
of revenue that the company retains as gross profit, so naturally a high gross margin ratio is desired.
𝑅𝑒𝑣𝑒𝑛𝑢𝑒 − 𝐶𝑂𝐺𝑆
𝑅𝑒𝑣𝑒𝑛𝑢𝑒
𝑁𝑒𝑡 𝑖𝑛𝑐𝑜𝑚𝑒
𝑇𝑜𝑡𝑎𝑙 𝑟𝑒𝑣𝑒𝑛𝑢𝑒
INDIAN TEXTILE SECTOR
CASE OVERVIEW
FINANCIAL SITUATION: ANANDAM
RATIO ANALYSIS
PRESENTATION INDEX :
Company Ratio
2012-13 2013-14 2014-15
18.20% 14.00% 10.50%
Company Ratio
2012-13 2013-14 2014-15
38.00% 41.00% 40.00%
ANALYSIS: Company GP ratio is at par with sector which indicate that company is doing well on the part of
maintaining revenue and expenses
ANALYSIS: A lower net profit ratio indicates that company is not doing well on part of converting sales into
actual profit and expenses other than operation expenses are on the higher side
CONCLUSION
10. Return on equity
Return on total assets
11
12
Sector Average 22%
Sector Average 10%
Return on equity is a measure of a company’s annual return (net income) divided by the value of its total shareholders’ equity, expressed as a
percentage (e.g. 10%). Alternatively, ROE can also be derived by dividing the firm’s dividend growth rate by its earnings retention rate (1-dividend
payout ratio). There are several ROE drivers, and we will further breakdown the ratio.
The return on total assets ratio indicates how well a company’s investments generate
value, making it an important measure of productivity for a business.
𝑁𝑒𝑡 𝑖𝑛𝑐𝑜𝑚𝑒
𝑆ℎ𝑎𝑟𝑒ℎ𝑜𝑙𝑑𝑒𝑟′𝑠 𝑒𝑞𝑢𝑖𝑡𝑦
𝑁𝑒𝑡 𝑖𝑛𝑐𝑜𝑚𝑒
𝑇𝑜𝑡𝑎𝑙 𝑎𝑠𝑠𝑒𝑠𝑡𝑠
INDIAN TEXTILE SECTOR
CASE OVERVIEW
FINANCIAL SITUATION: ANANDAM
RATIO ANALYSIS
PRESENTATION INDEX :
Company Ratio
2012-13 2013-14 2014-15
14.22% 12.00% 9.17%
Company Ratio
2012-13 2013-14 2014-15
23.27% 25.49% 21.67%
ANALYSIS: A good rule of thumb is to target an ROE that is equal to or just above the average for the
company's sector—those in the same business and it is the good sign of anandam that its ROE is equal to
sector average
ANALYSIS: ROA of company is at par with industry average which indicate that company is efficiently
using it assets
CONCLUSION
11. Total asset turnover ratio
Fixed asset turnover ratio
13
14
Sector Average 1.1
Sector Average 2
The fixed asset turnover ratio reveals how efficient a company is at generating sales from its existing fixed assets. A higher ratio implies that
management is using its fixed assets more effectively.
The total asset turnover ratio compares the sales of a company to its asset base. The ratio measures the ability of an organization to efficiently
produce sales, and is typically used by third parties to evaluate the operations of a business. Ideally, a company with a high total asset
turnover ratio can operate with fewer assets than a less efficient competitor, and so requires less debt and equity to operate. The result should
be a comparatively greater return to its shareholders.
𝑁𝑒𝑡 𝑆𝑎𝑙𝑒𝑠
𝐴𝑣𝑒𝑟𝑎𝑔𝑒 𝑡𝑜𝑡𝑎𝑙 𝑎𝑠𝑠𝑒𝑡𝑠
𝑁𝑒𝑡 𝑆𝑎𝑙𝑒𝑠
𝐴𝑣𝑒𝑟𝑎𝑔𝑒 𝑓𝑖𝑥𝑒𝑑 𝑎𝑠𝑠𝑒𝑡𝑠
INDIAN TEXTILE SECTOR
CASE OVERVIEW
FINANCIAL SITUATION: ANANDAM
RATIO ANALYSIS
PRESENTATION INDEX :
Company Ratio
2012-13 2013-14 2014-15
1.1 1.9 1.7
Company Ratio
2012-13 2013-14 2014-15
0.8 0.9 0.9
ANALYSIS: Lower ratio indicate that company isn’t using its assets efficiently and most likely have
management or production problems
ANALYSIS: Company lower fixed turnover ration than sector average indicate that company is most likely
not using its fixed assets efficiently
CONCLUSION
12. Current Asset Turn Over Ratio
Interest Coverage Ratio (Times Interest Earned)
15
16
Sector Average 3
Sector Average 10
Current Assets Turnover Ratio indicates that the current assets are turned over in the form of sales more number of times. A high current assets
turnover ratio indicates the capability of the organization to achieve maximum sales with the minimum investment in current assets. Higher the
current ratio better will be the situation.
The times interest earned (TIE) ratio is a measure of a company's ability to meet its debt obligations based on its current income. The formula for
a company's TIE number is earnings before interest and taxes (EBIT) divided by the total interest payable on bonds and other debt.
𝑁𝑒𝑡 𝑆𝑎𝑙𝑒𝑠
𝐴𝑣𝑒𝑟𝑎𝑔𝑒 𝐶𝑢𝑟𝑟𝑒𝑛𝑡 𝐴𝑠𝑠𝑒𝑡𝑠
𝐸𝐵𝐼𝐷𝑇𝐴
𝐼𝑛𝑡𝑒𝑟𝑒𝑠𝑡 𝑒𝑥𝑝𝑒𝑛𝑠𝑒
INDIAN TEXTILE SECTOR
CASE OVERVIEW
FINANCIAL SITUATION: ANANDAM
RATIO ANALYSIS
PRESENTATION INDEX :
Company Ratio
2012-13 2013-14 2014-15
9.666667 7.075949 4.529412
Company Ratio
2012-13 2013-14 2014-15
3.0 1.5 1.8
ANALYSIS: Low current asset turnover ratio indicate that company is not efficiently using its current ratio
to generate sales
ANALYSIS: Low Interest coverage ratio indicate that company doesn’t have enough funds to service its
debts and it can be a problem for a company in near future. In worst case it can even land in liquidation of
company
CONCLUSION
13. Working capital turnover ratio
Return on fixed assets
17
18
Sector Average 8
Sector Average 24%
Working capital turnover is a ratio that measures how efficiently a company is using its working capital to support sales and growth. Working
capital turnover measures how effective a business is at generating sales for every dollar of working capital put to use. A higher working capital
turnover ratio is better, and indicates that a company is able to generate a larger amount of sales.
how much money the company makes in return for its assets. To calculate RoFA, divide current operational income by investment cost.
𝑁𝑒𝑡 𝑆𝑎𝑙𝑒𝑠
𝑊𝑜𝑟𝑘𝑖𝑛𝑔 𝑐𝑎𝑝𝑖𝑡𝑎𝑙
𝐶𝑢𝑟𝑟𝑒𝑛𝑡 𝑜𝑝𝑒𝑟𝑎𝑡𝑖𝑜𝑛𝑎𝑙 𝑖𝑛𝑐𝑜𝑚𝑒
𝐼𝑛𝑣𝑒𝑡𝑠𝑚𝑒𝑛𝑡 𝑐𝑜𝑠𝑡
INDIAN TEXTILE SECTOR
CASE OVERVIEW
FINANCIAL SITUATION: ANANDAM
RATIO ANALYSIS
PRESENTATION INDEX :
Company Ratio
2012-13 2013-14 2014-15
19.16% 26.88% 17.87%
Company Ratio
2012-13 2013-14 2014-15
5.0 3.5 4.8
ANALYSIS: Company lower working capital turnover ratio indicates that business is investing in too many
account receivable and inventory to support its sales which could lead to to an excessive amount of bad debt
or obsolete inventory
ANALYSIS:
CONCLUSION
14. CONCLUSION
As a loan officer, I cannot grant the loan. As per the given data,
the ratio of the company fall down in financial 2015. The key ratio
of the company is also below the industry average ratio which
implies that the company may not be able to pay its interest in
due time and finally may lead to insolvency due to high collection
period and low current ratio than industry average
INDIAN TEXTILE SECTOR
CASE OVERVIEW
FINANCIAL SITUATION: ANANDAM
RATIO ANALYSIS
PRESENTATION INDEX :
CONCLUSION