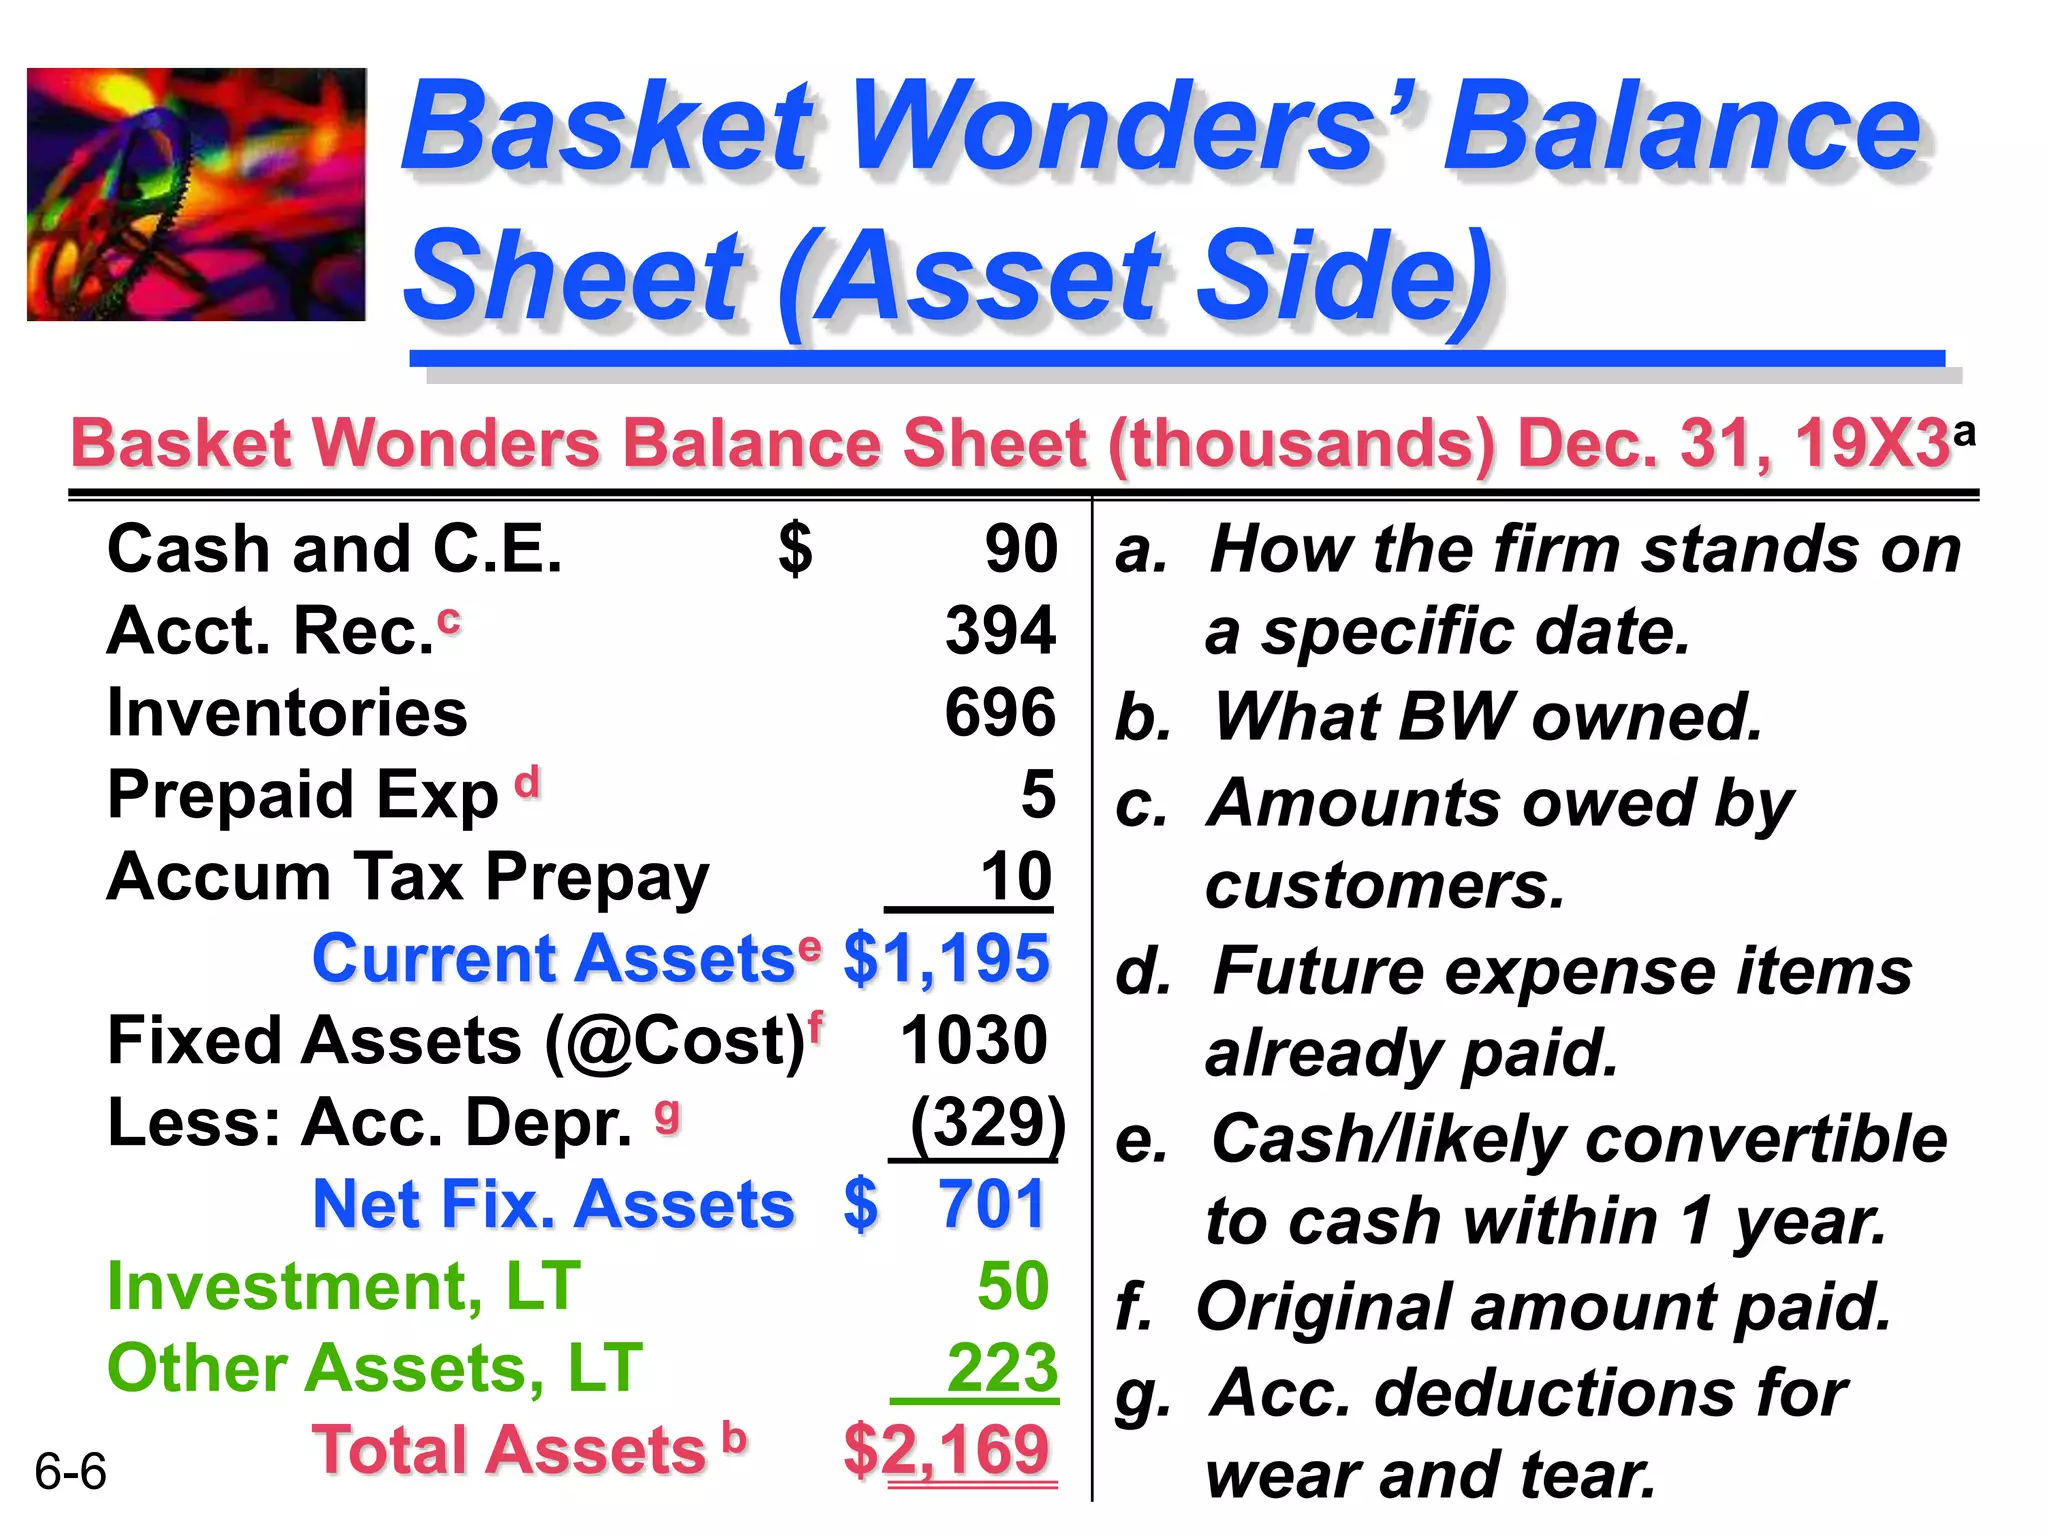
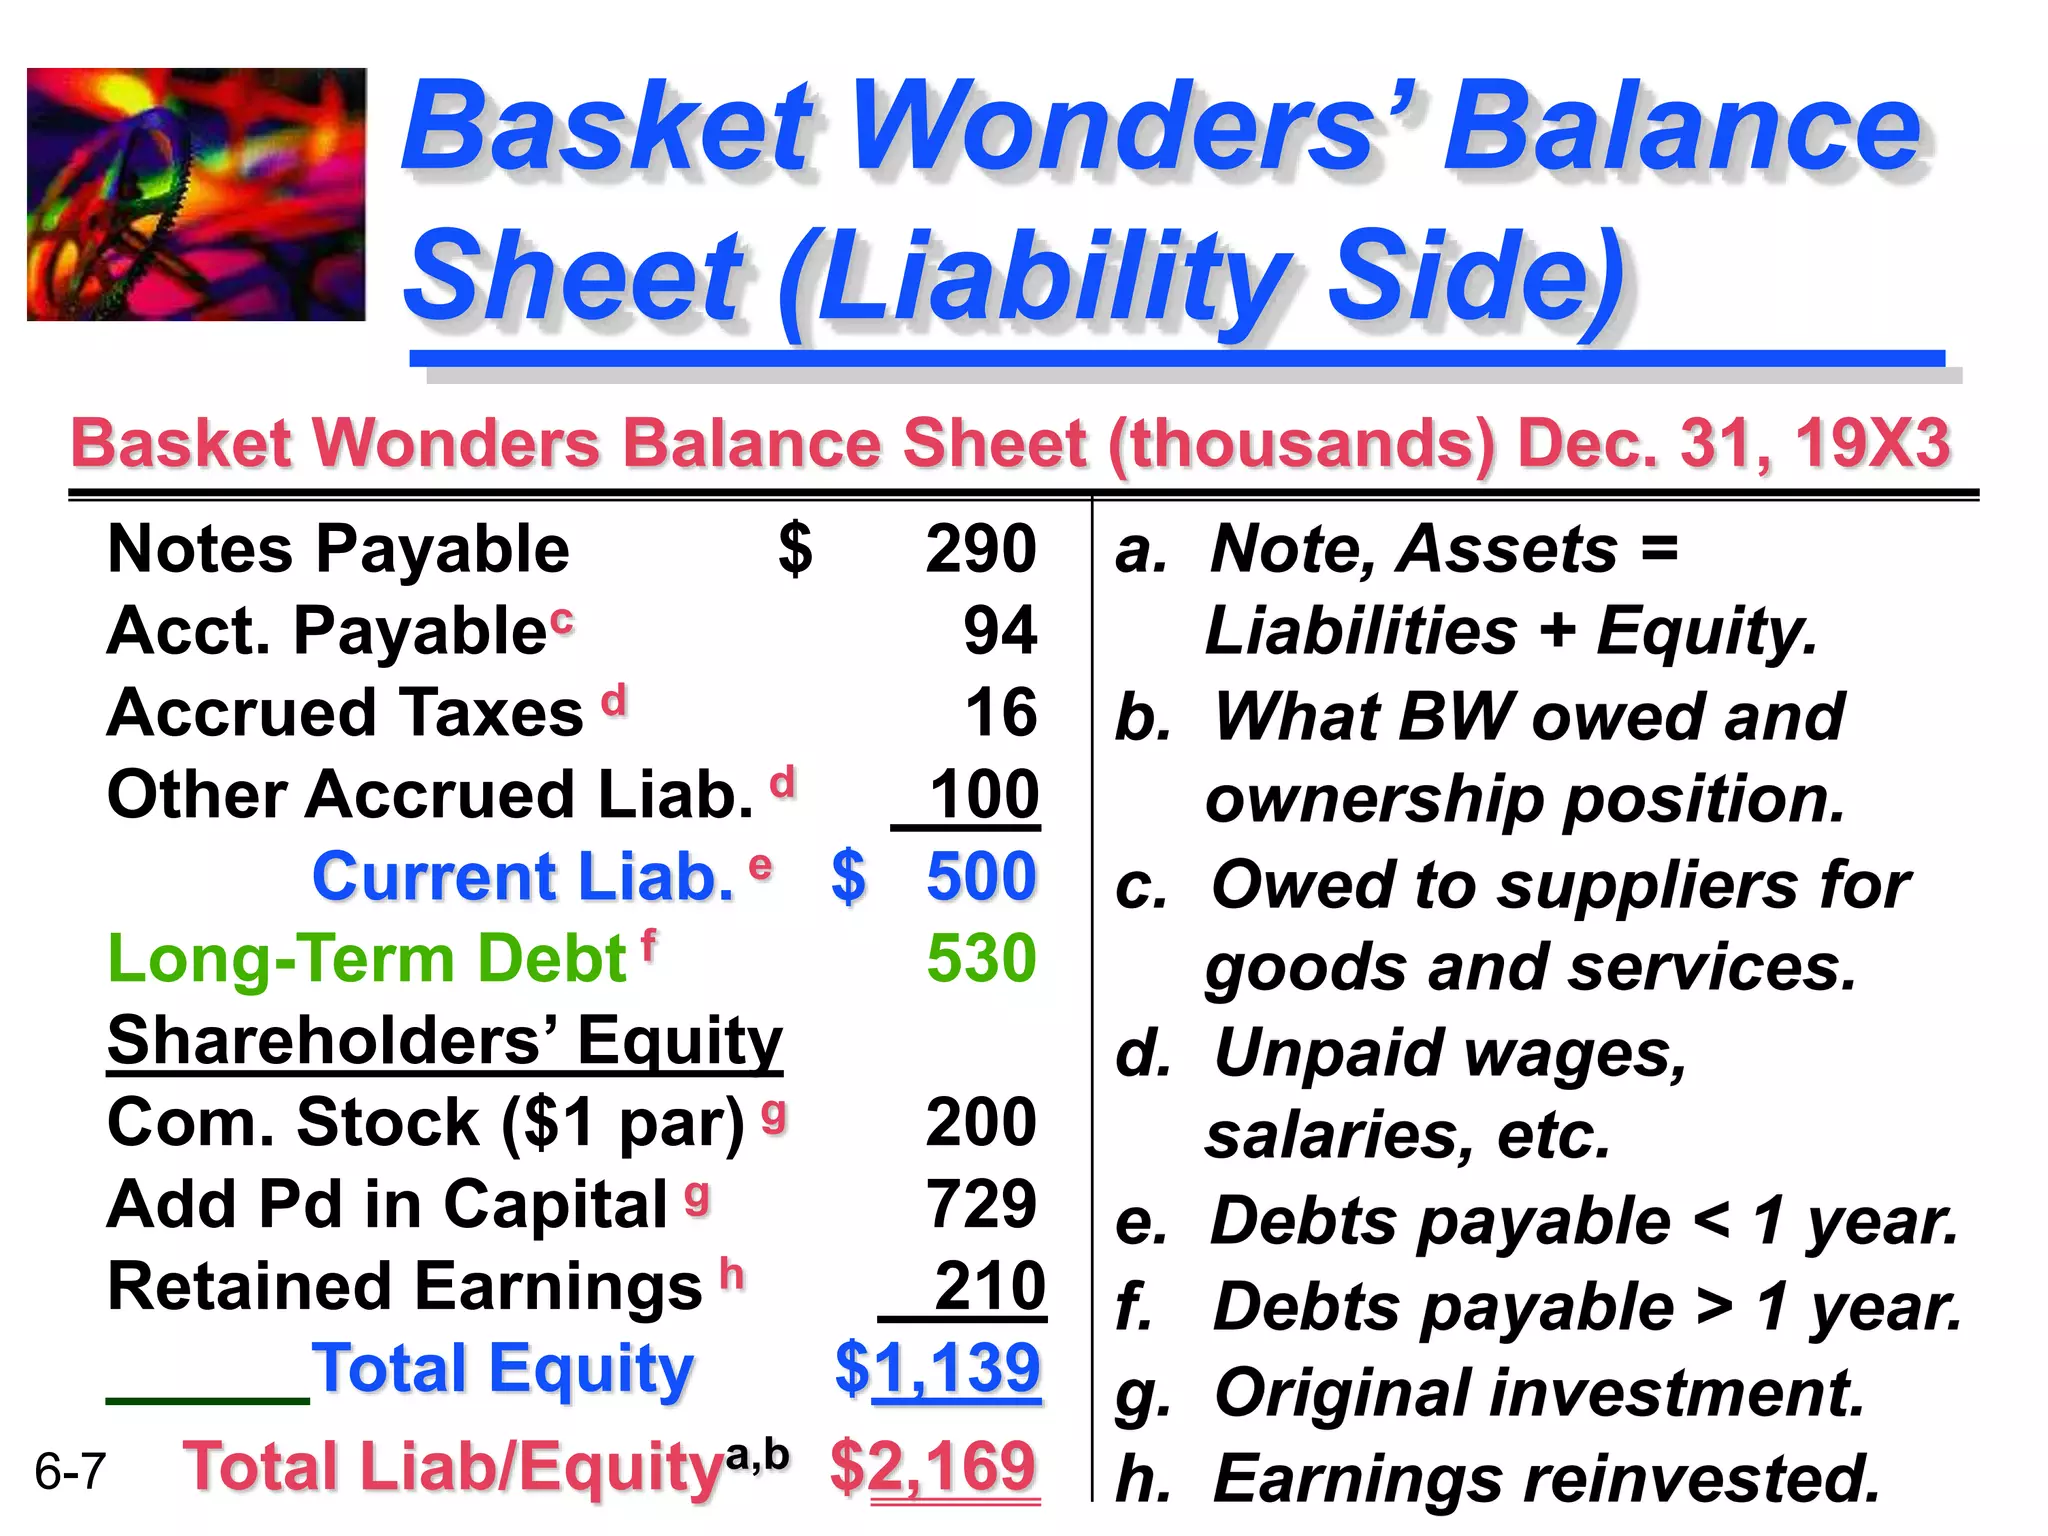
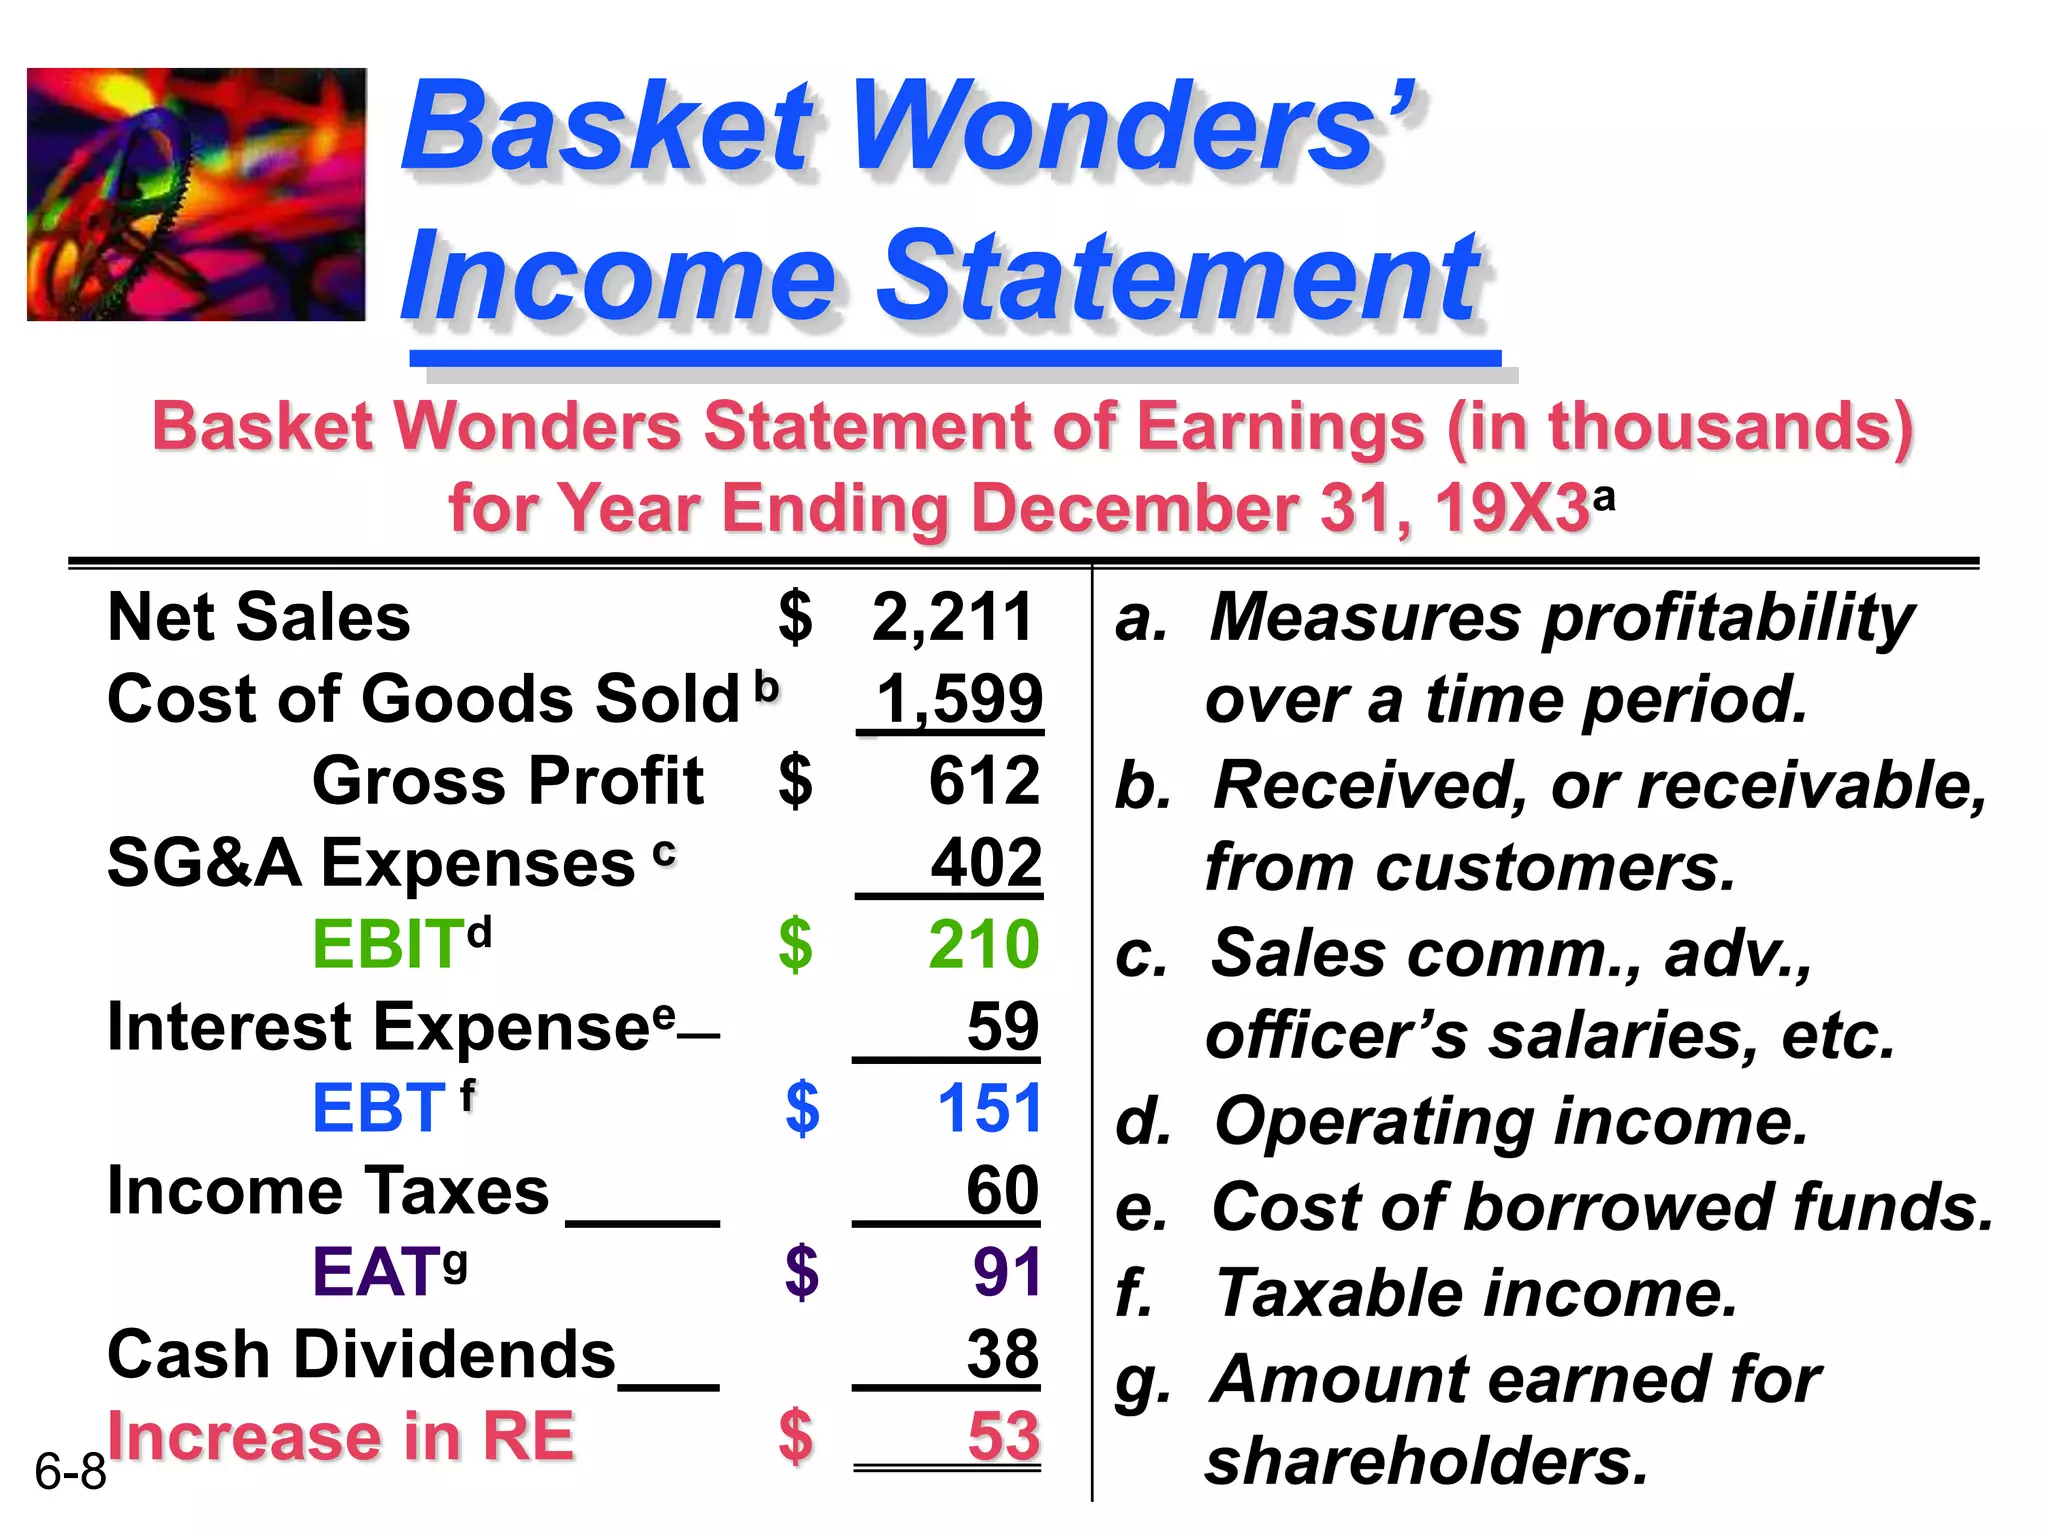
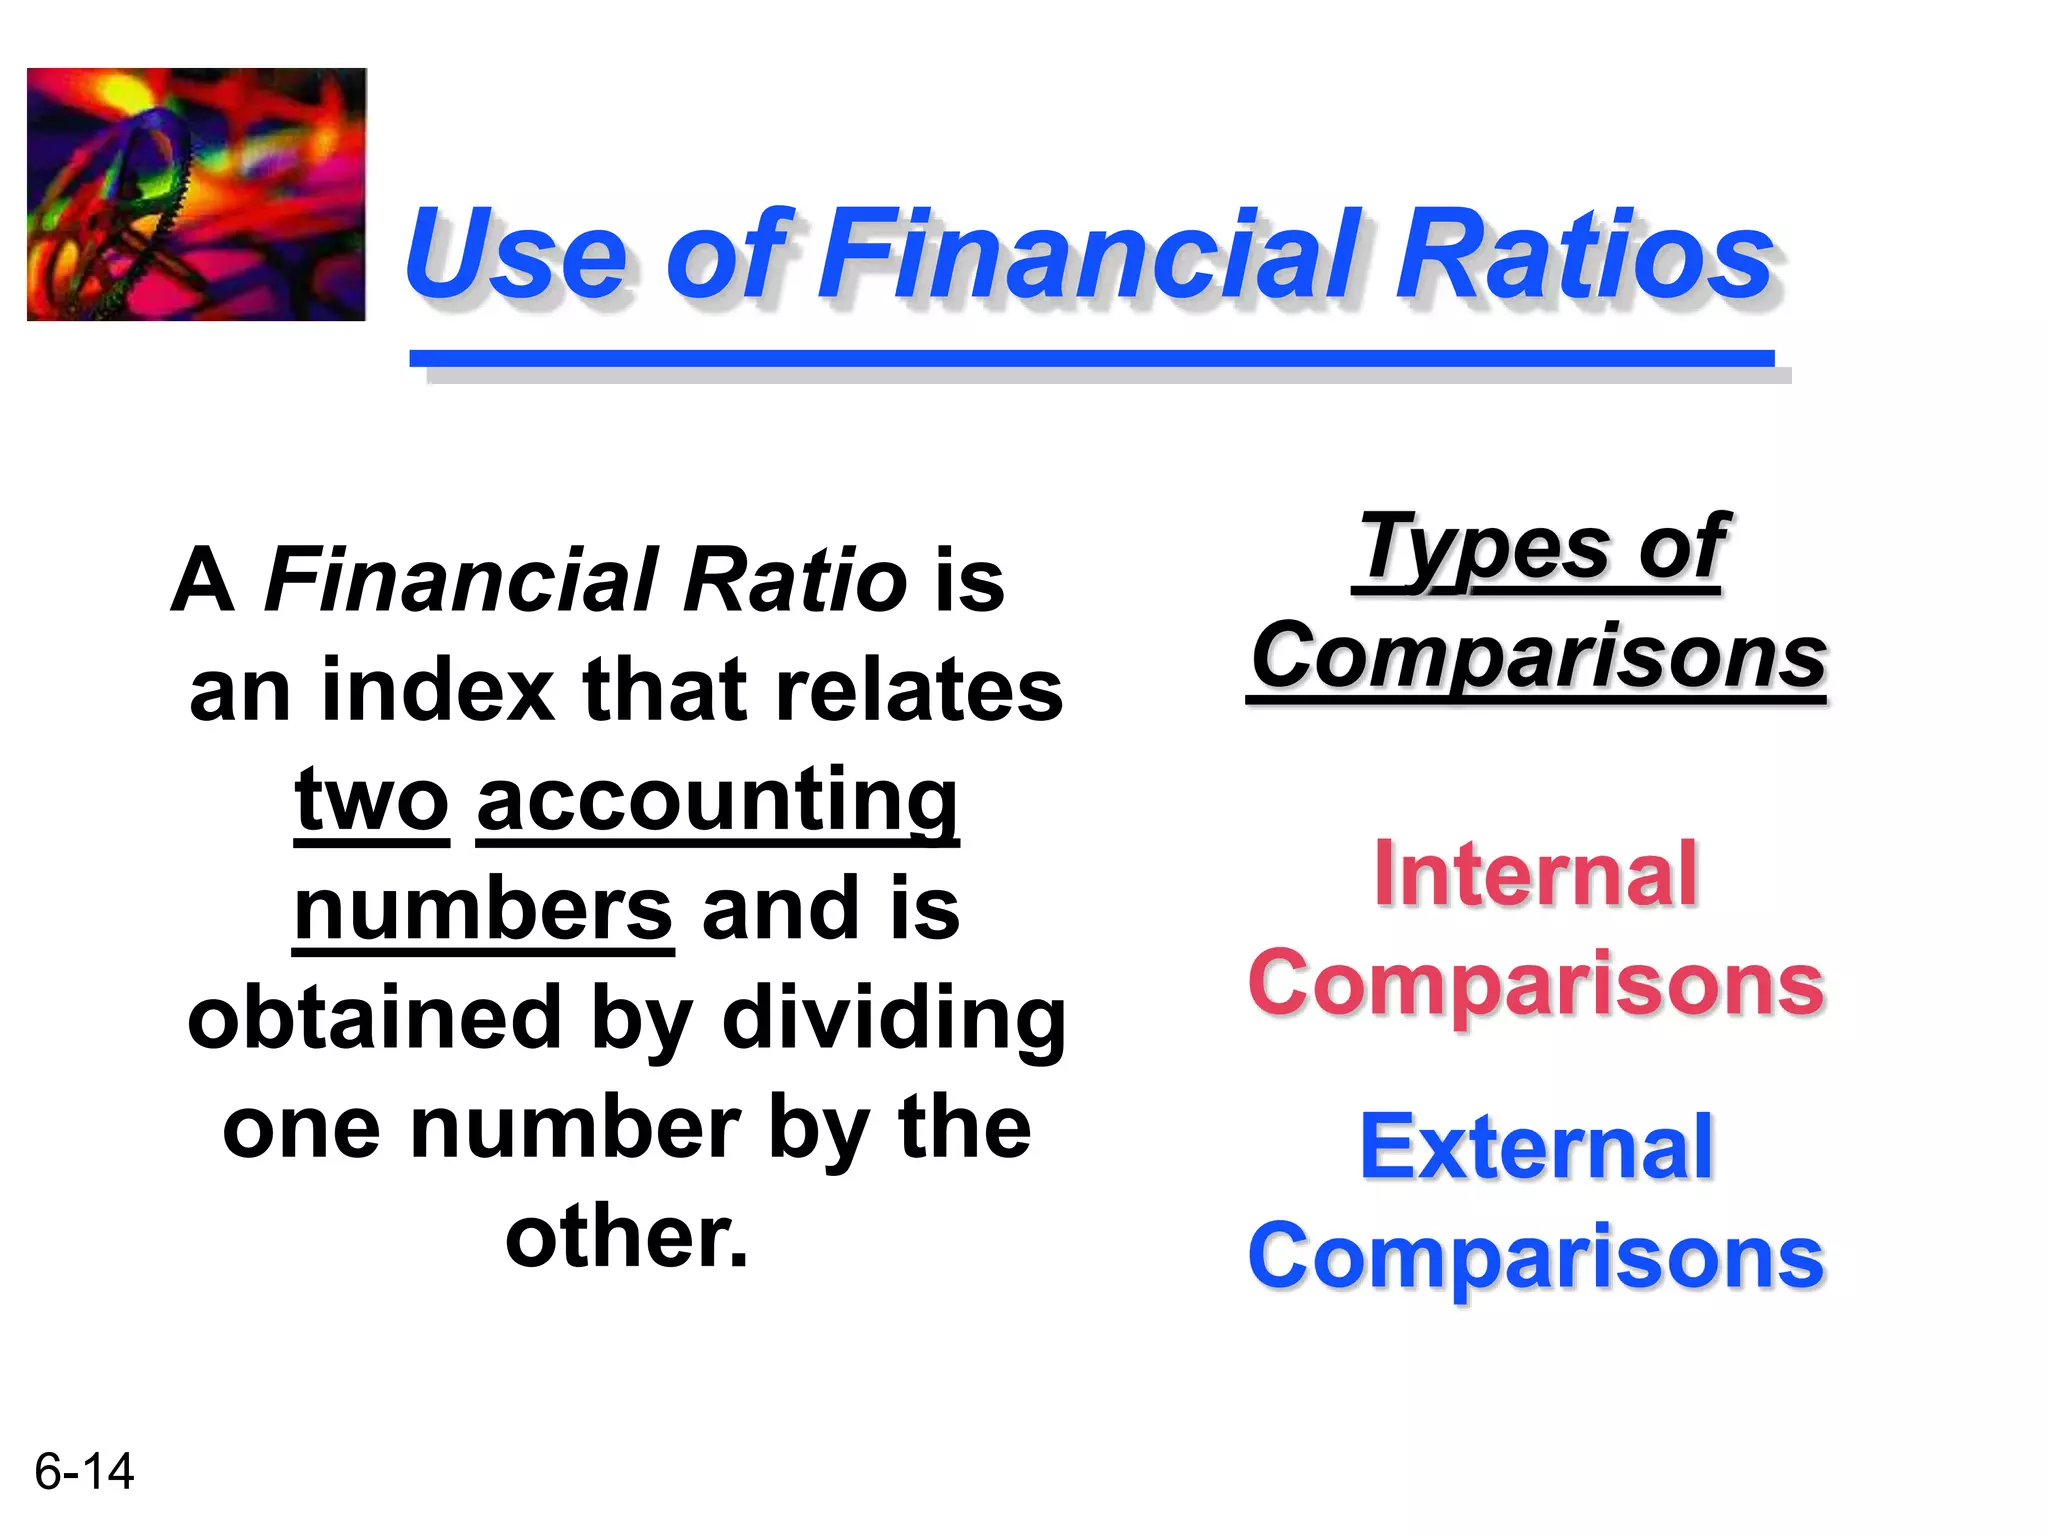
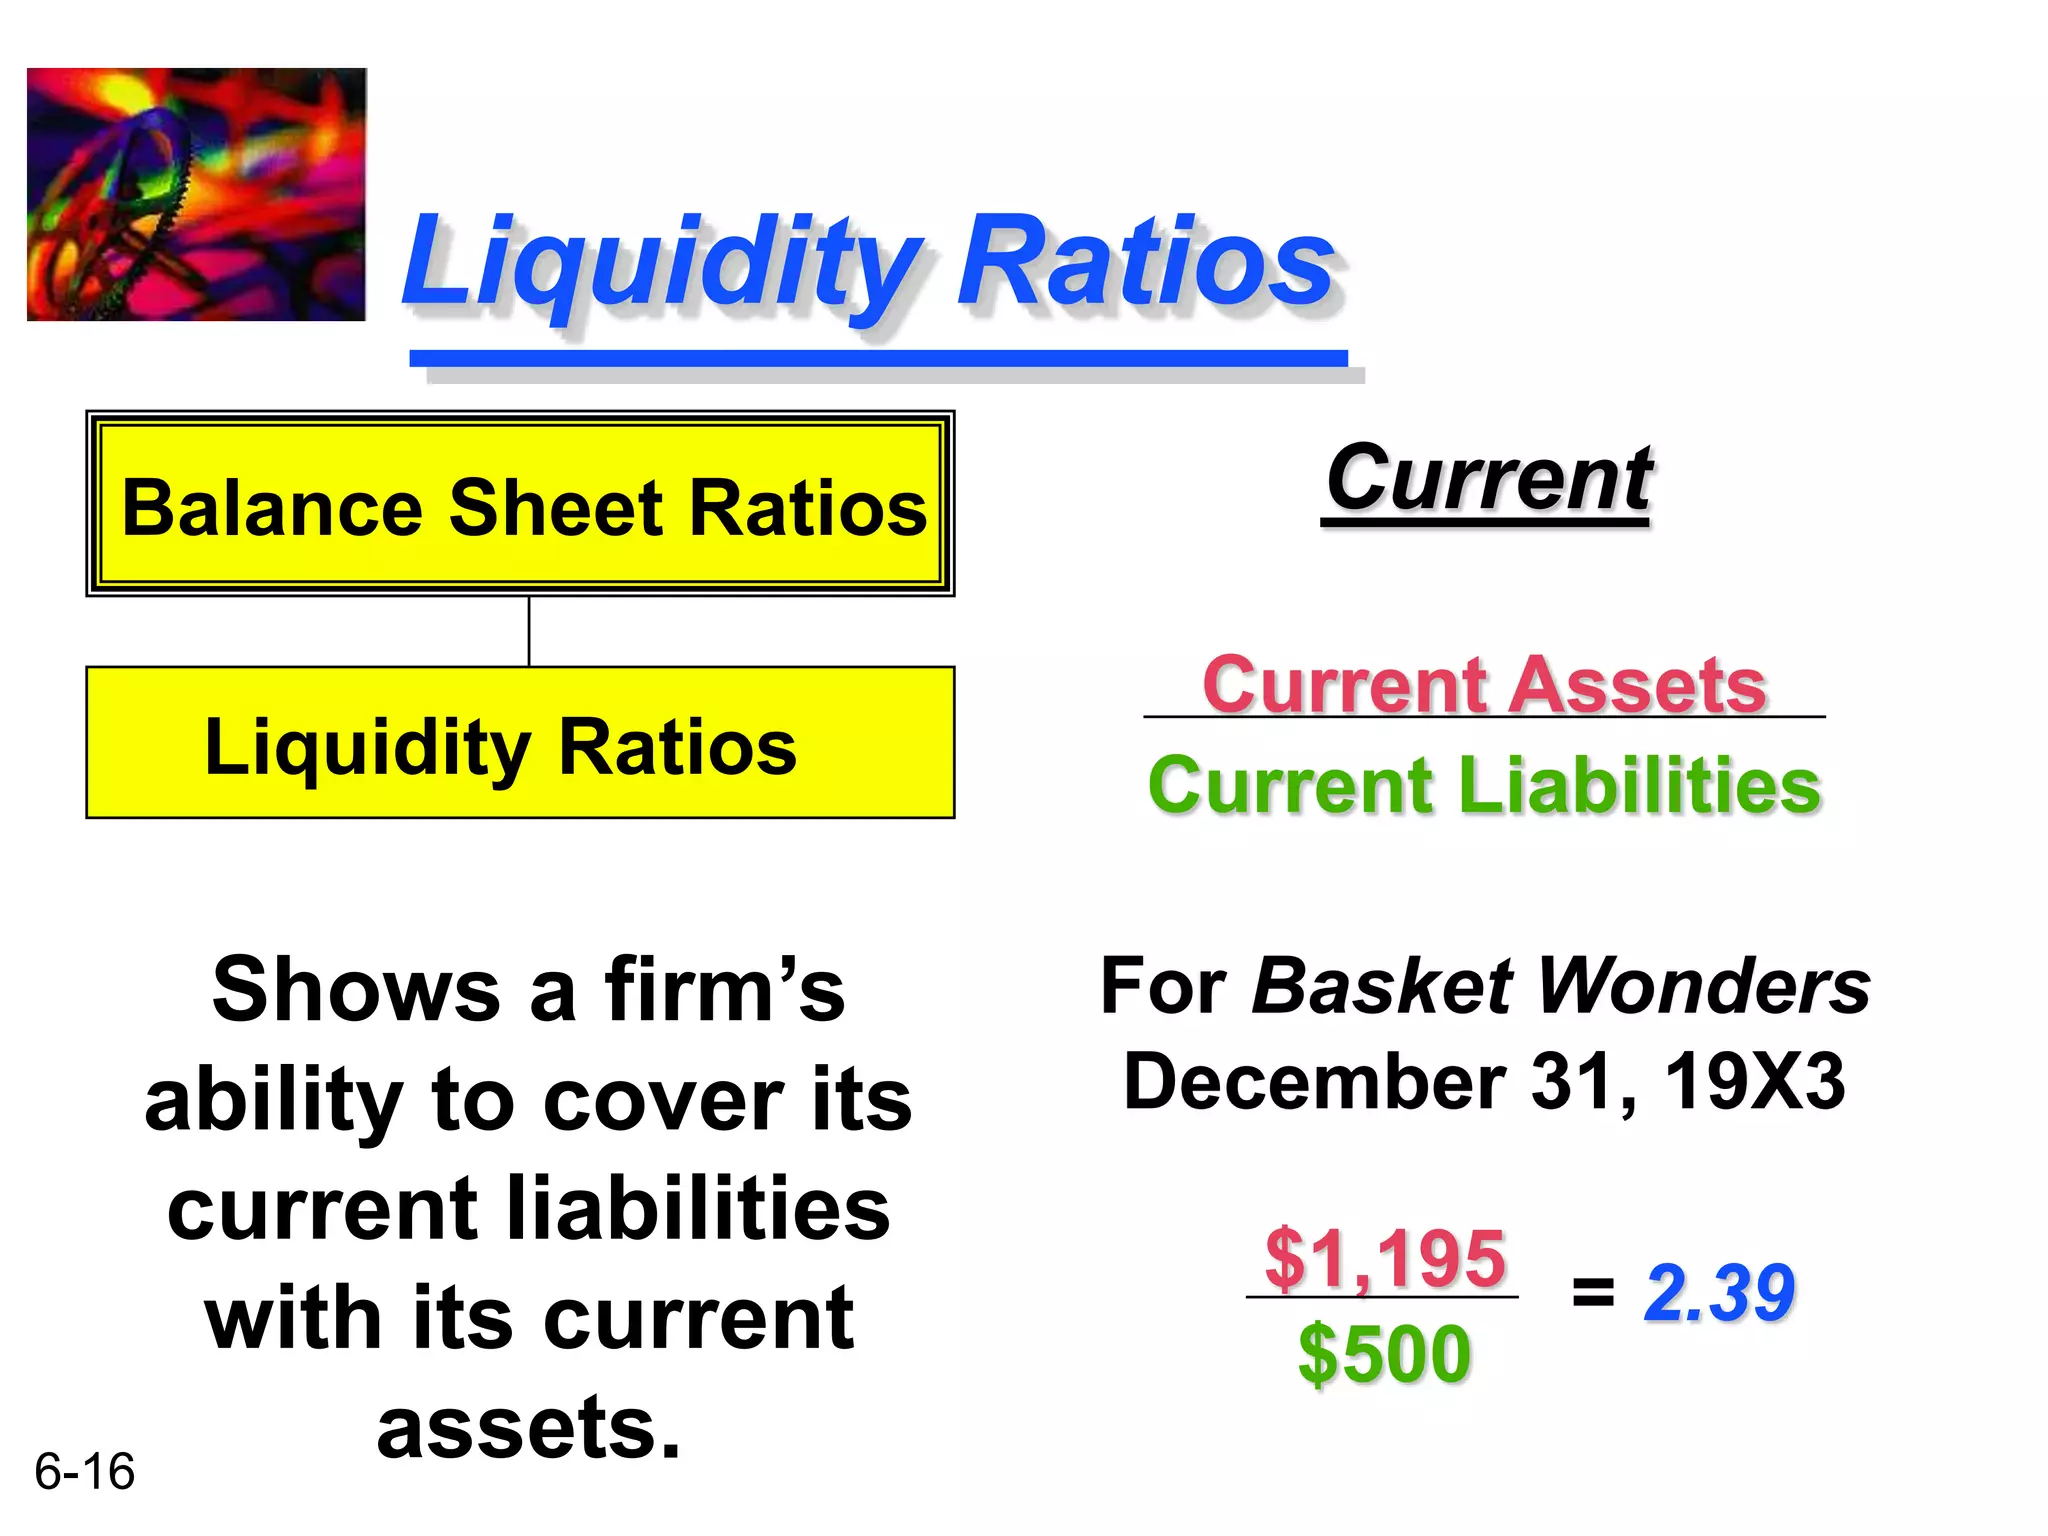
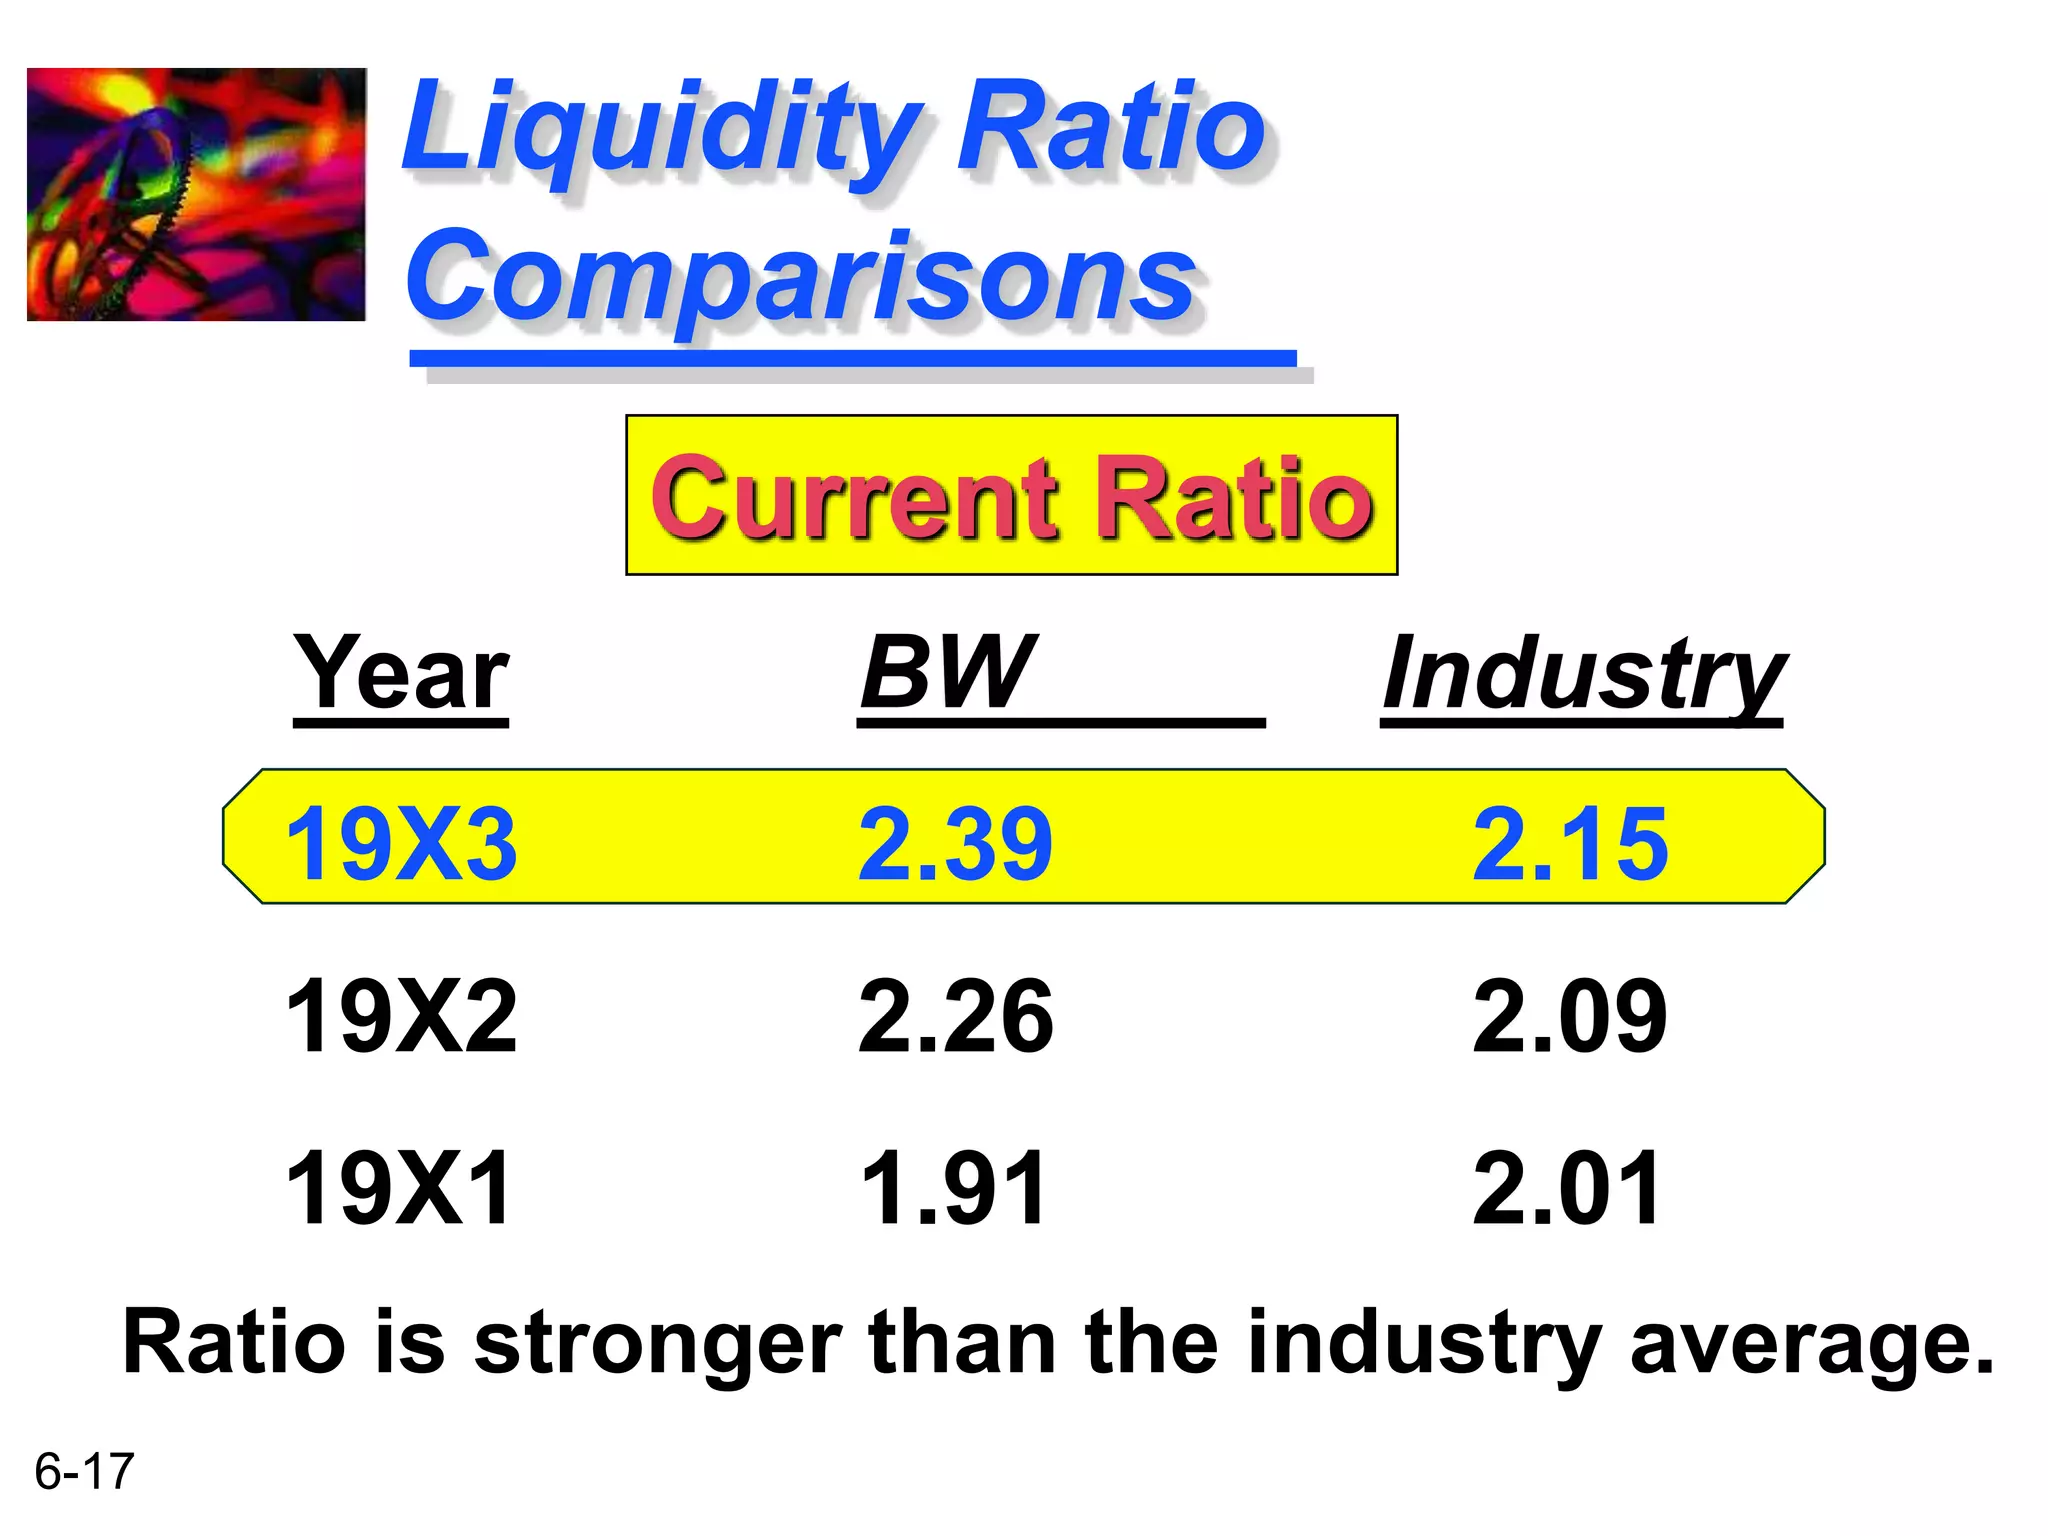
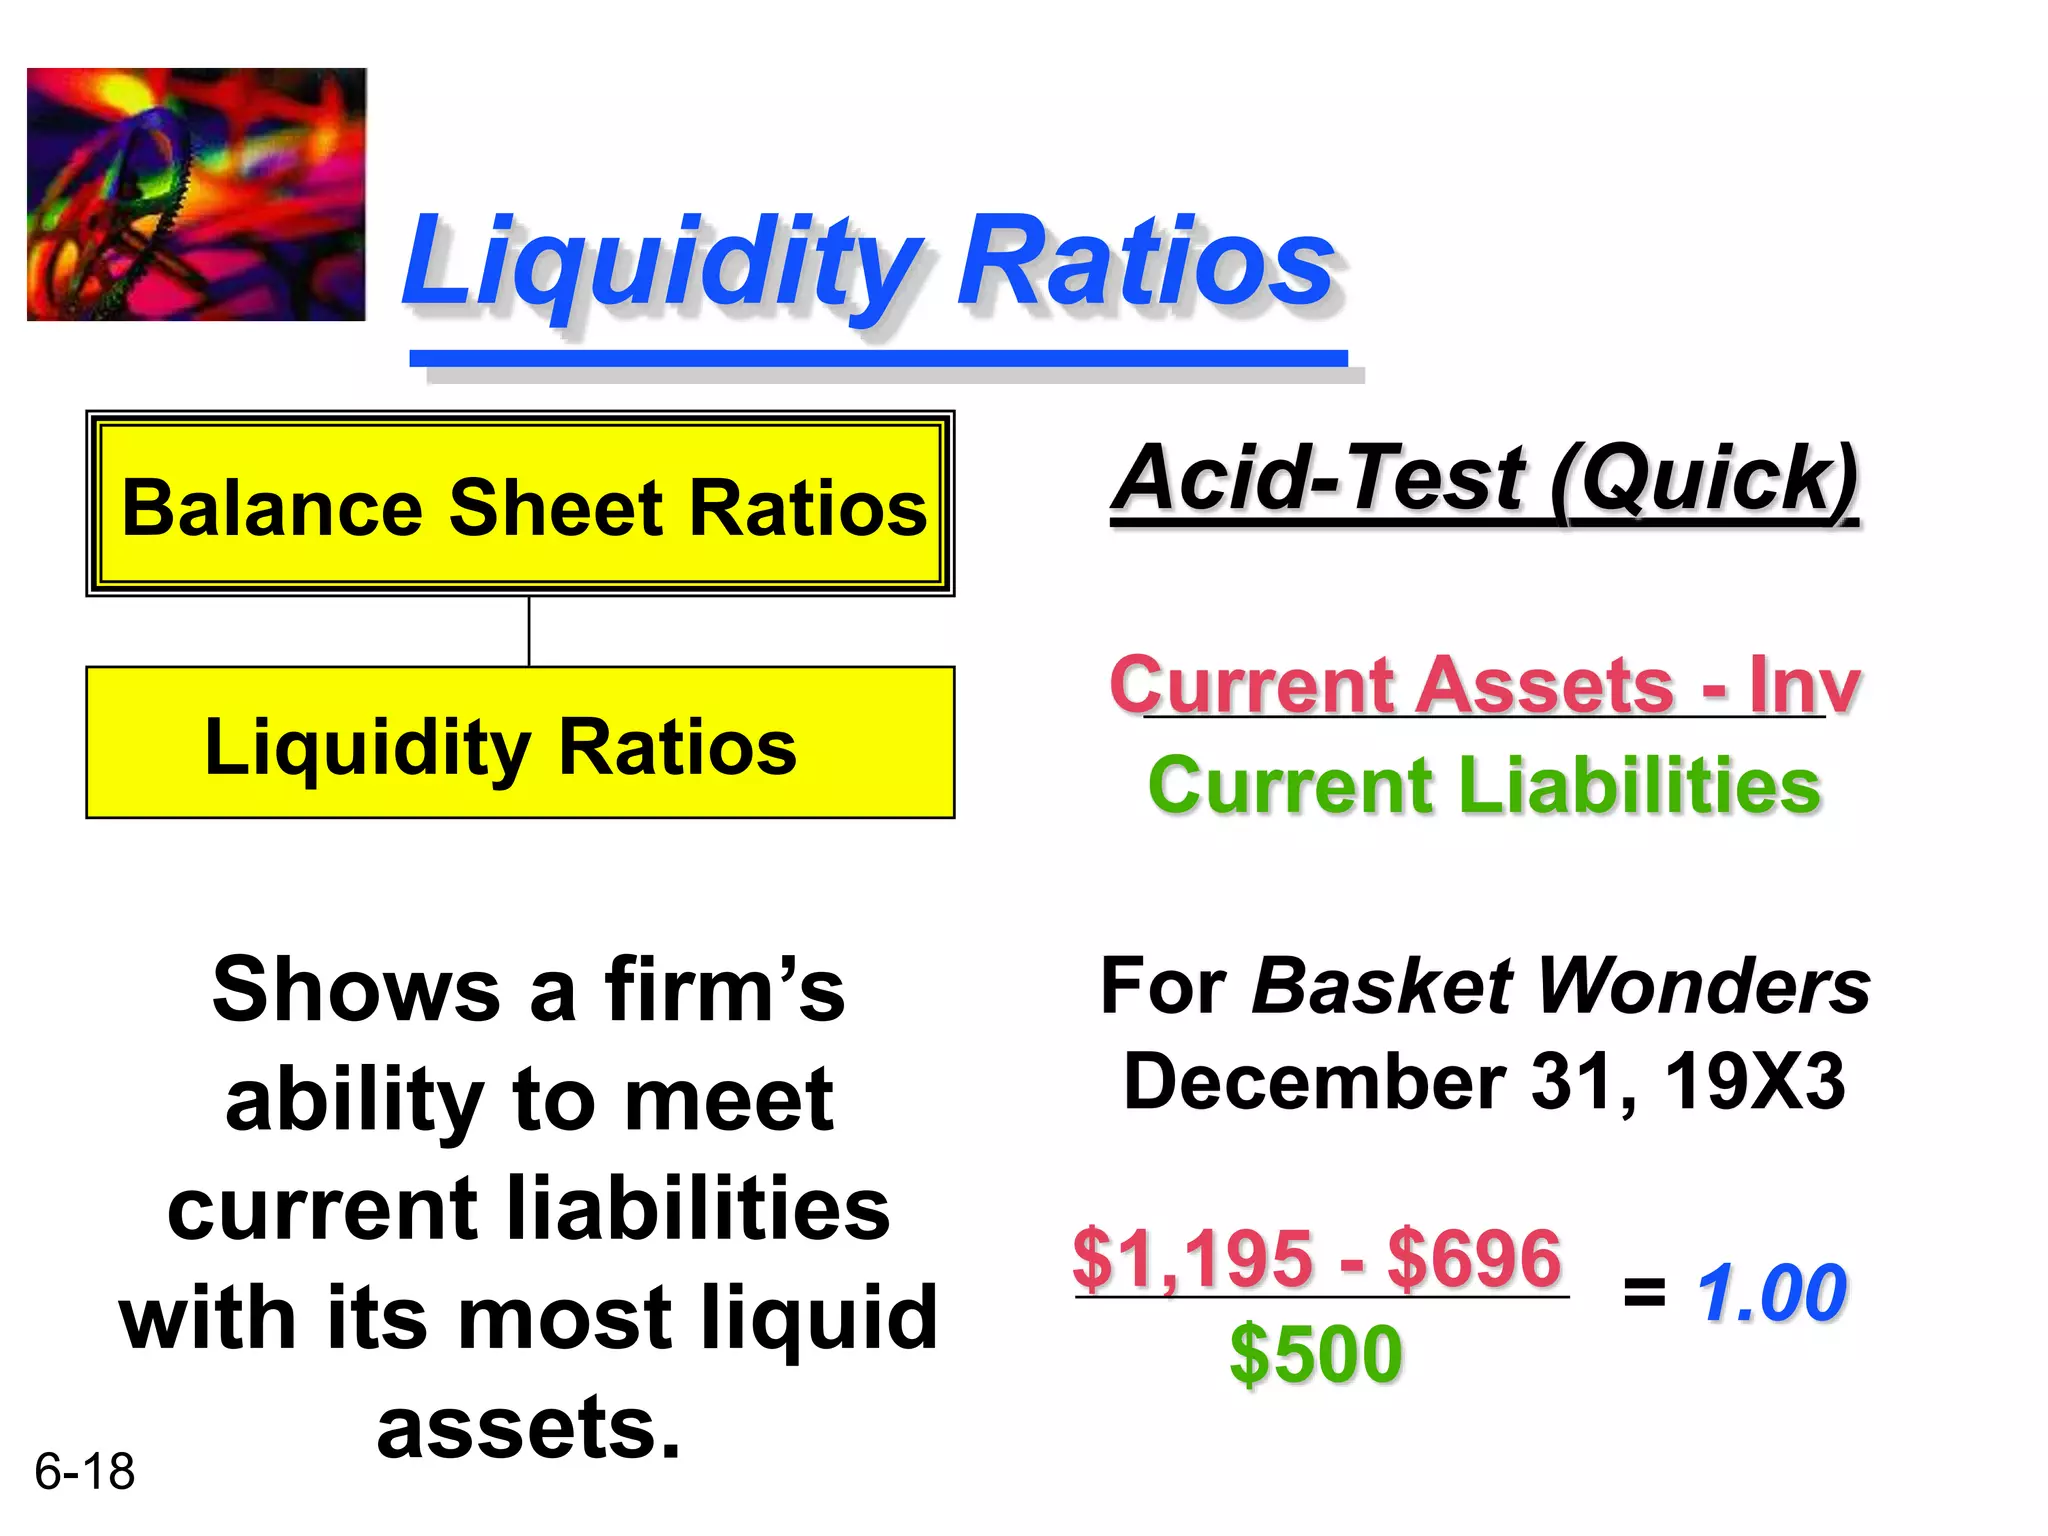
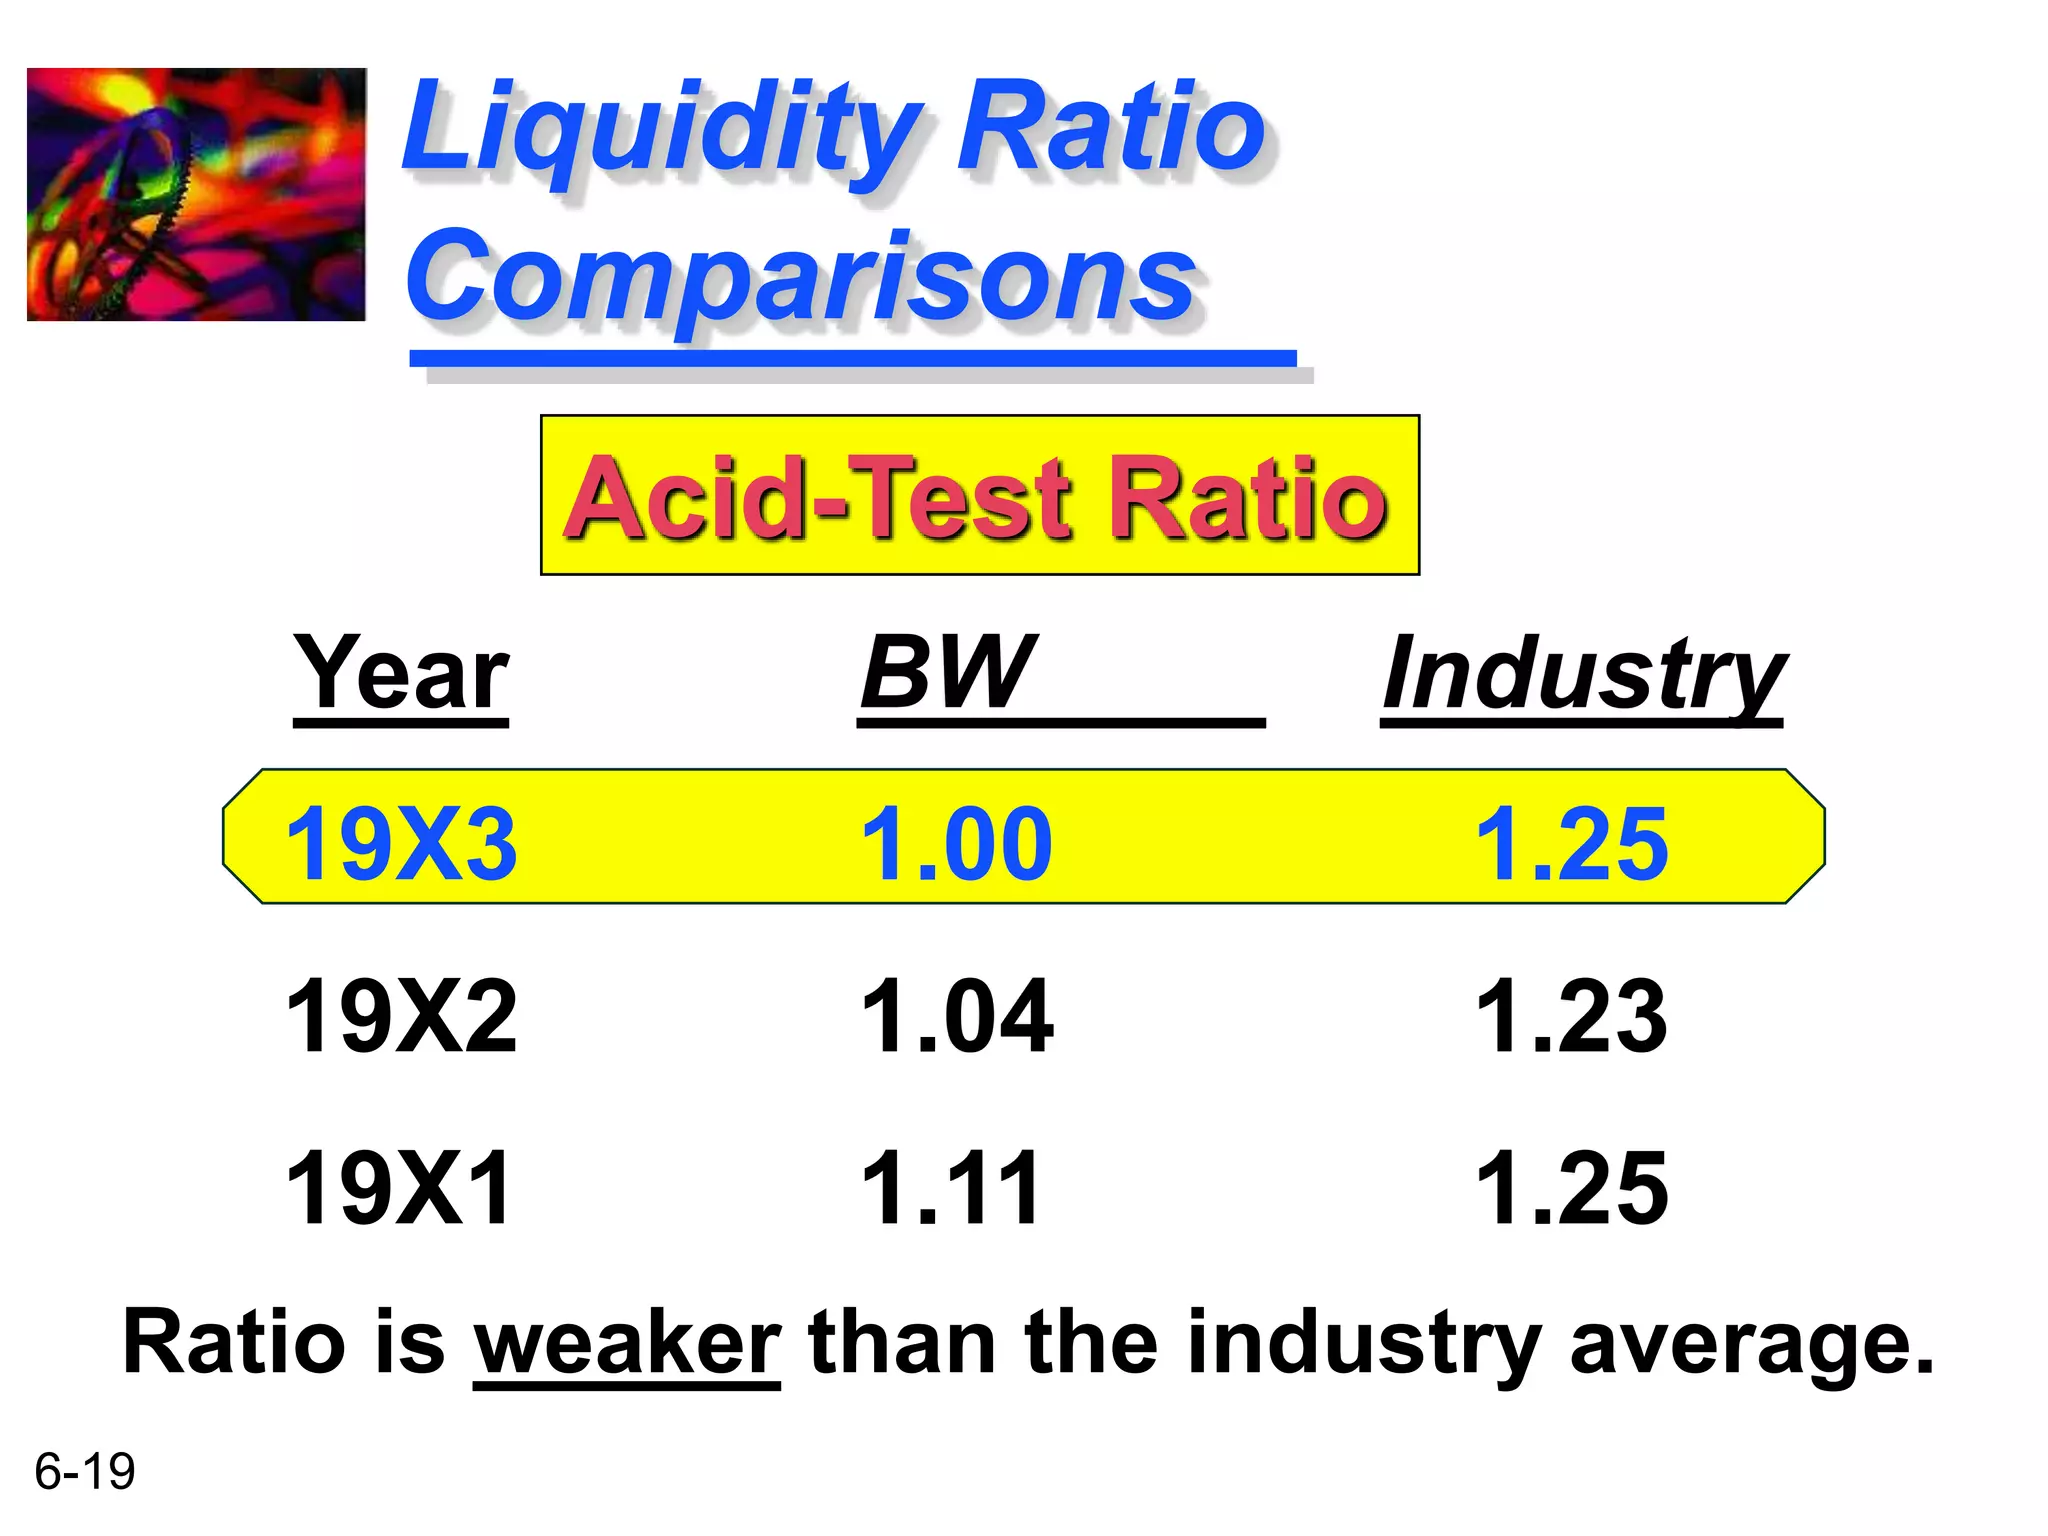
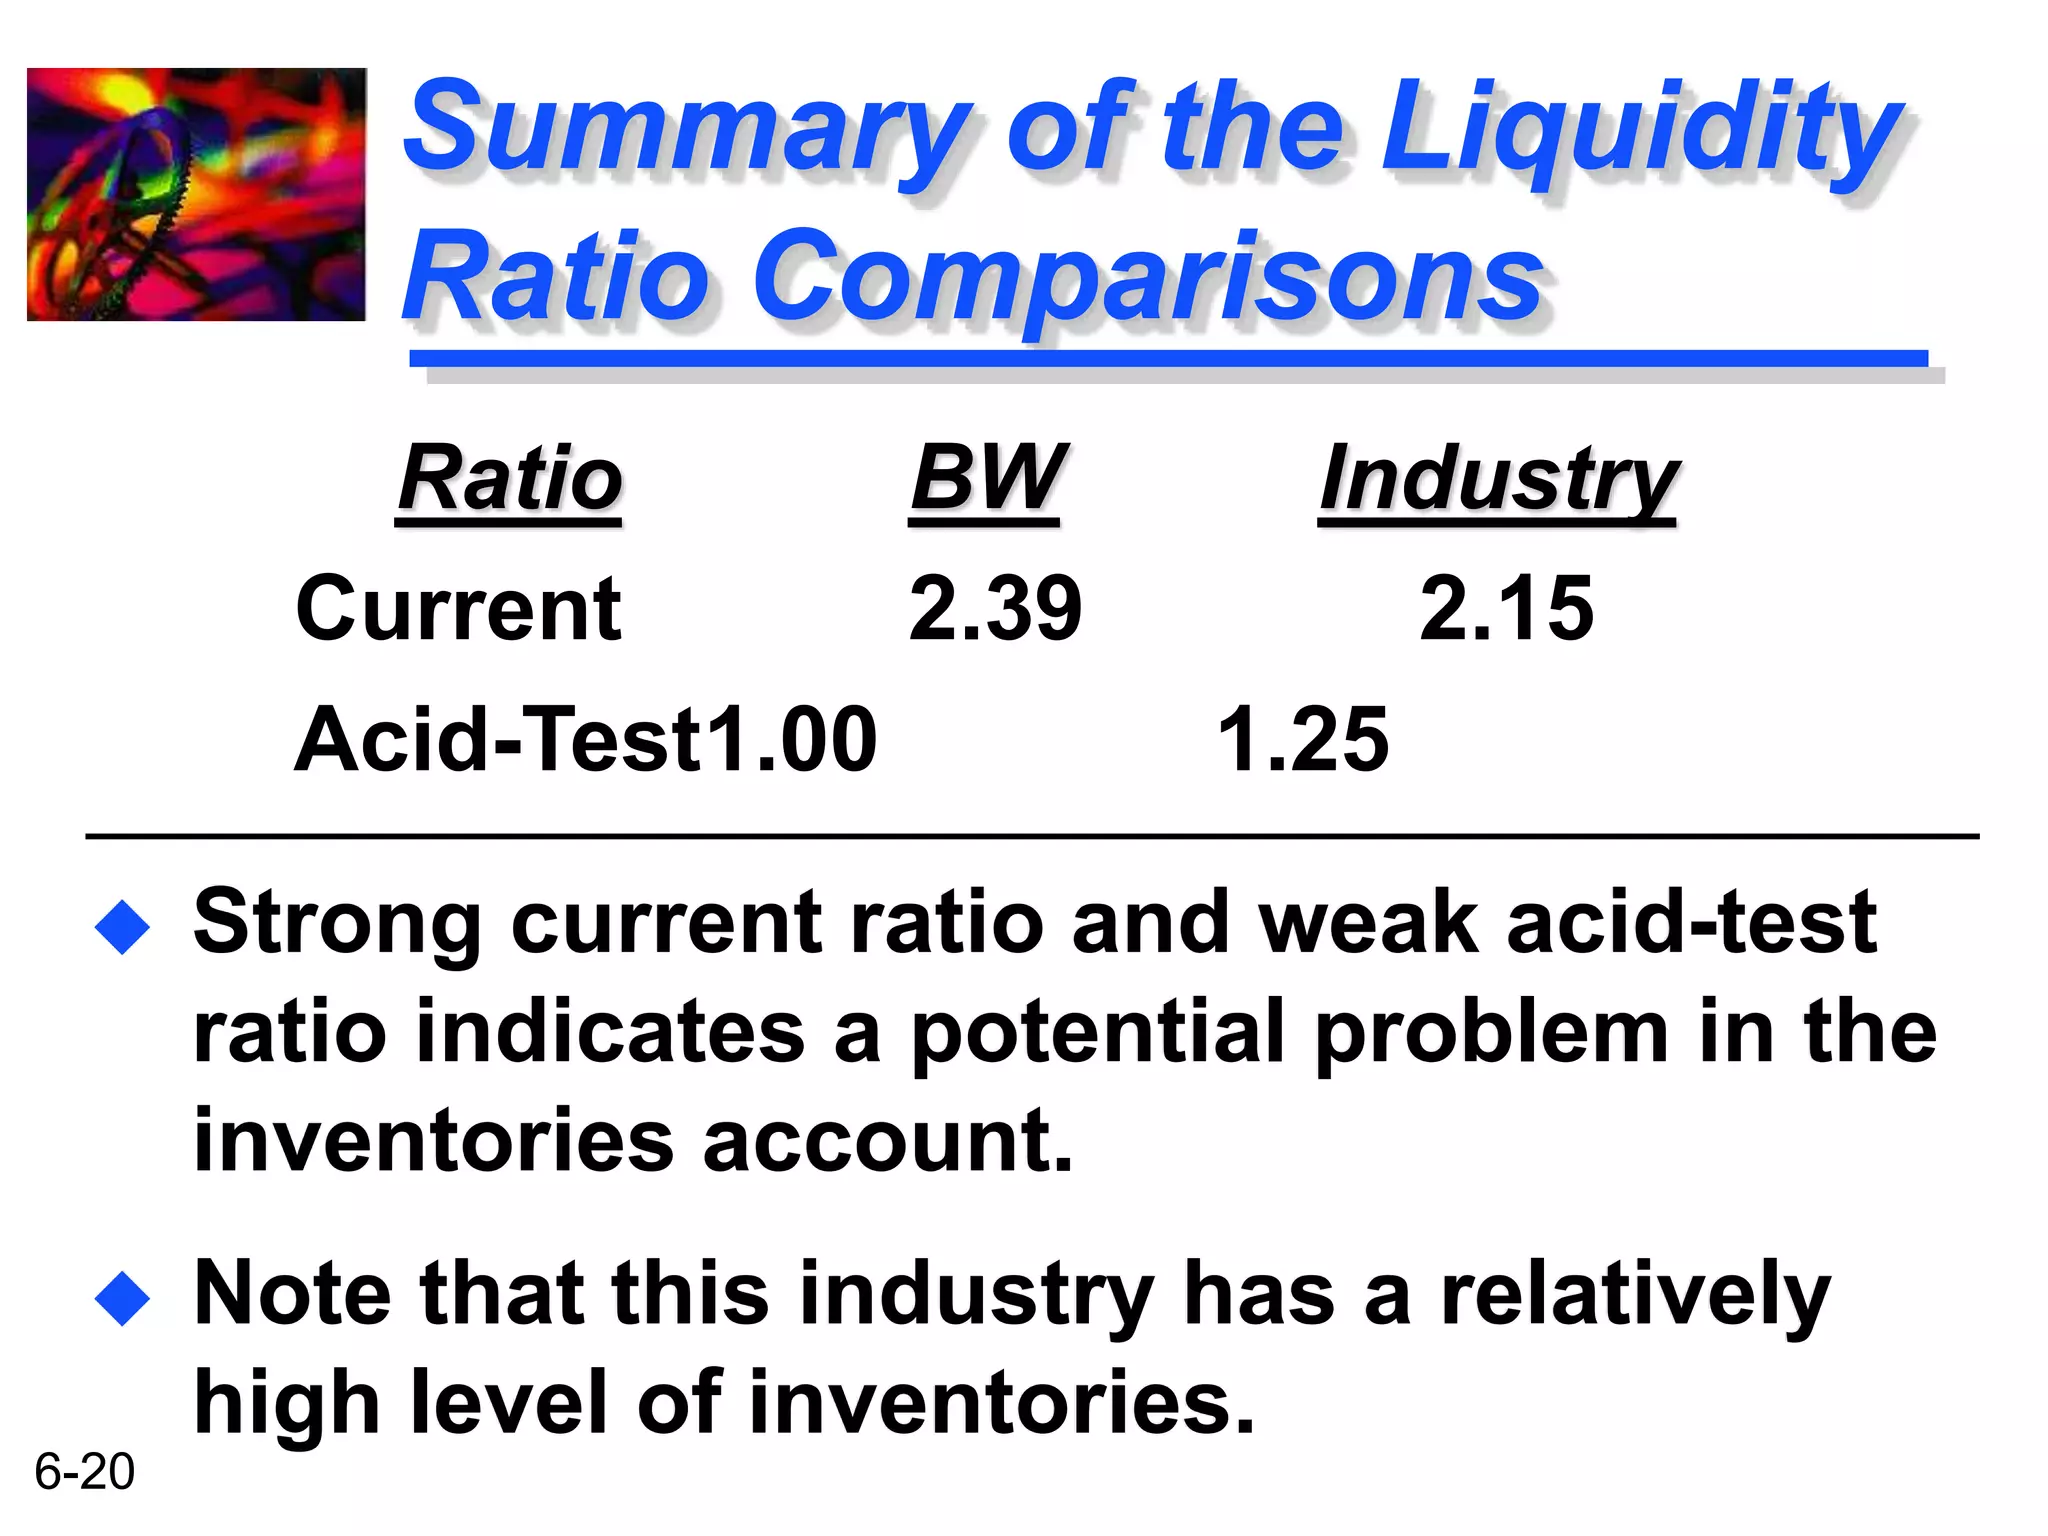
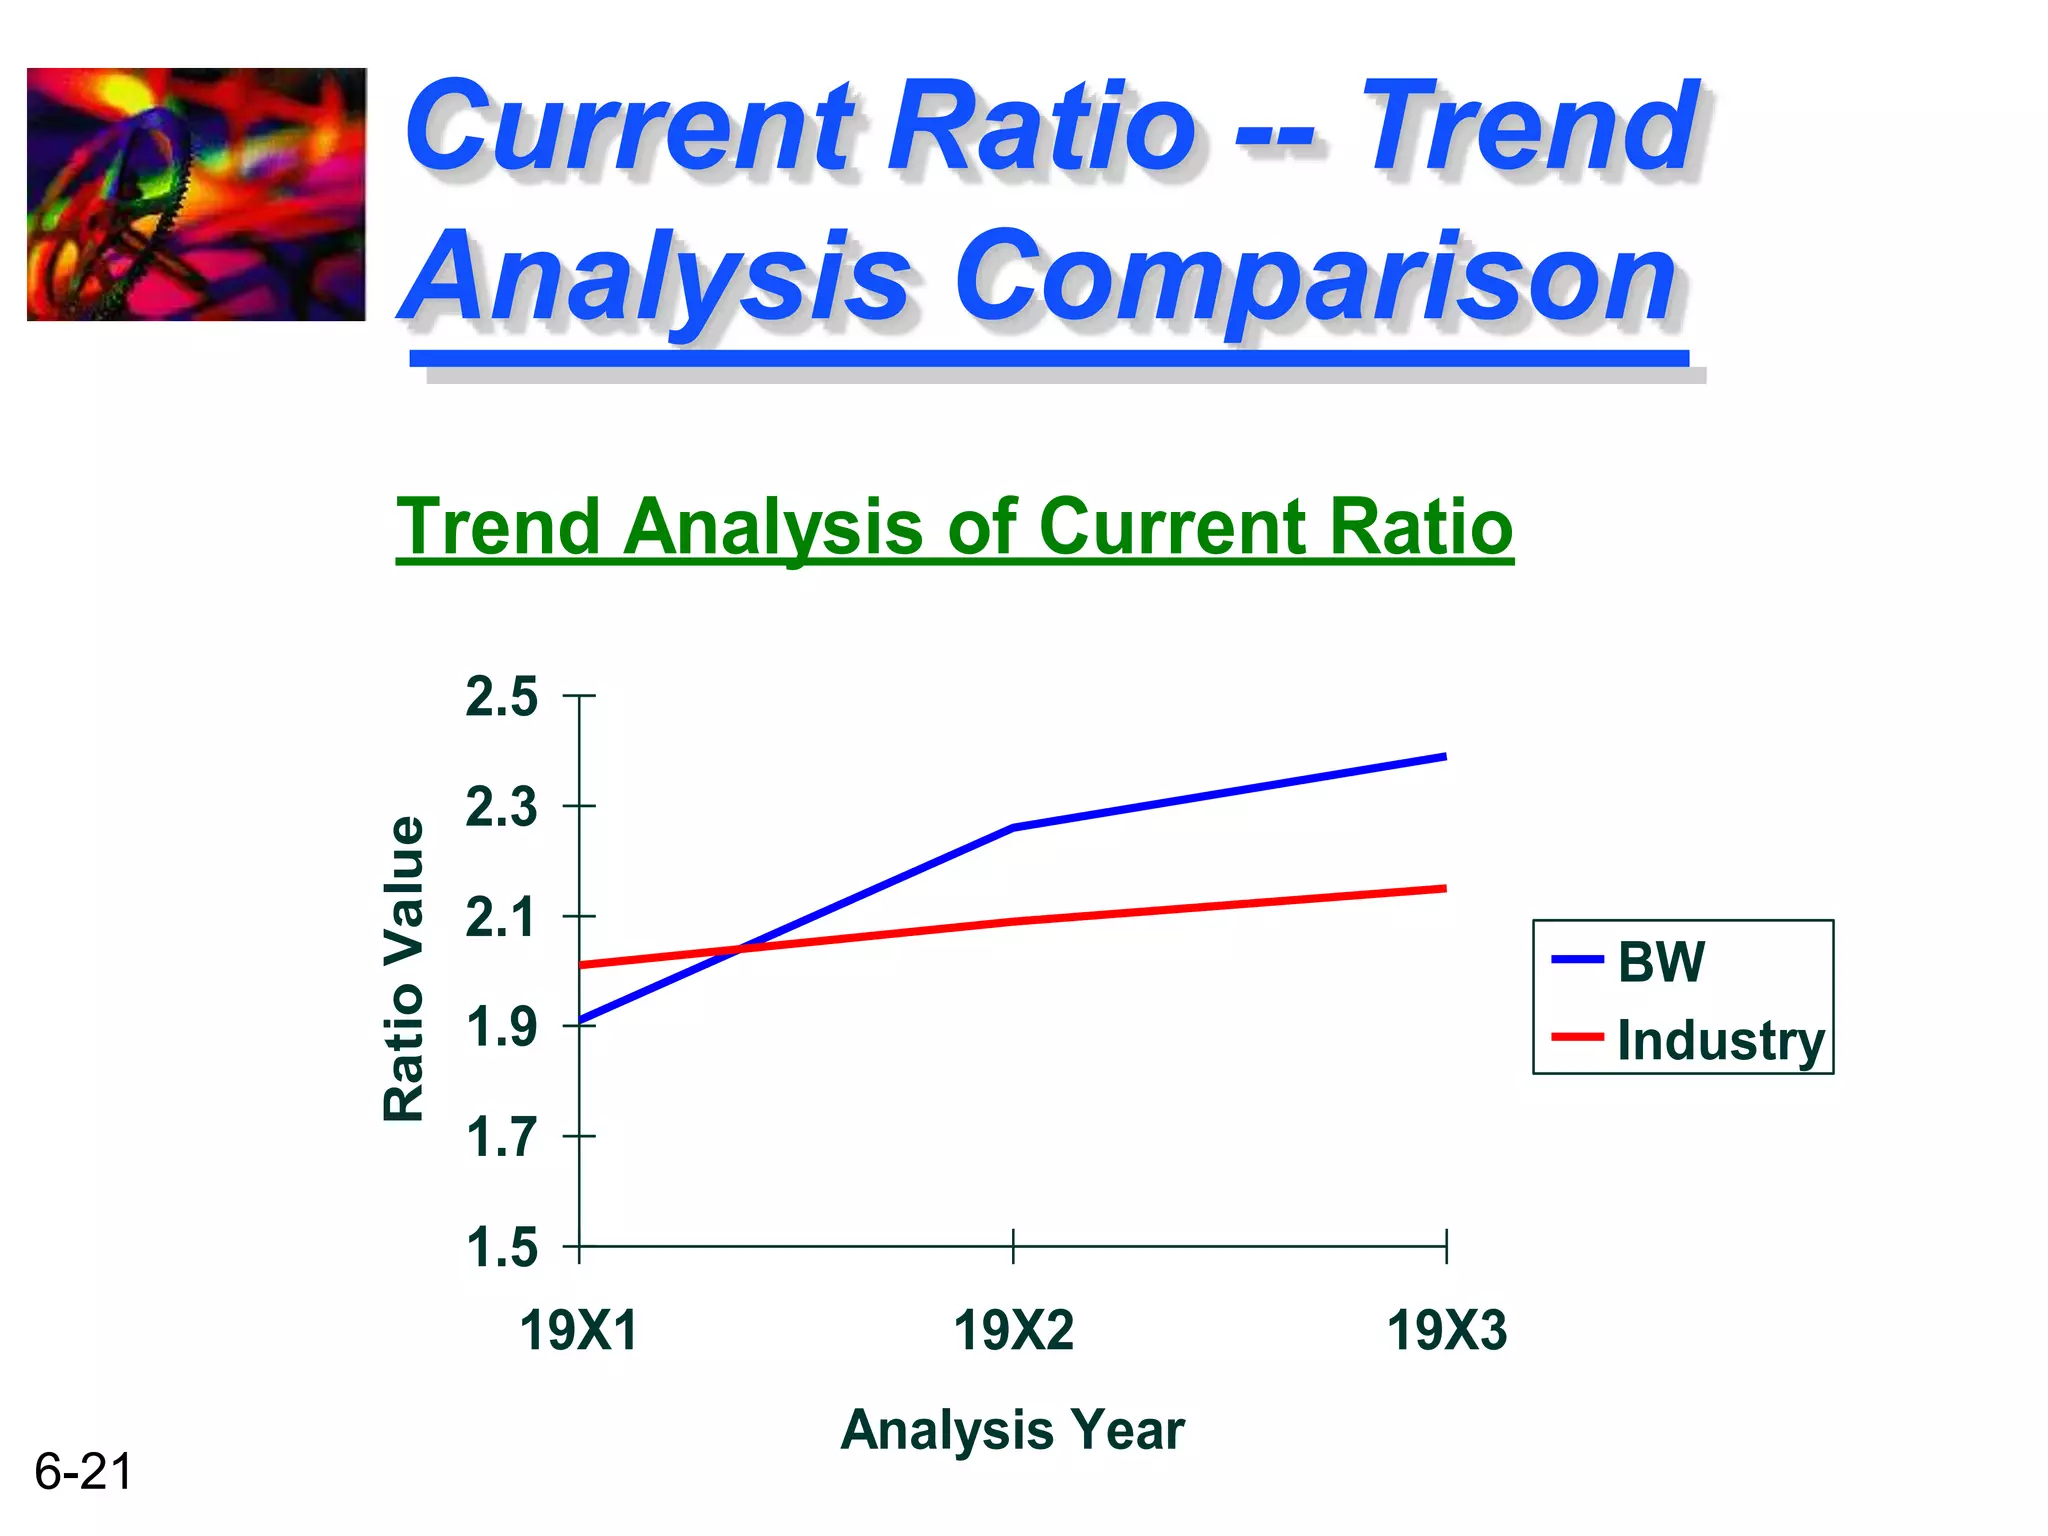
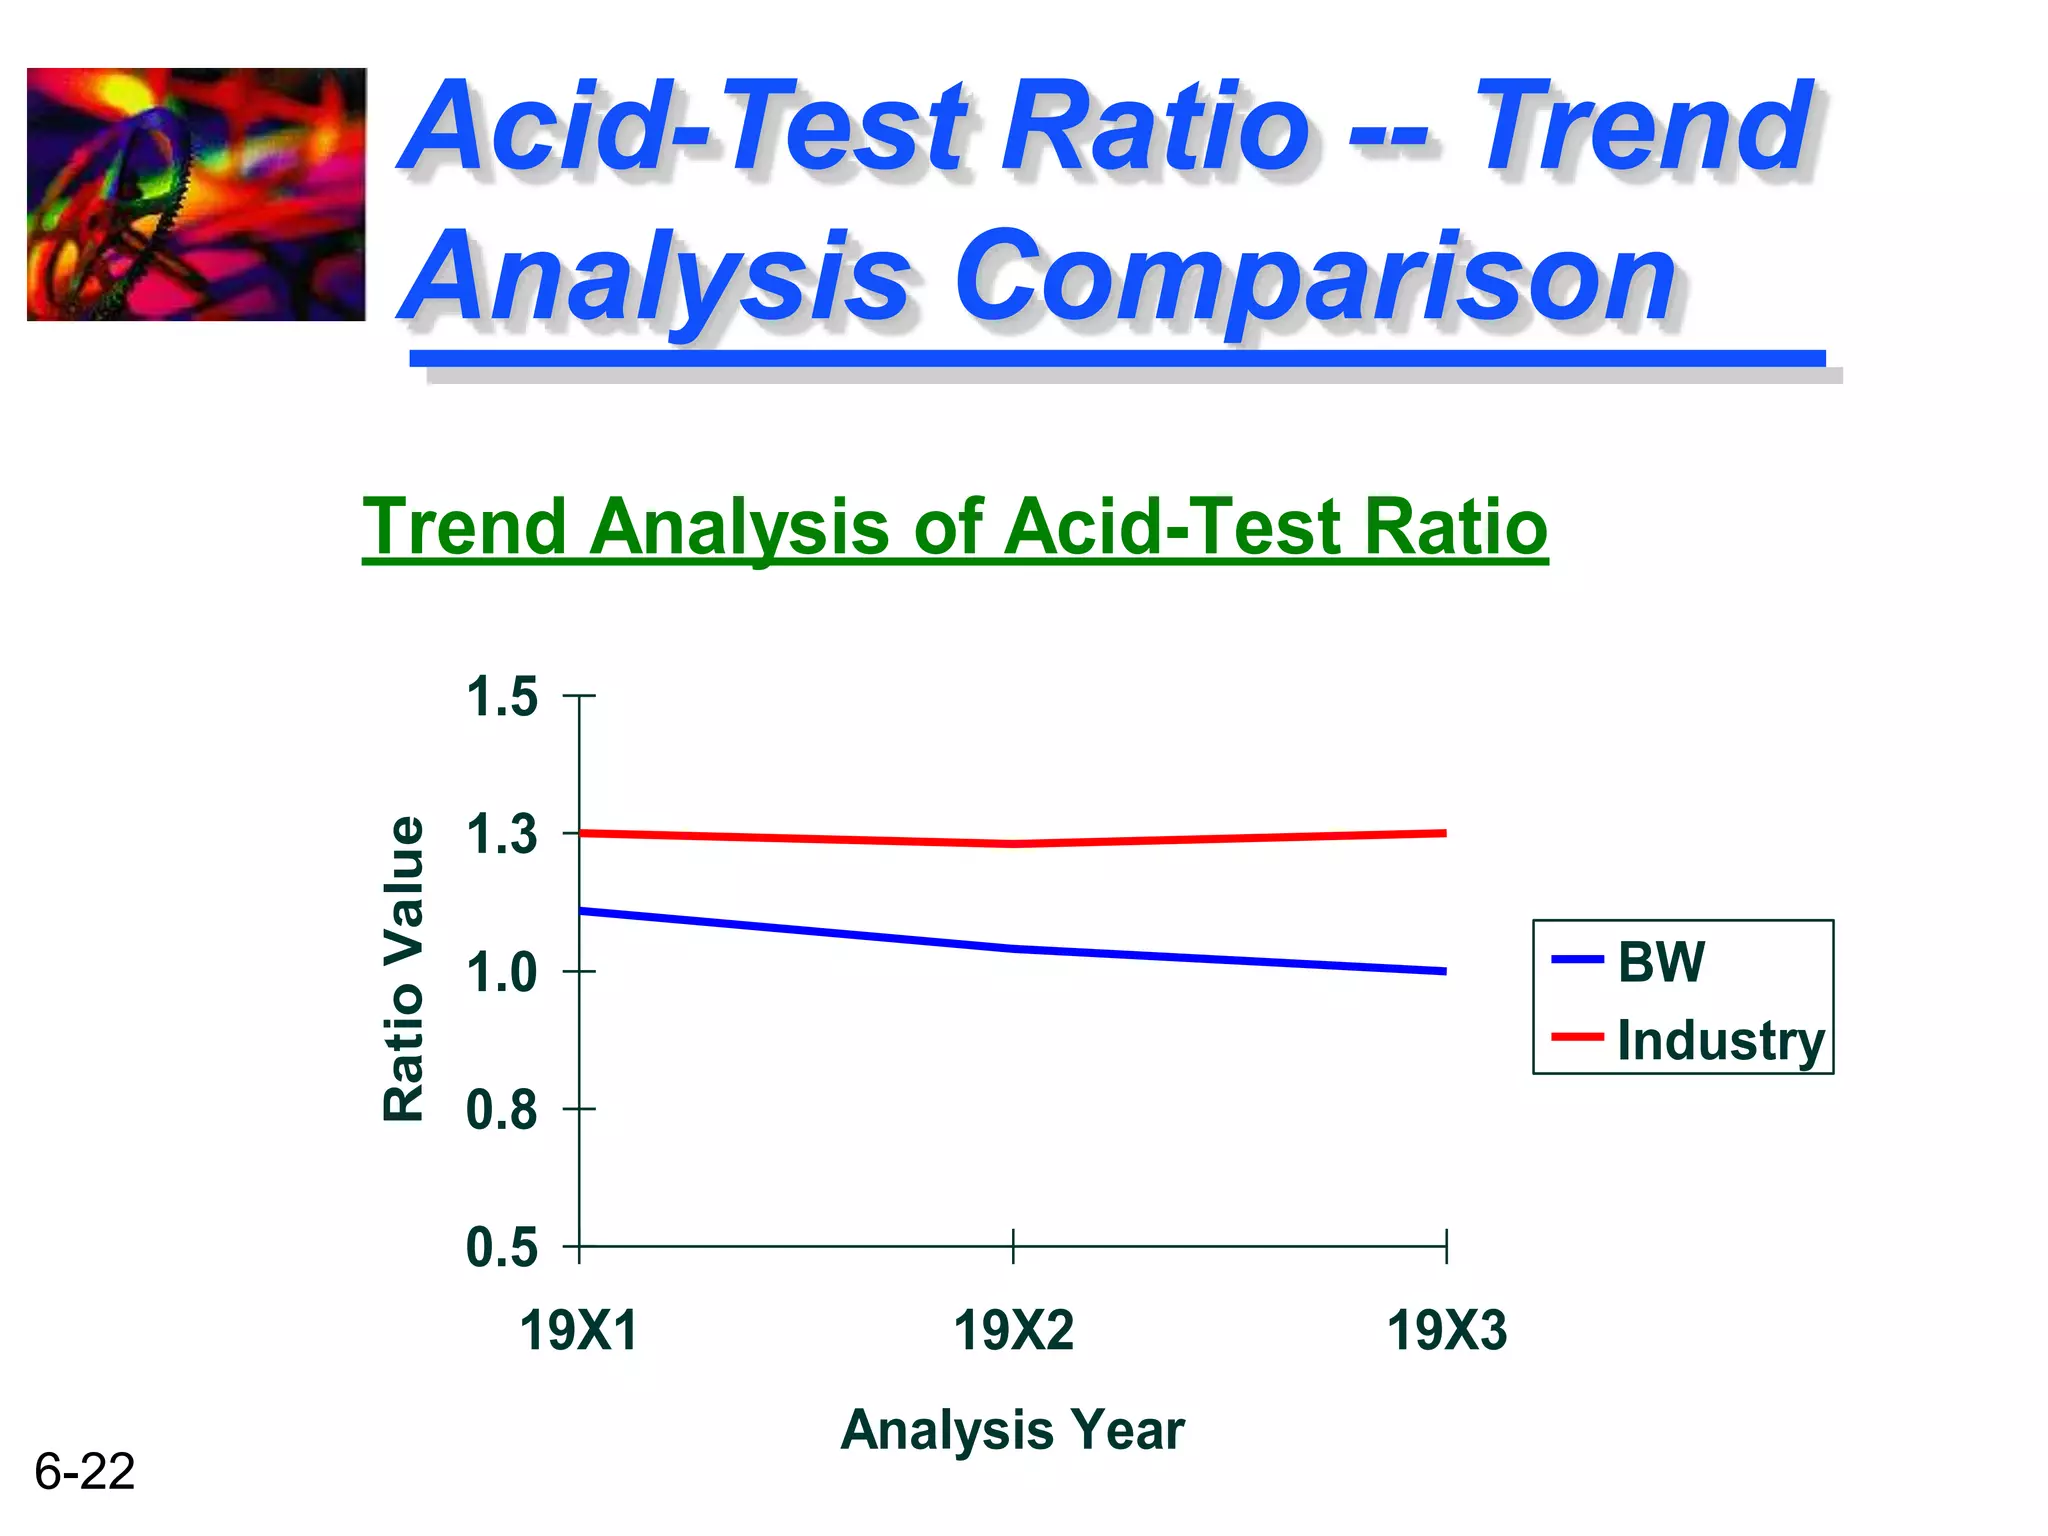
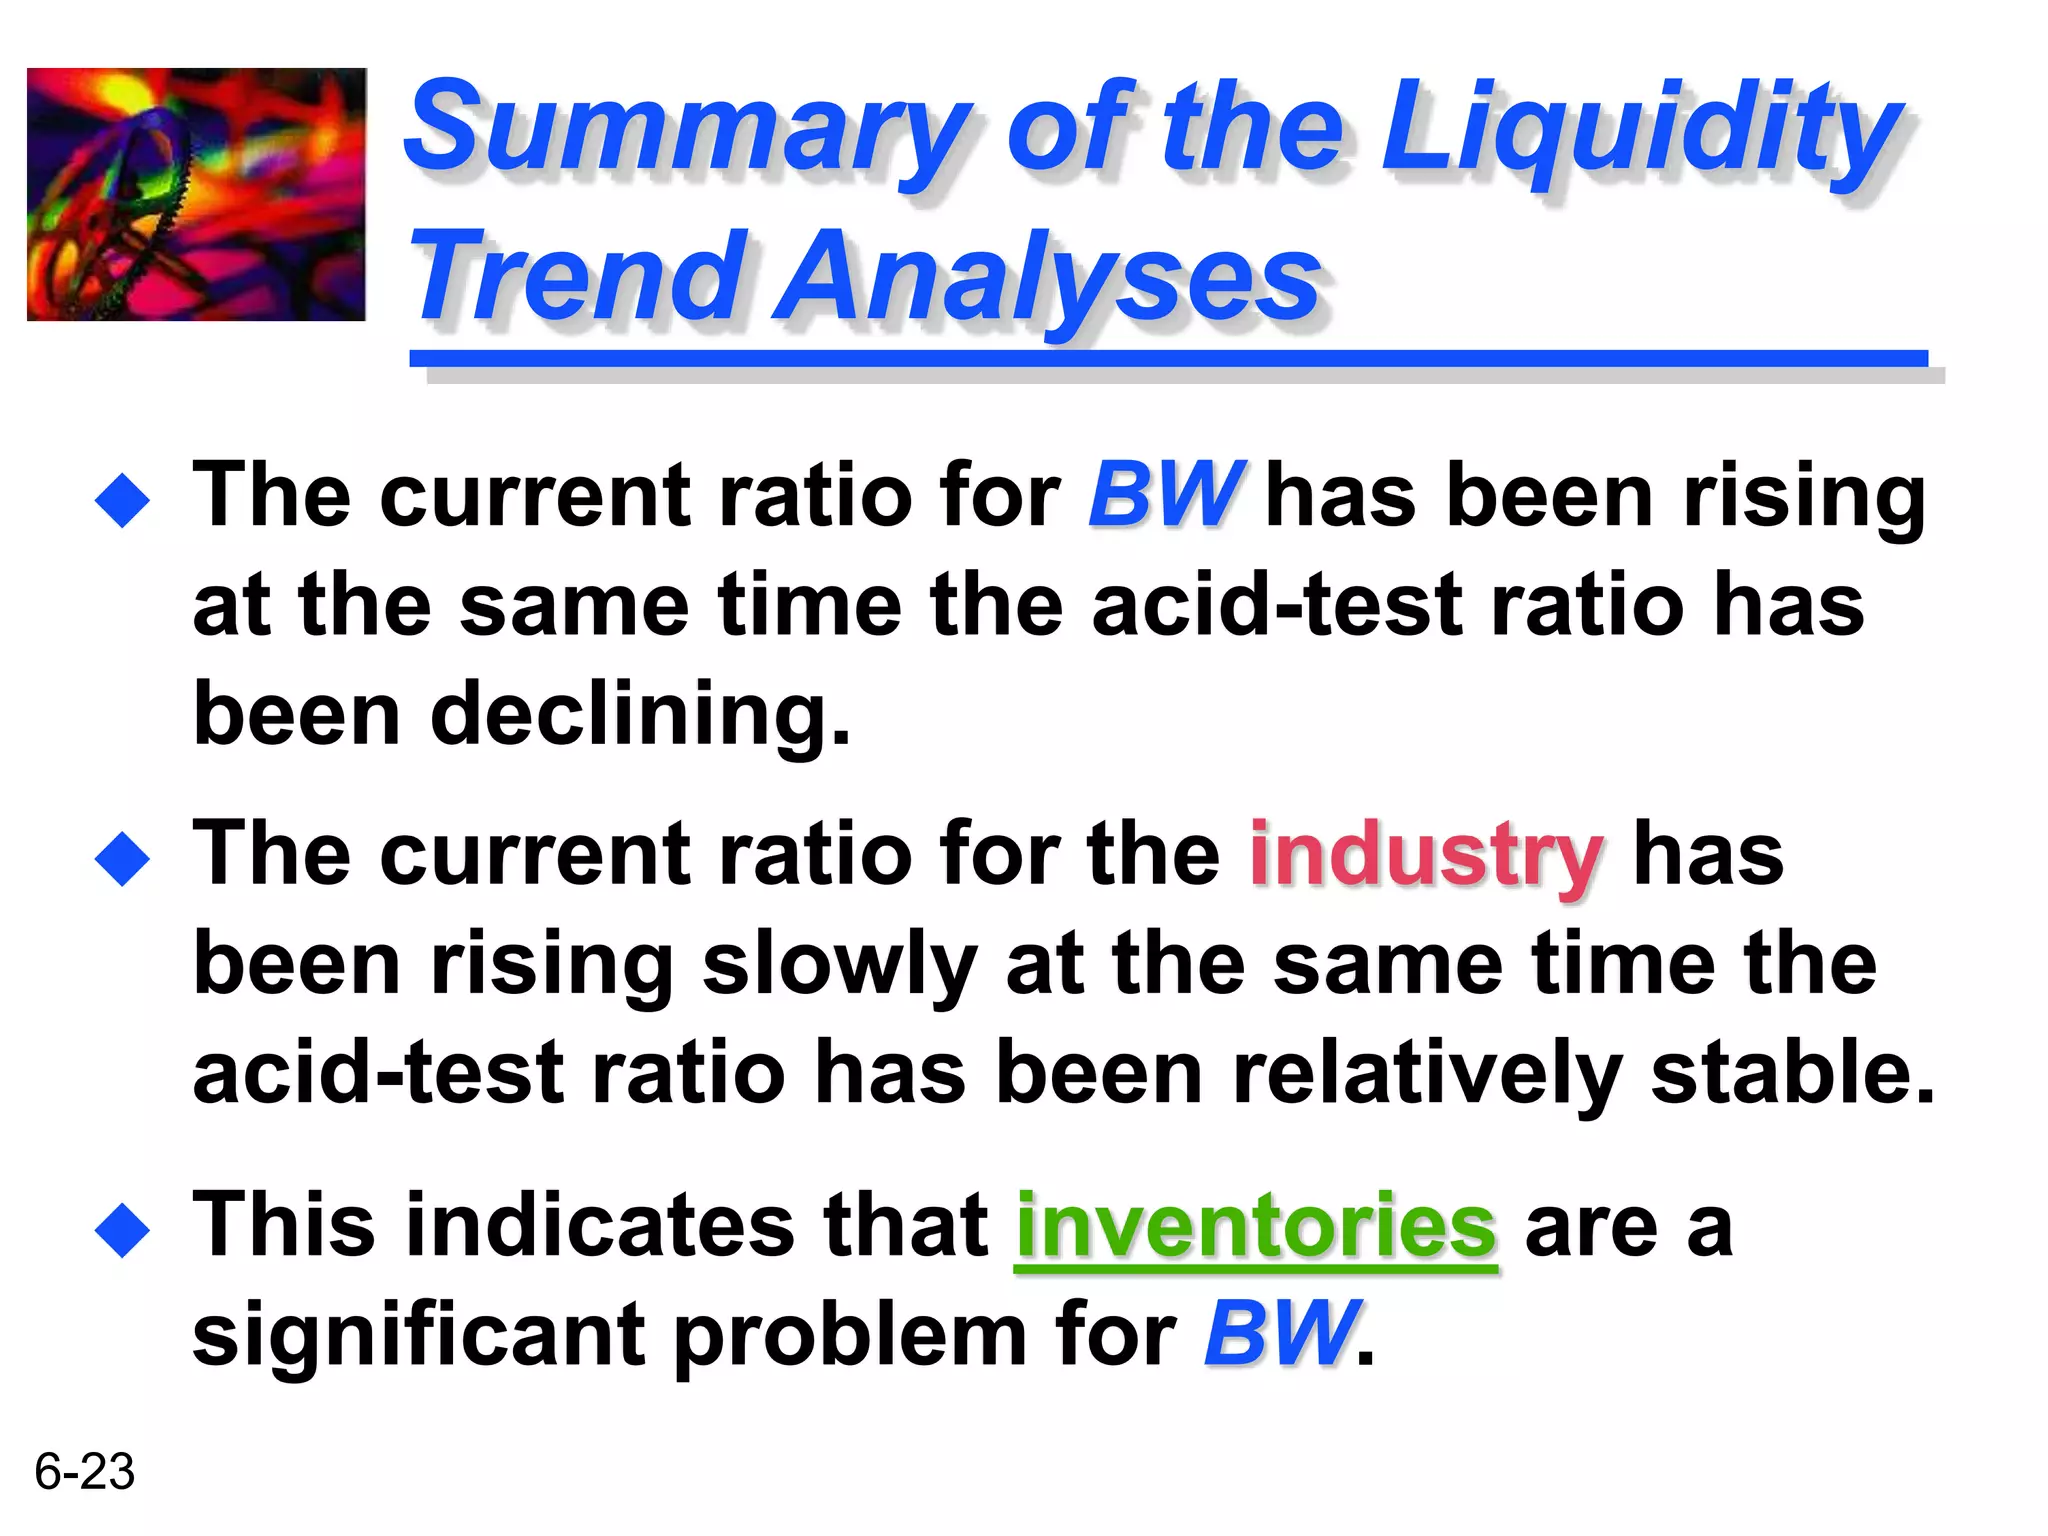
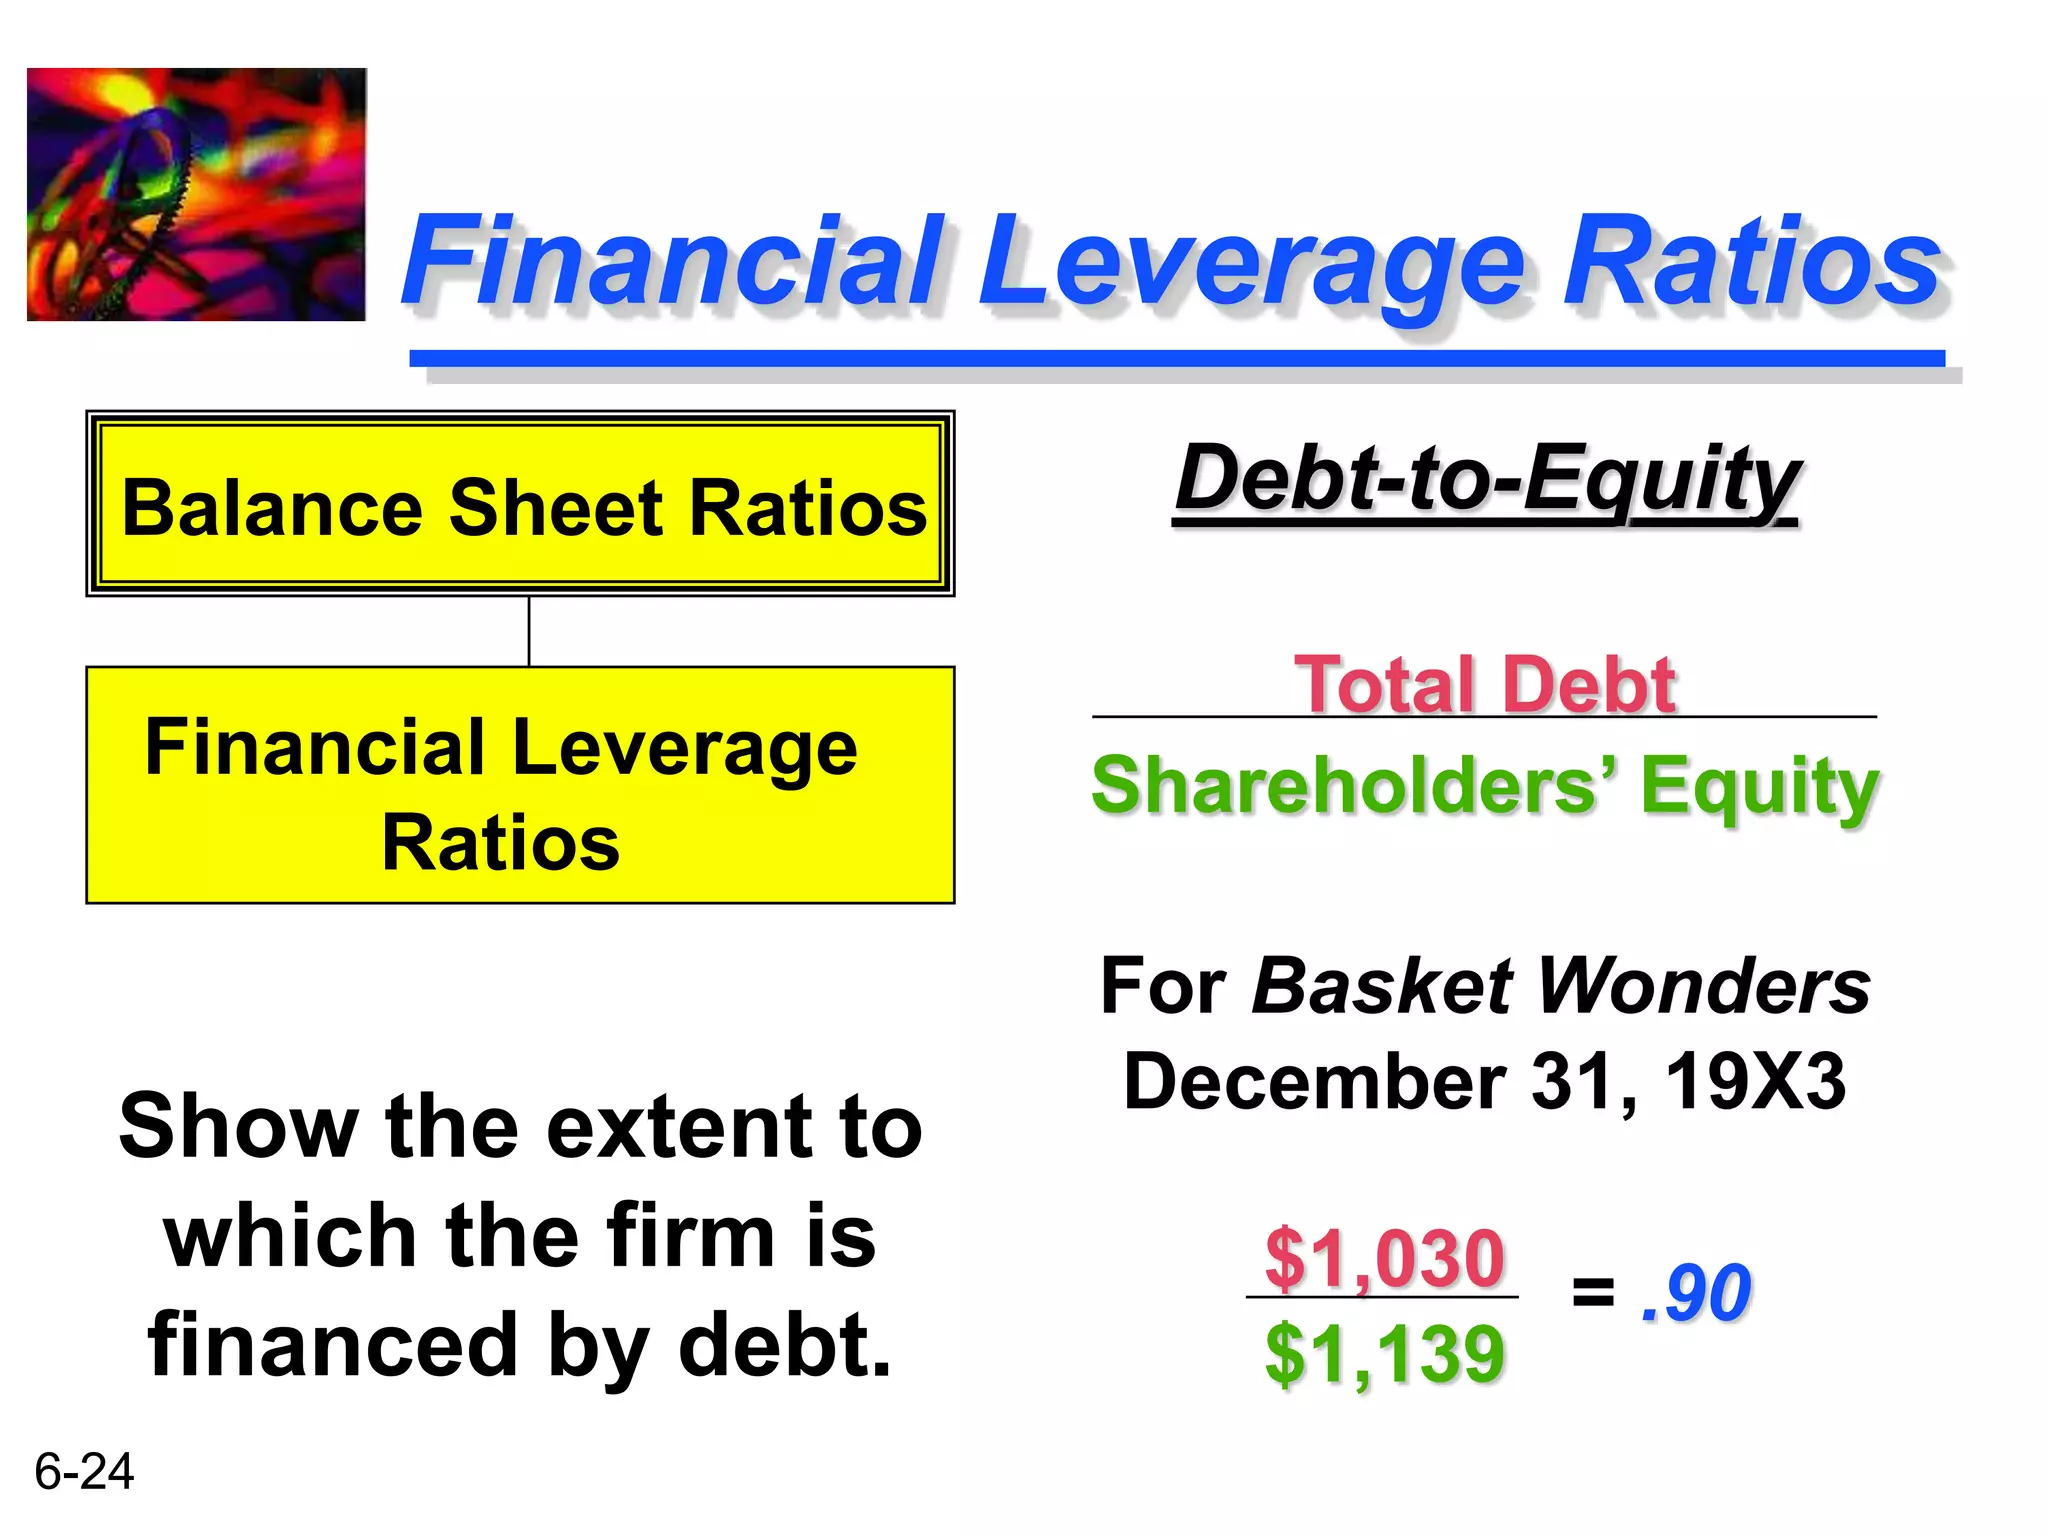
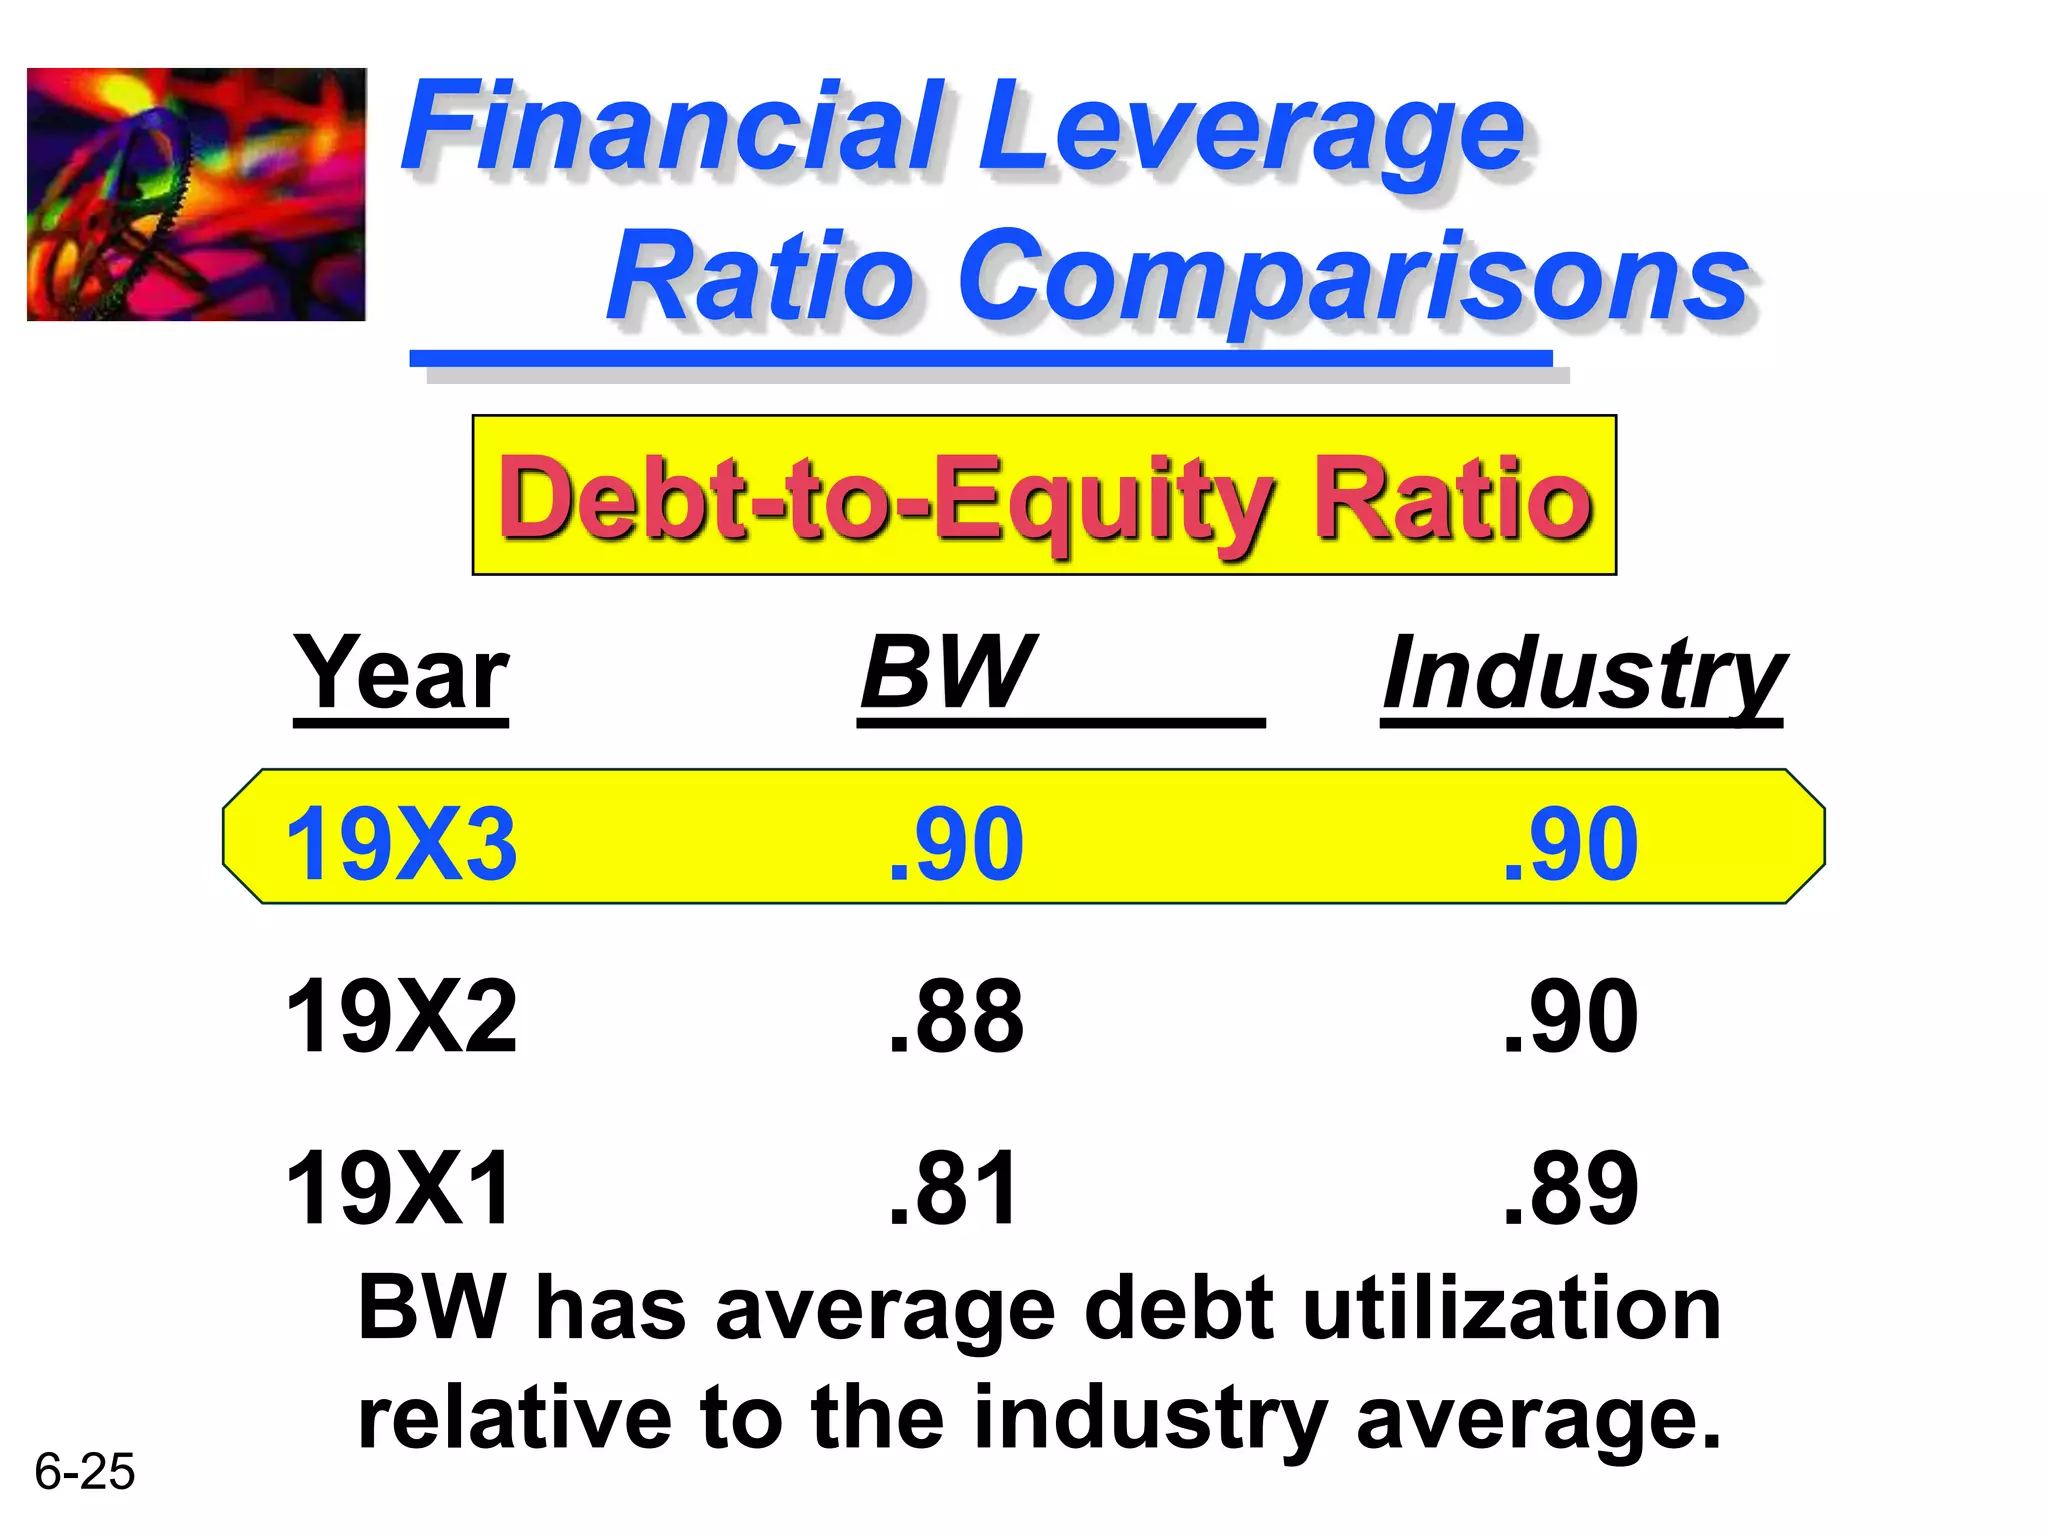
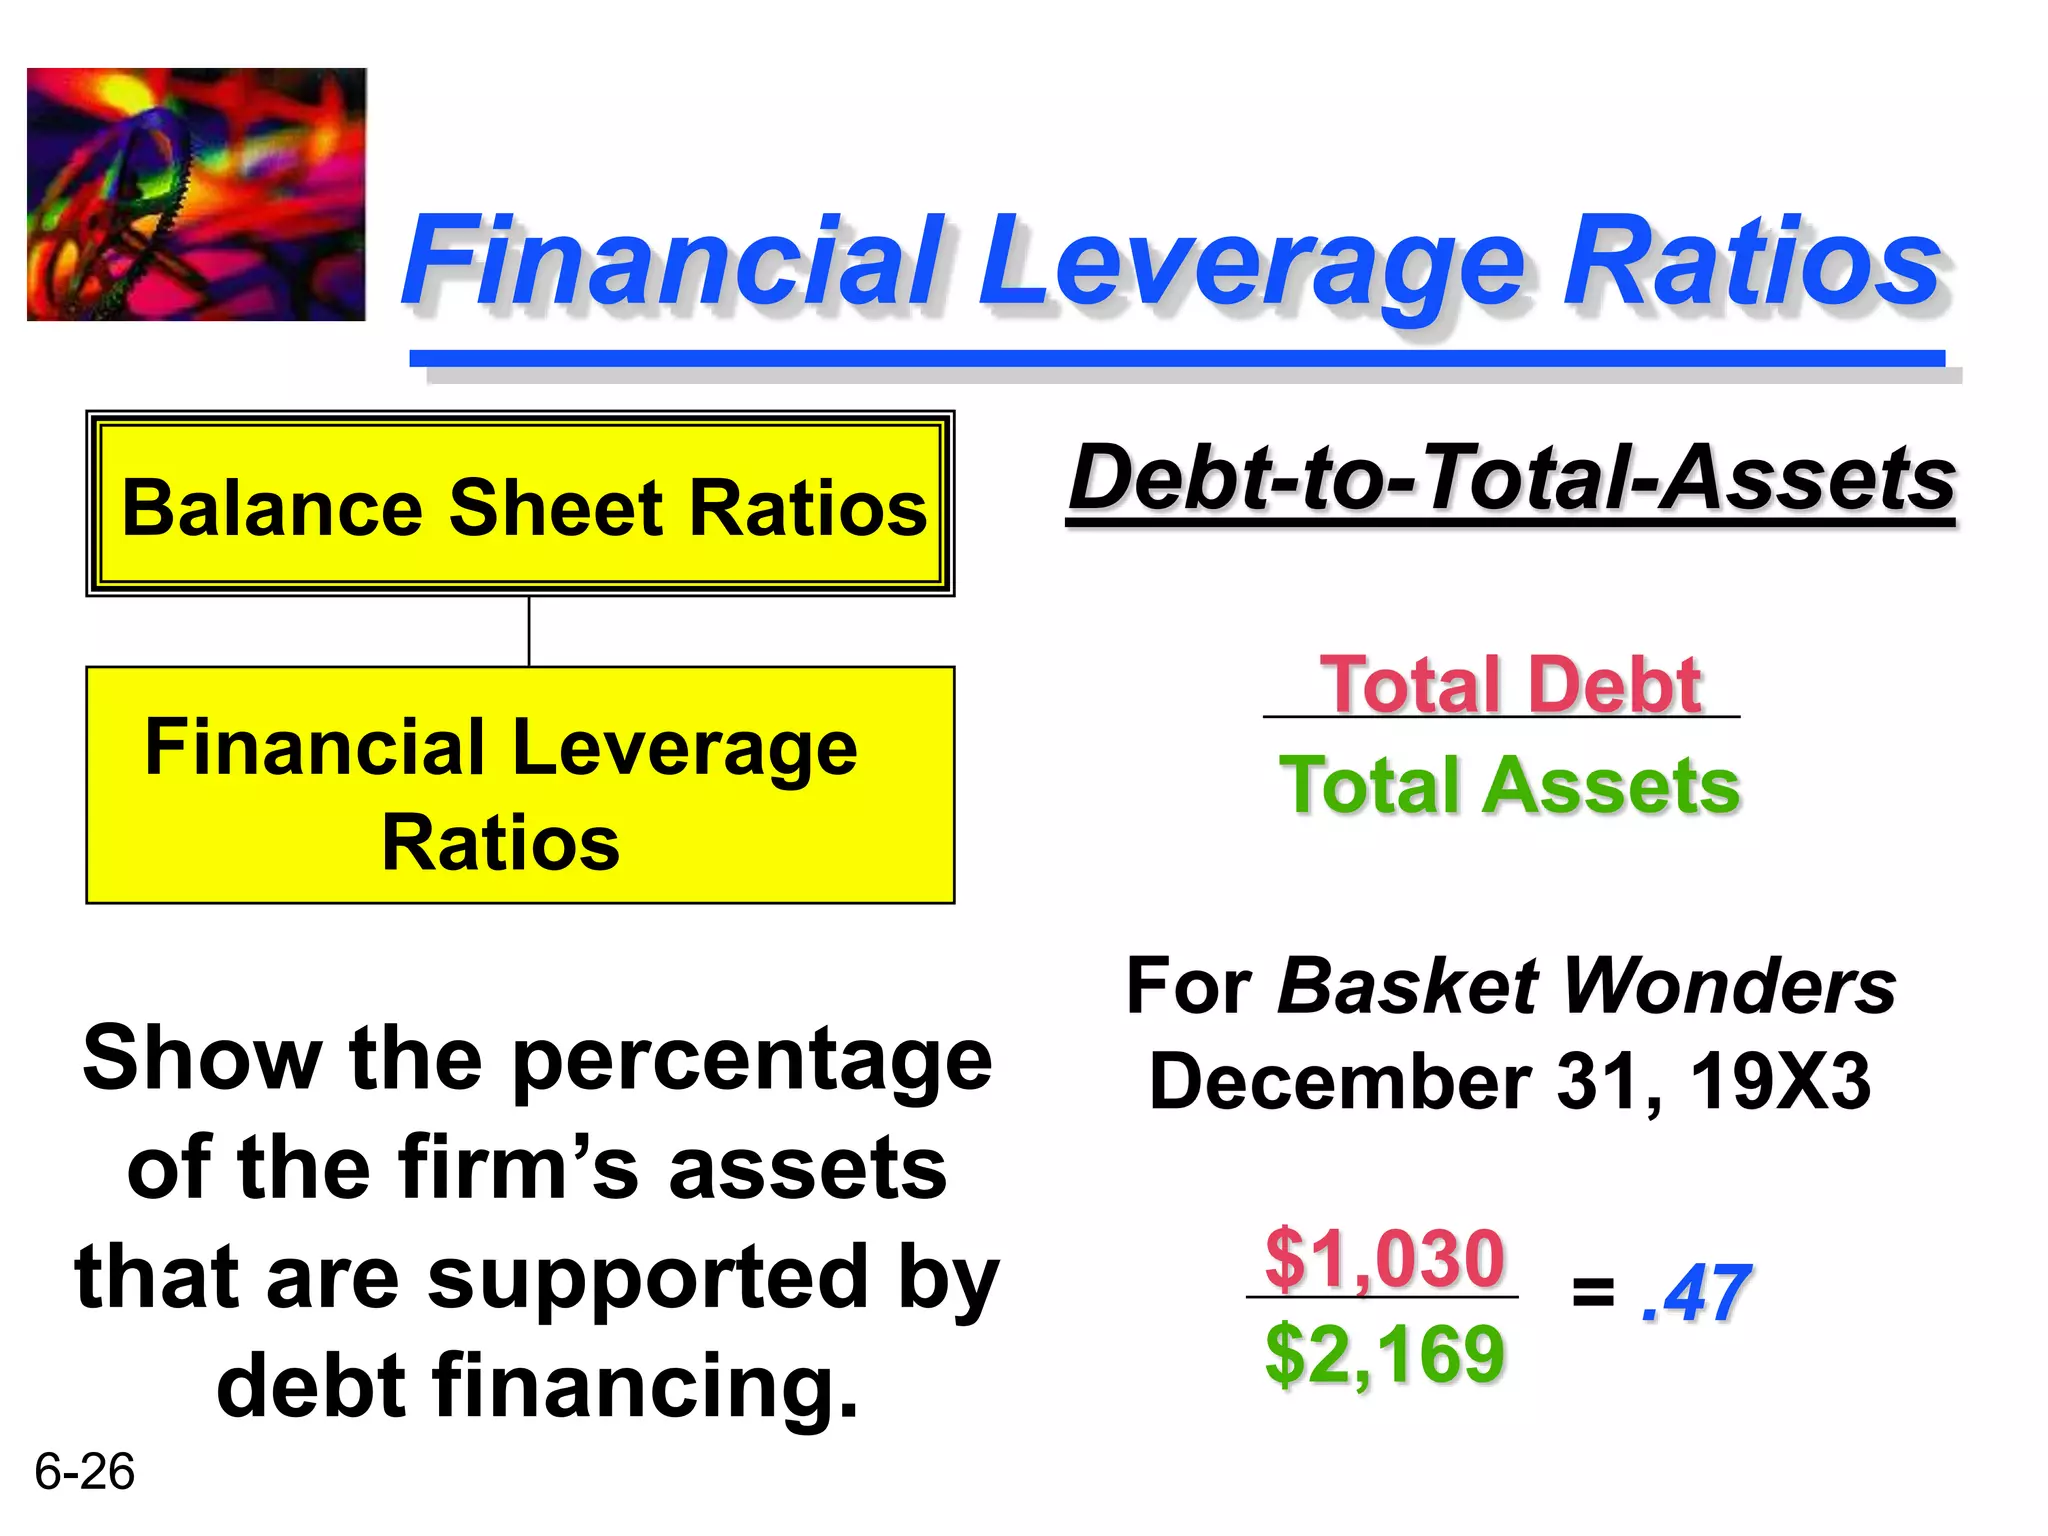
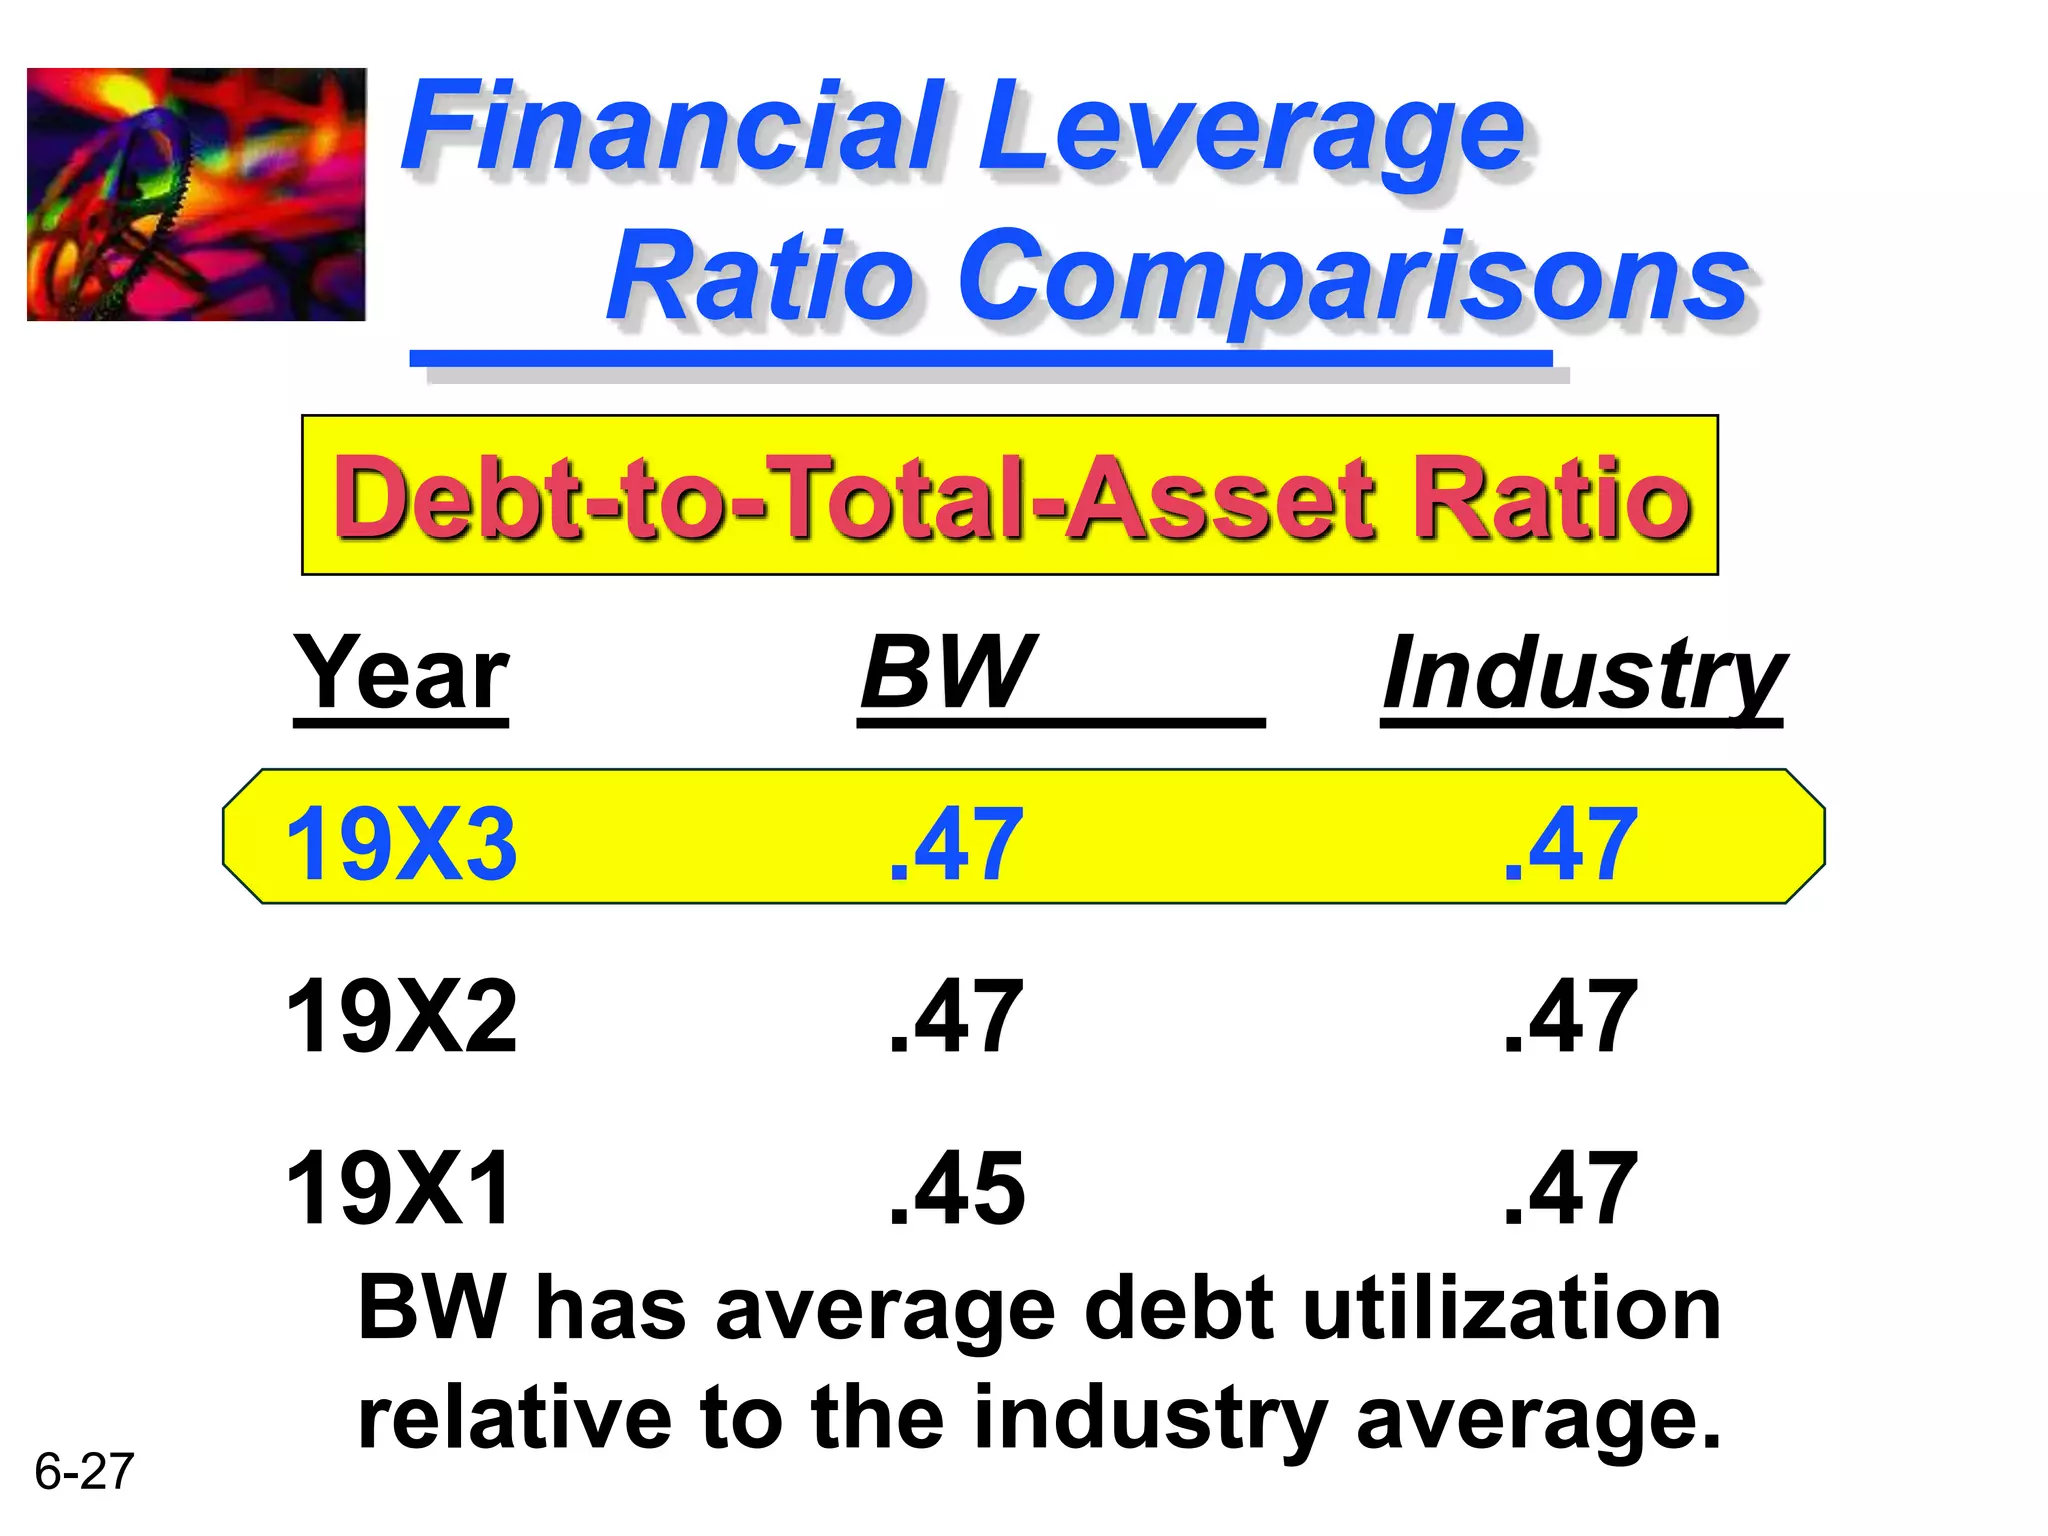
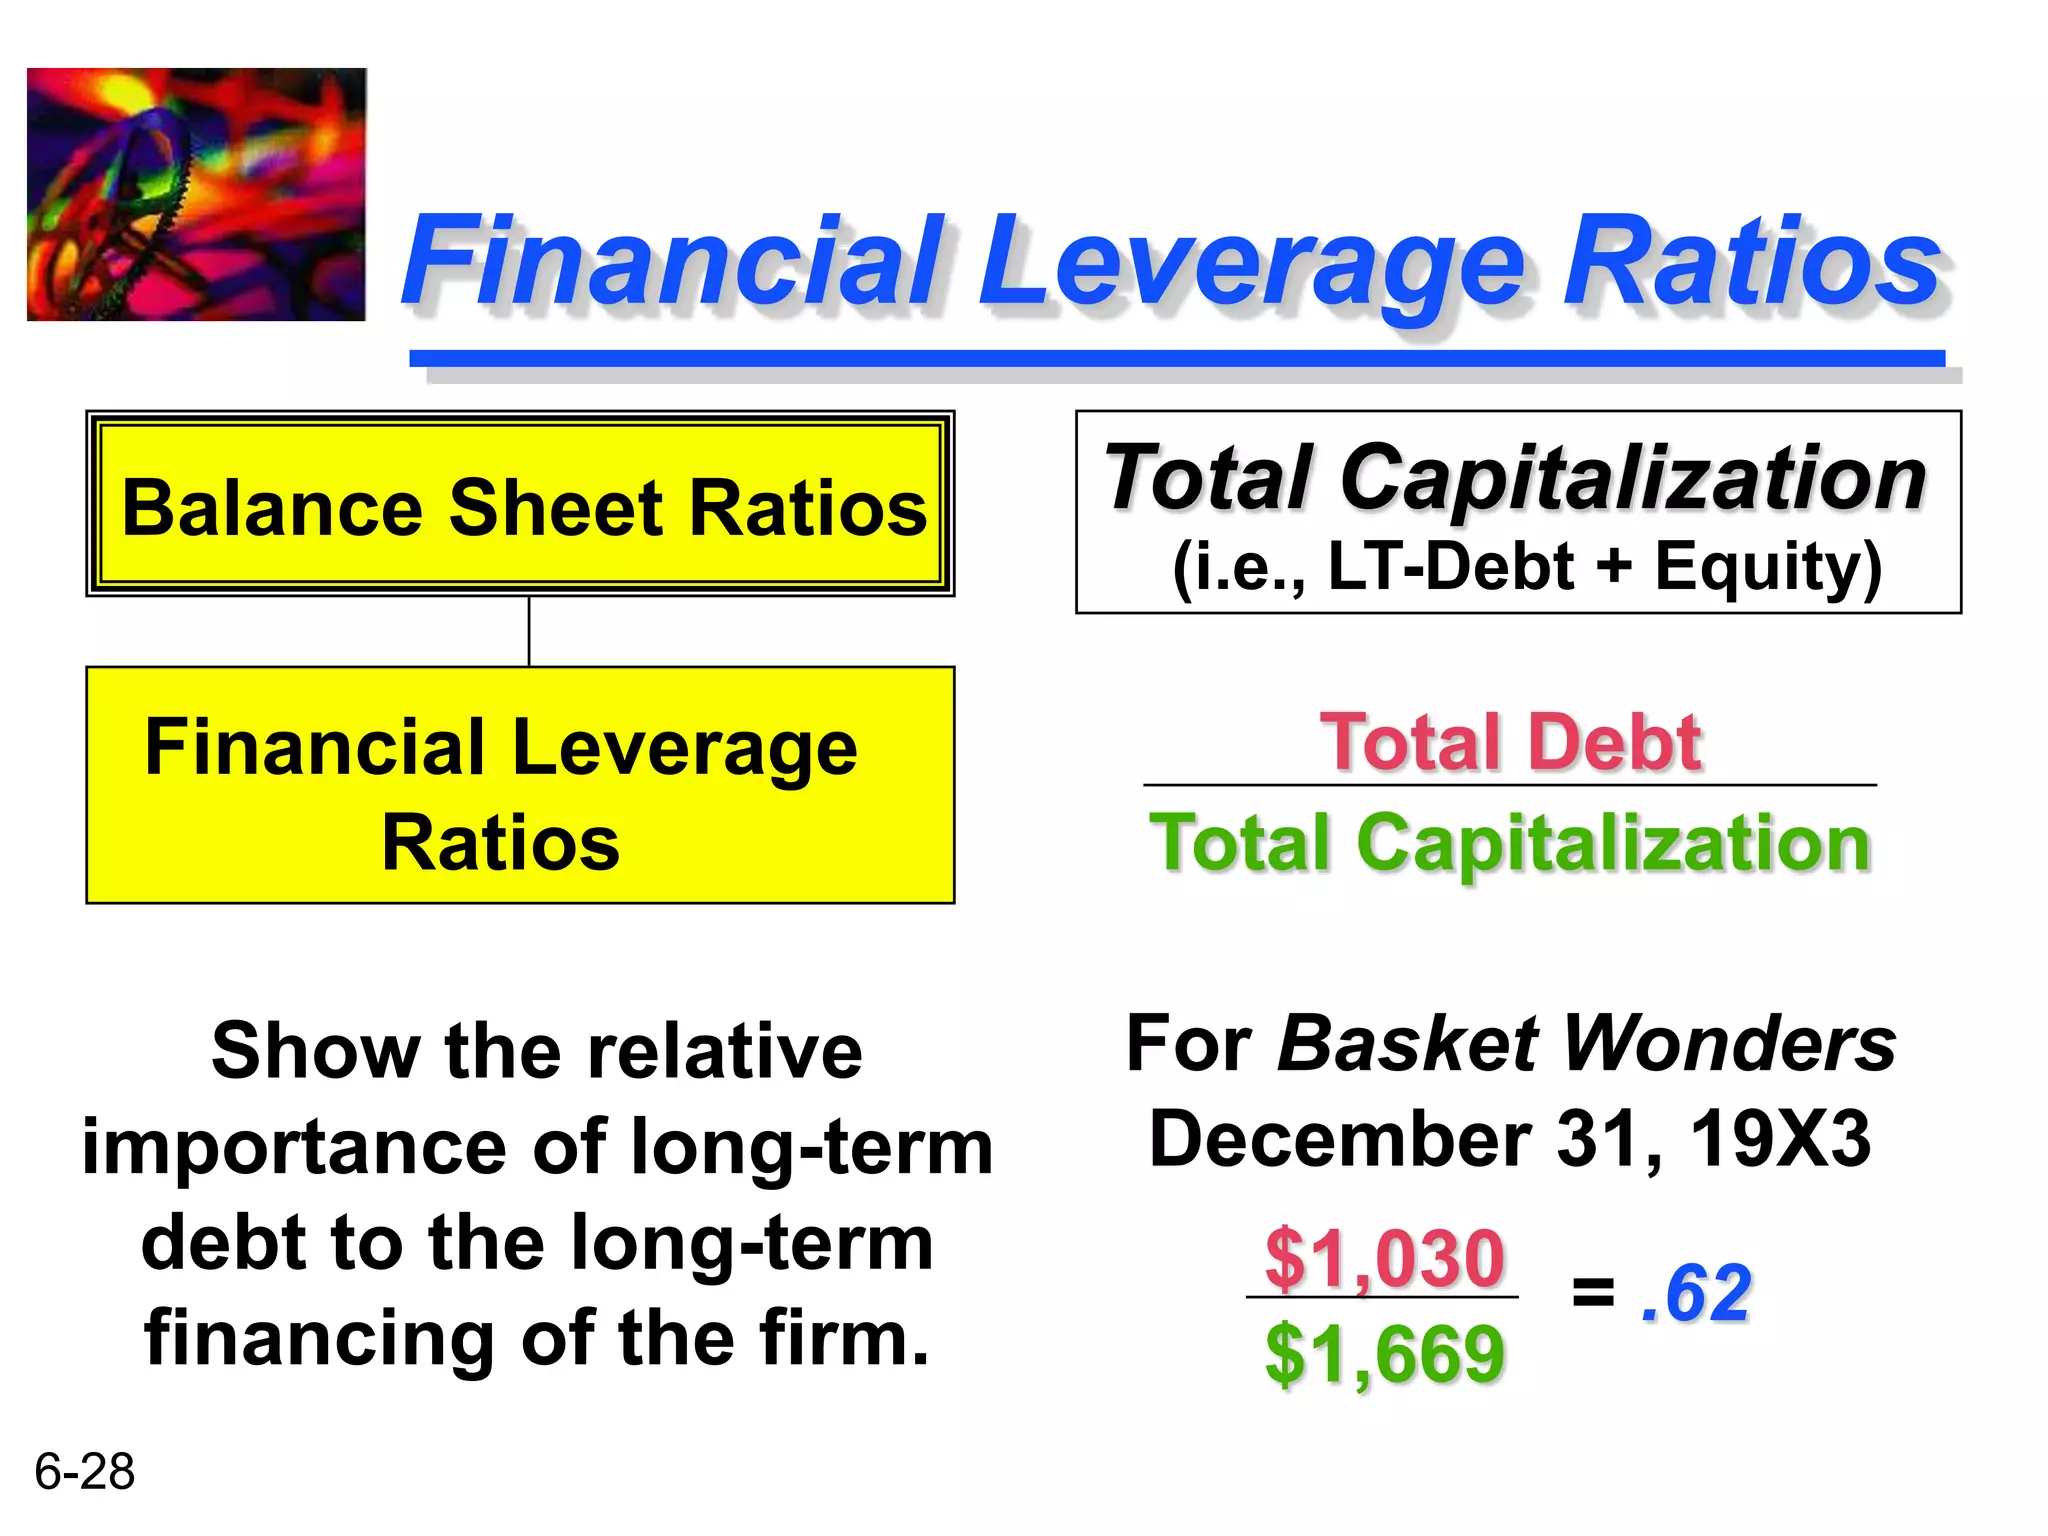
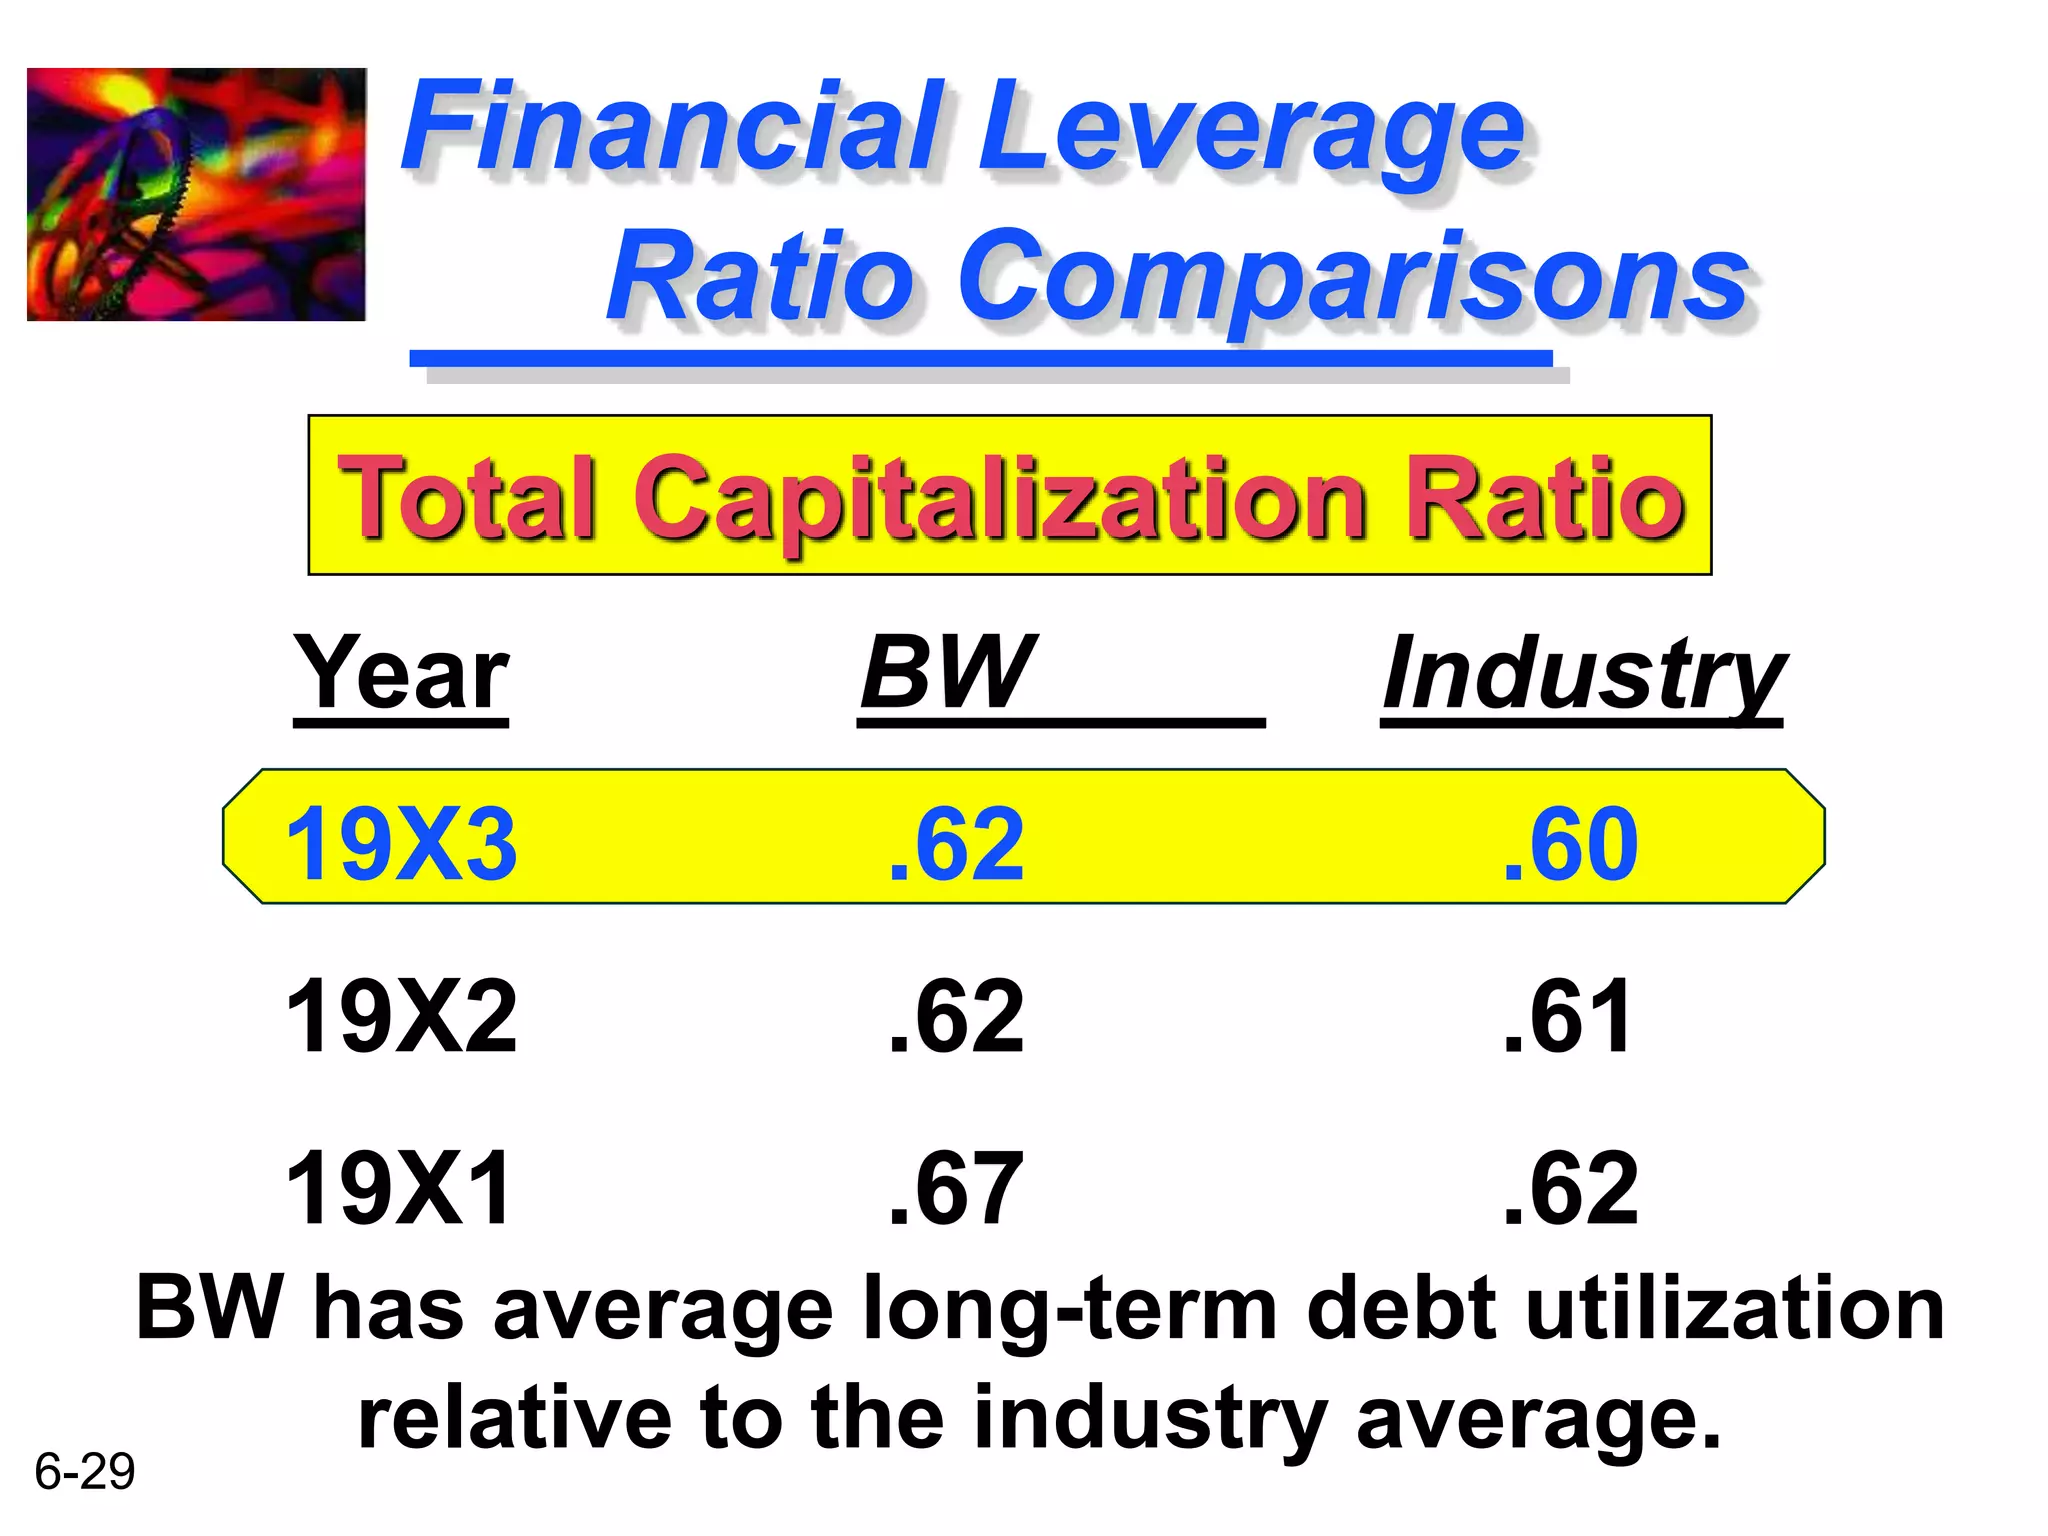
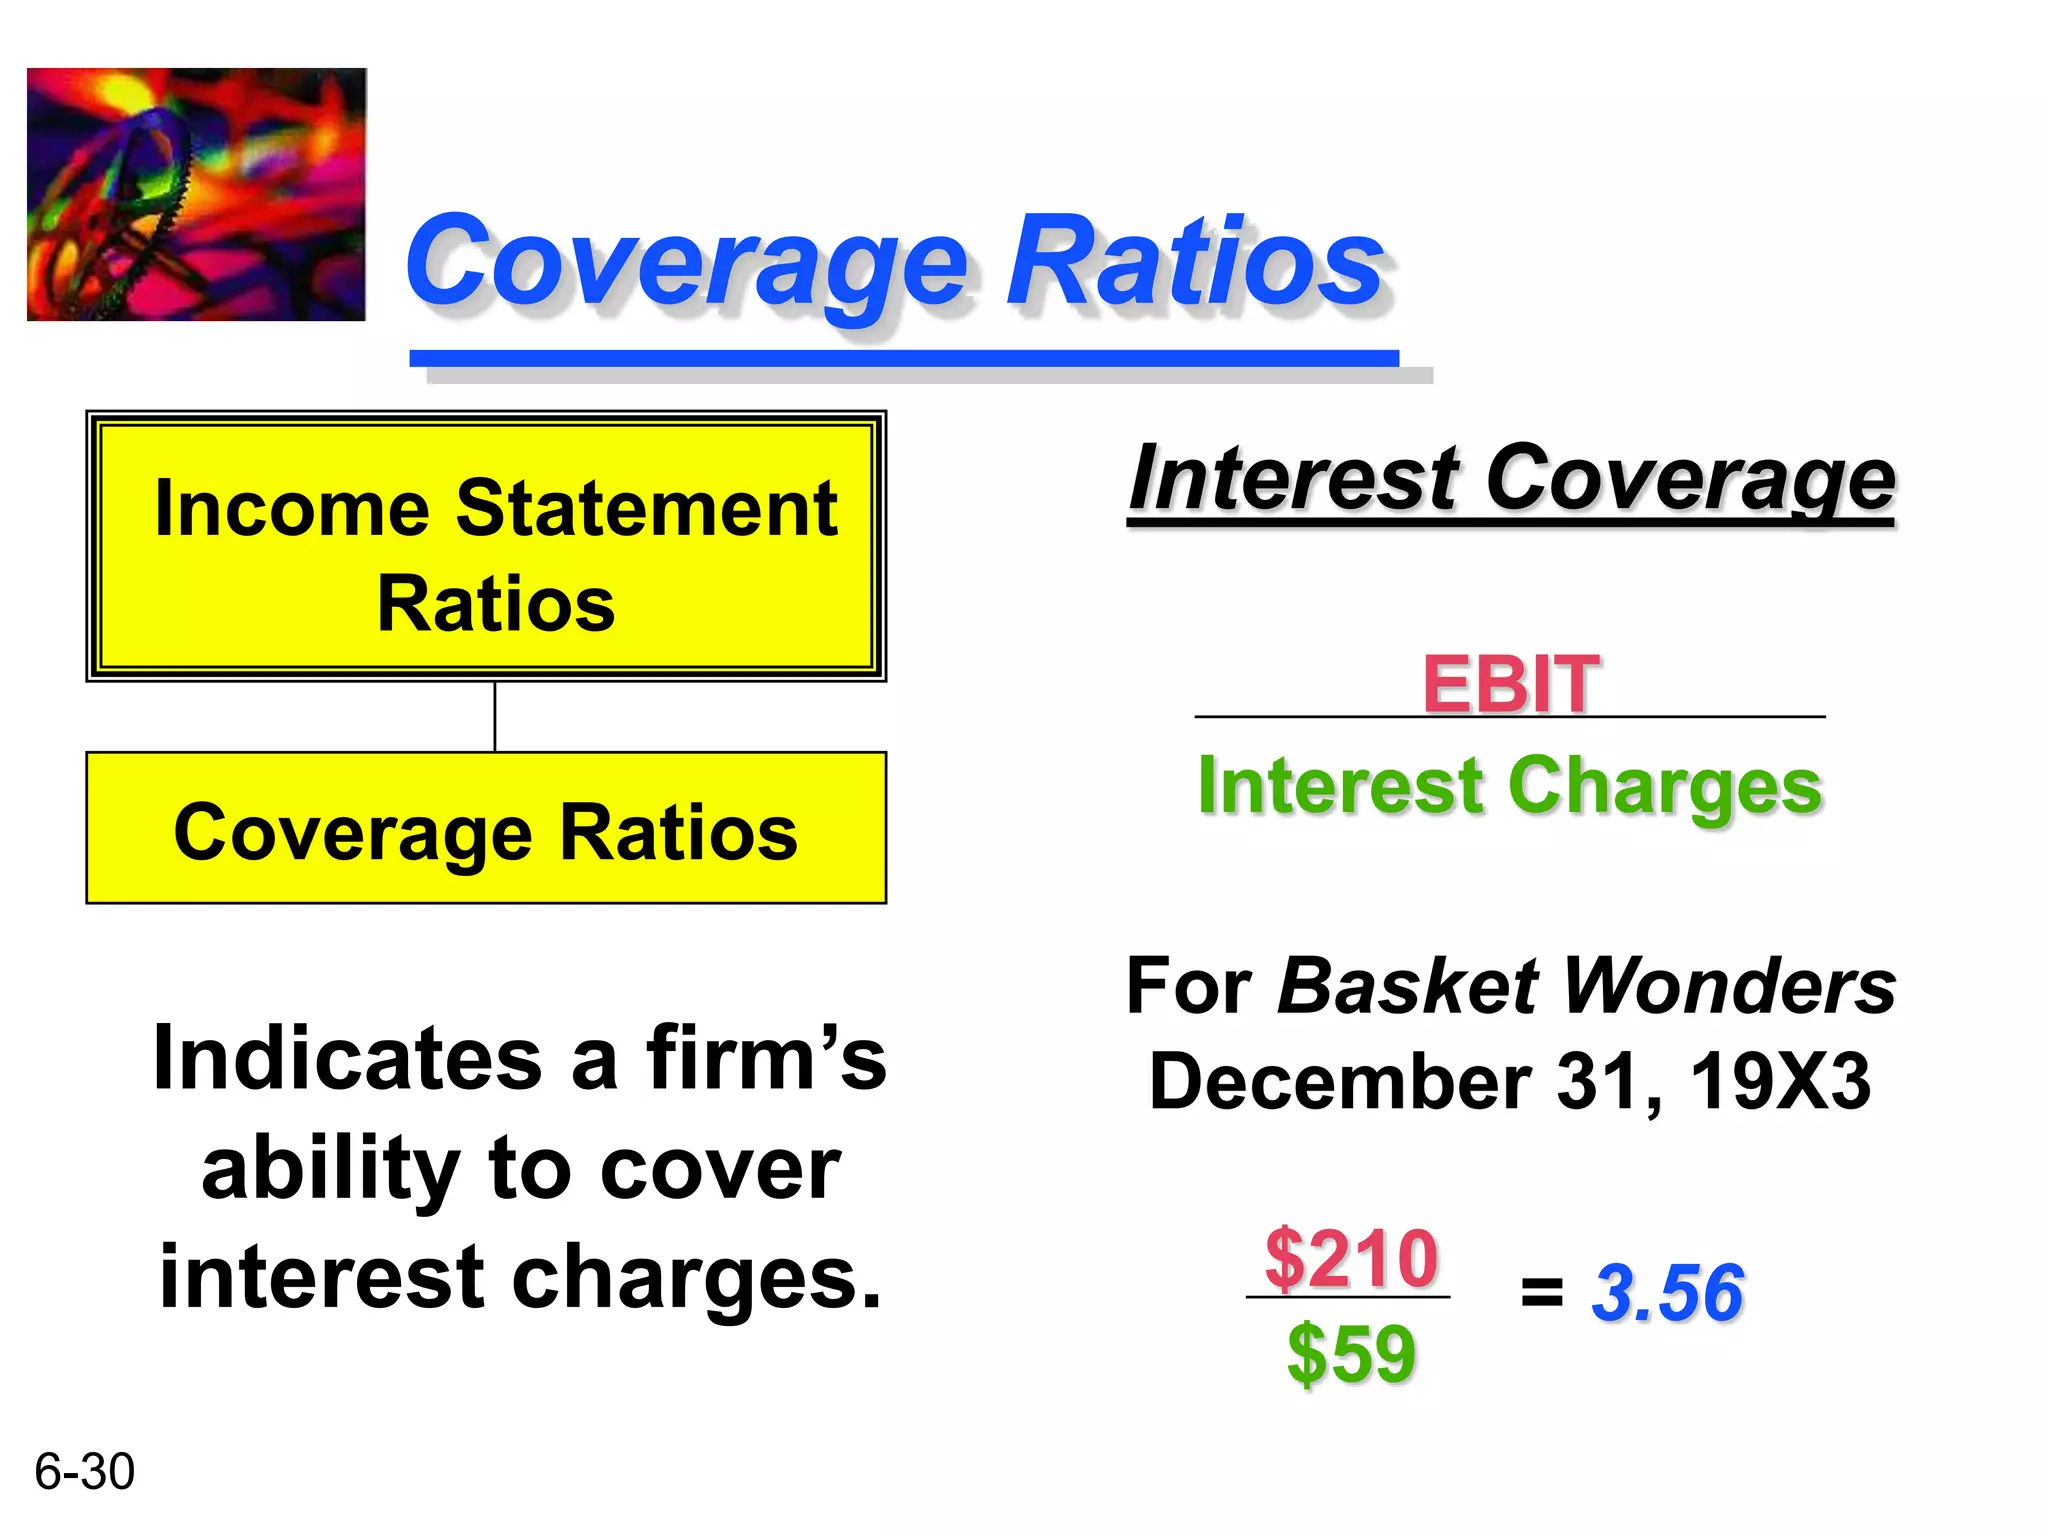
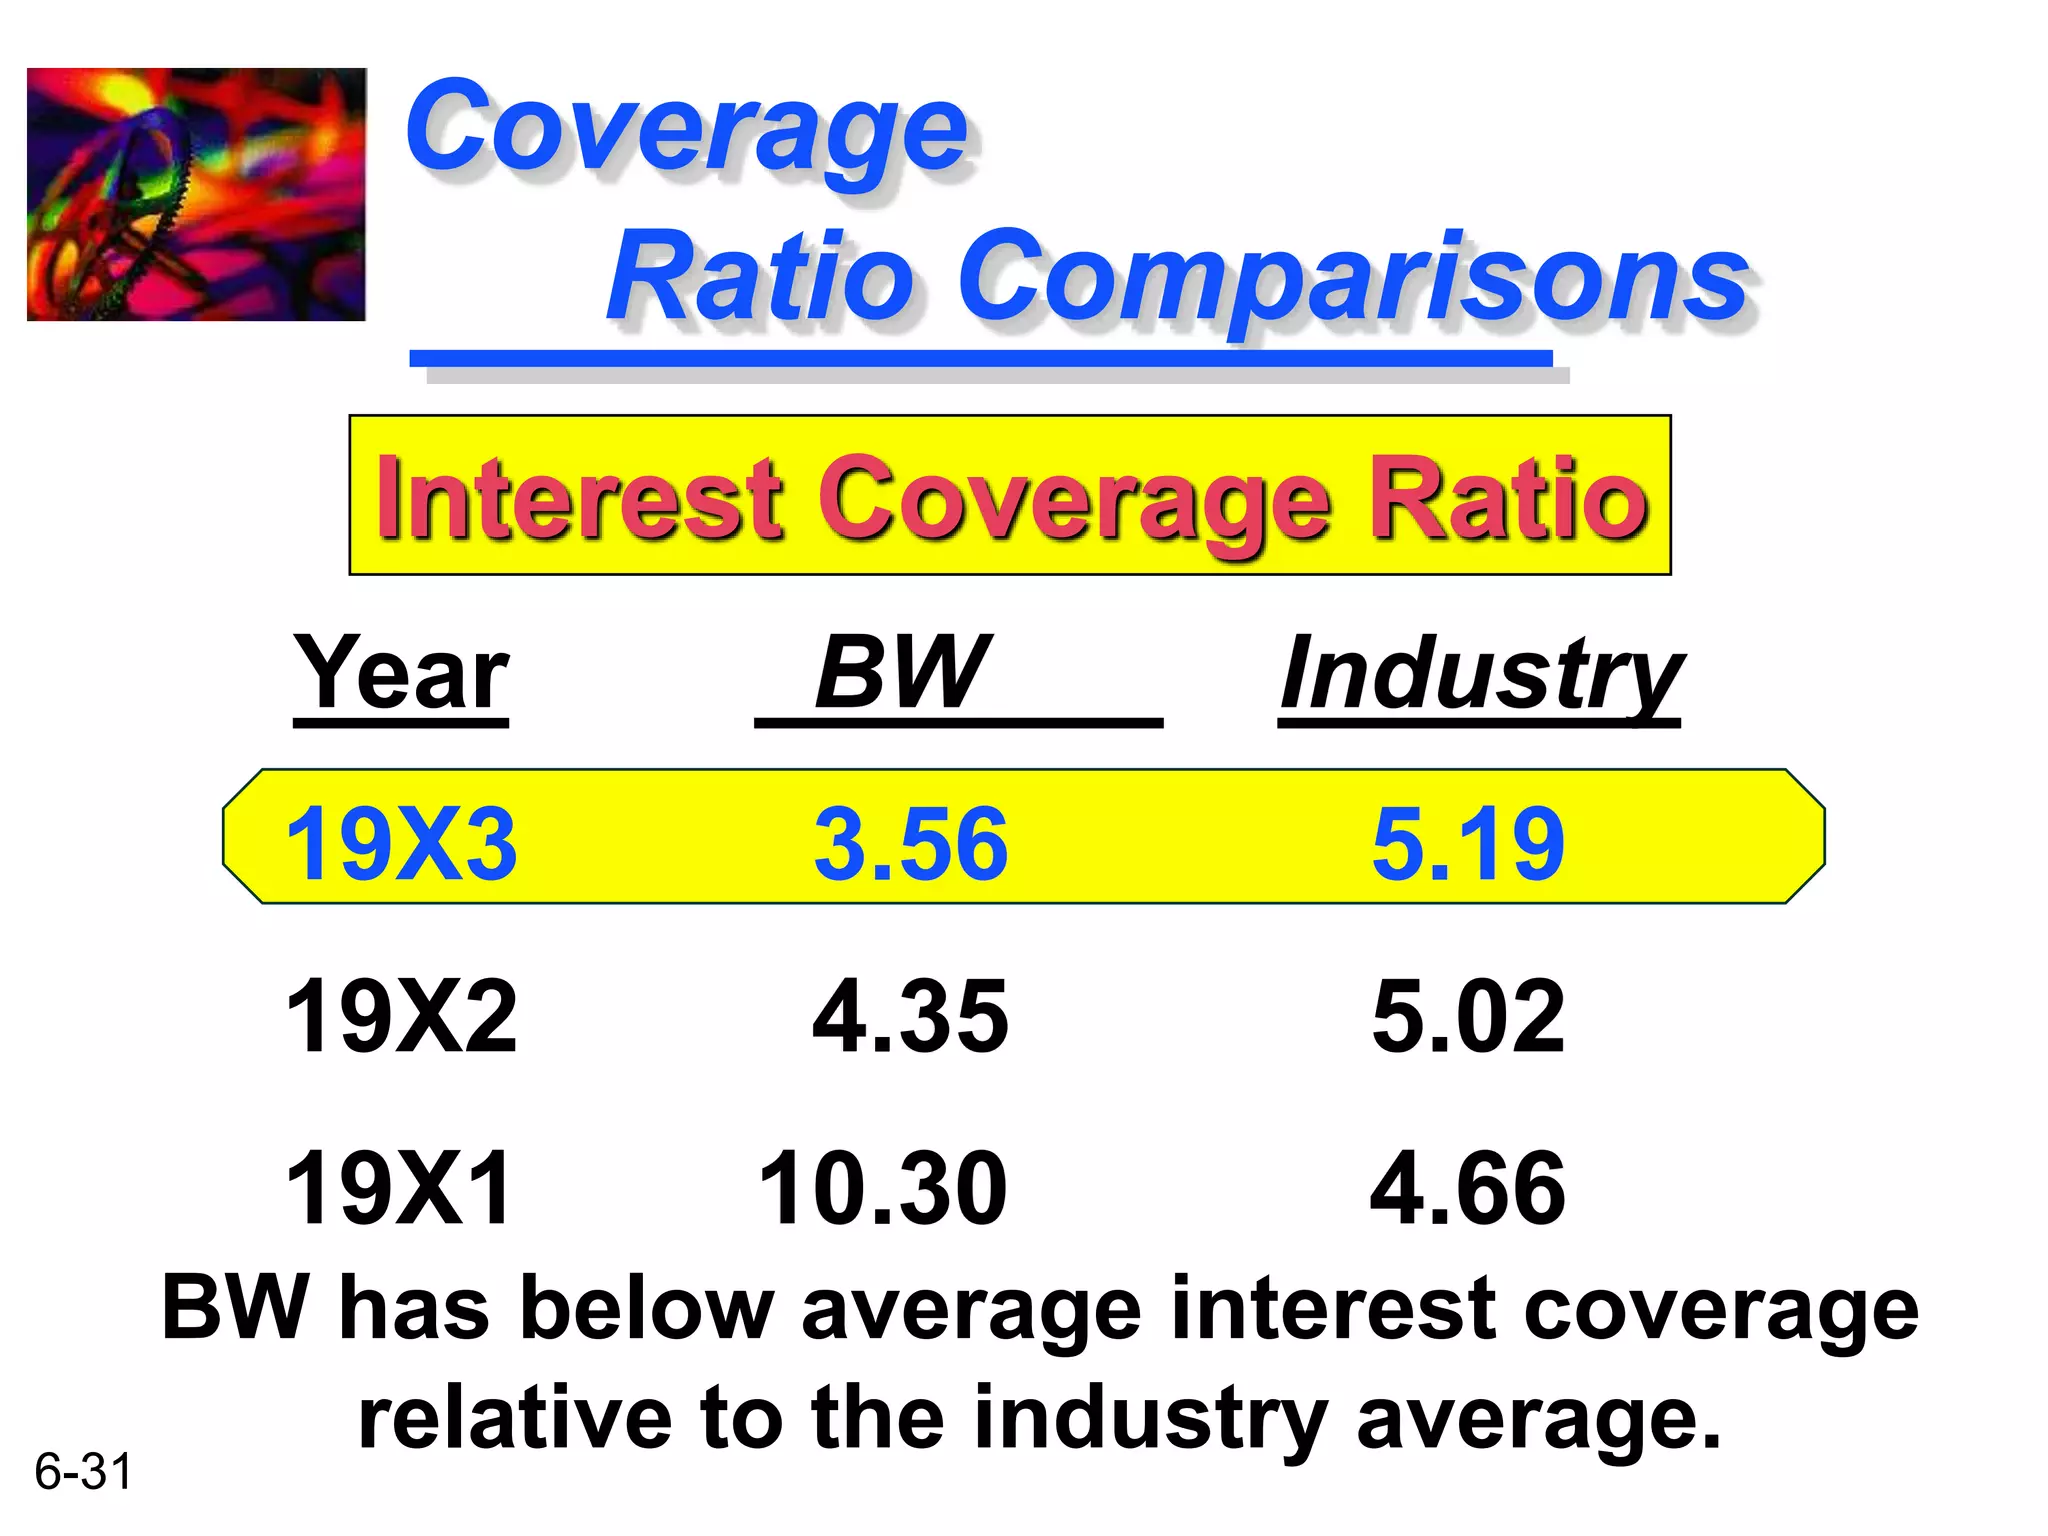
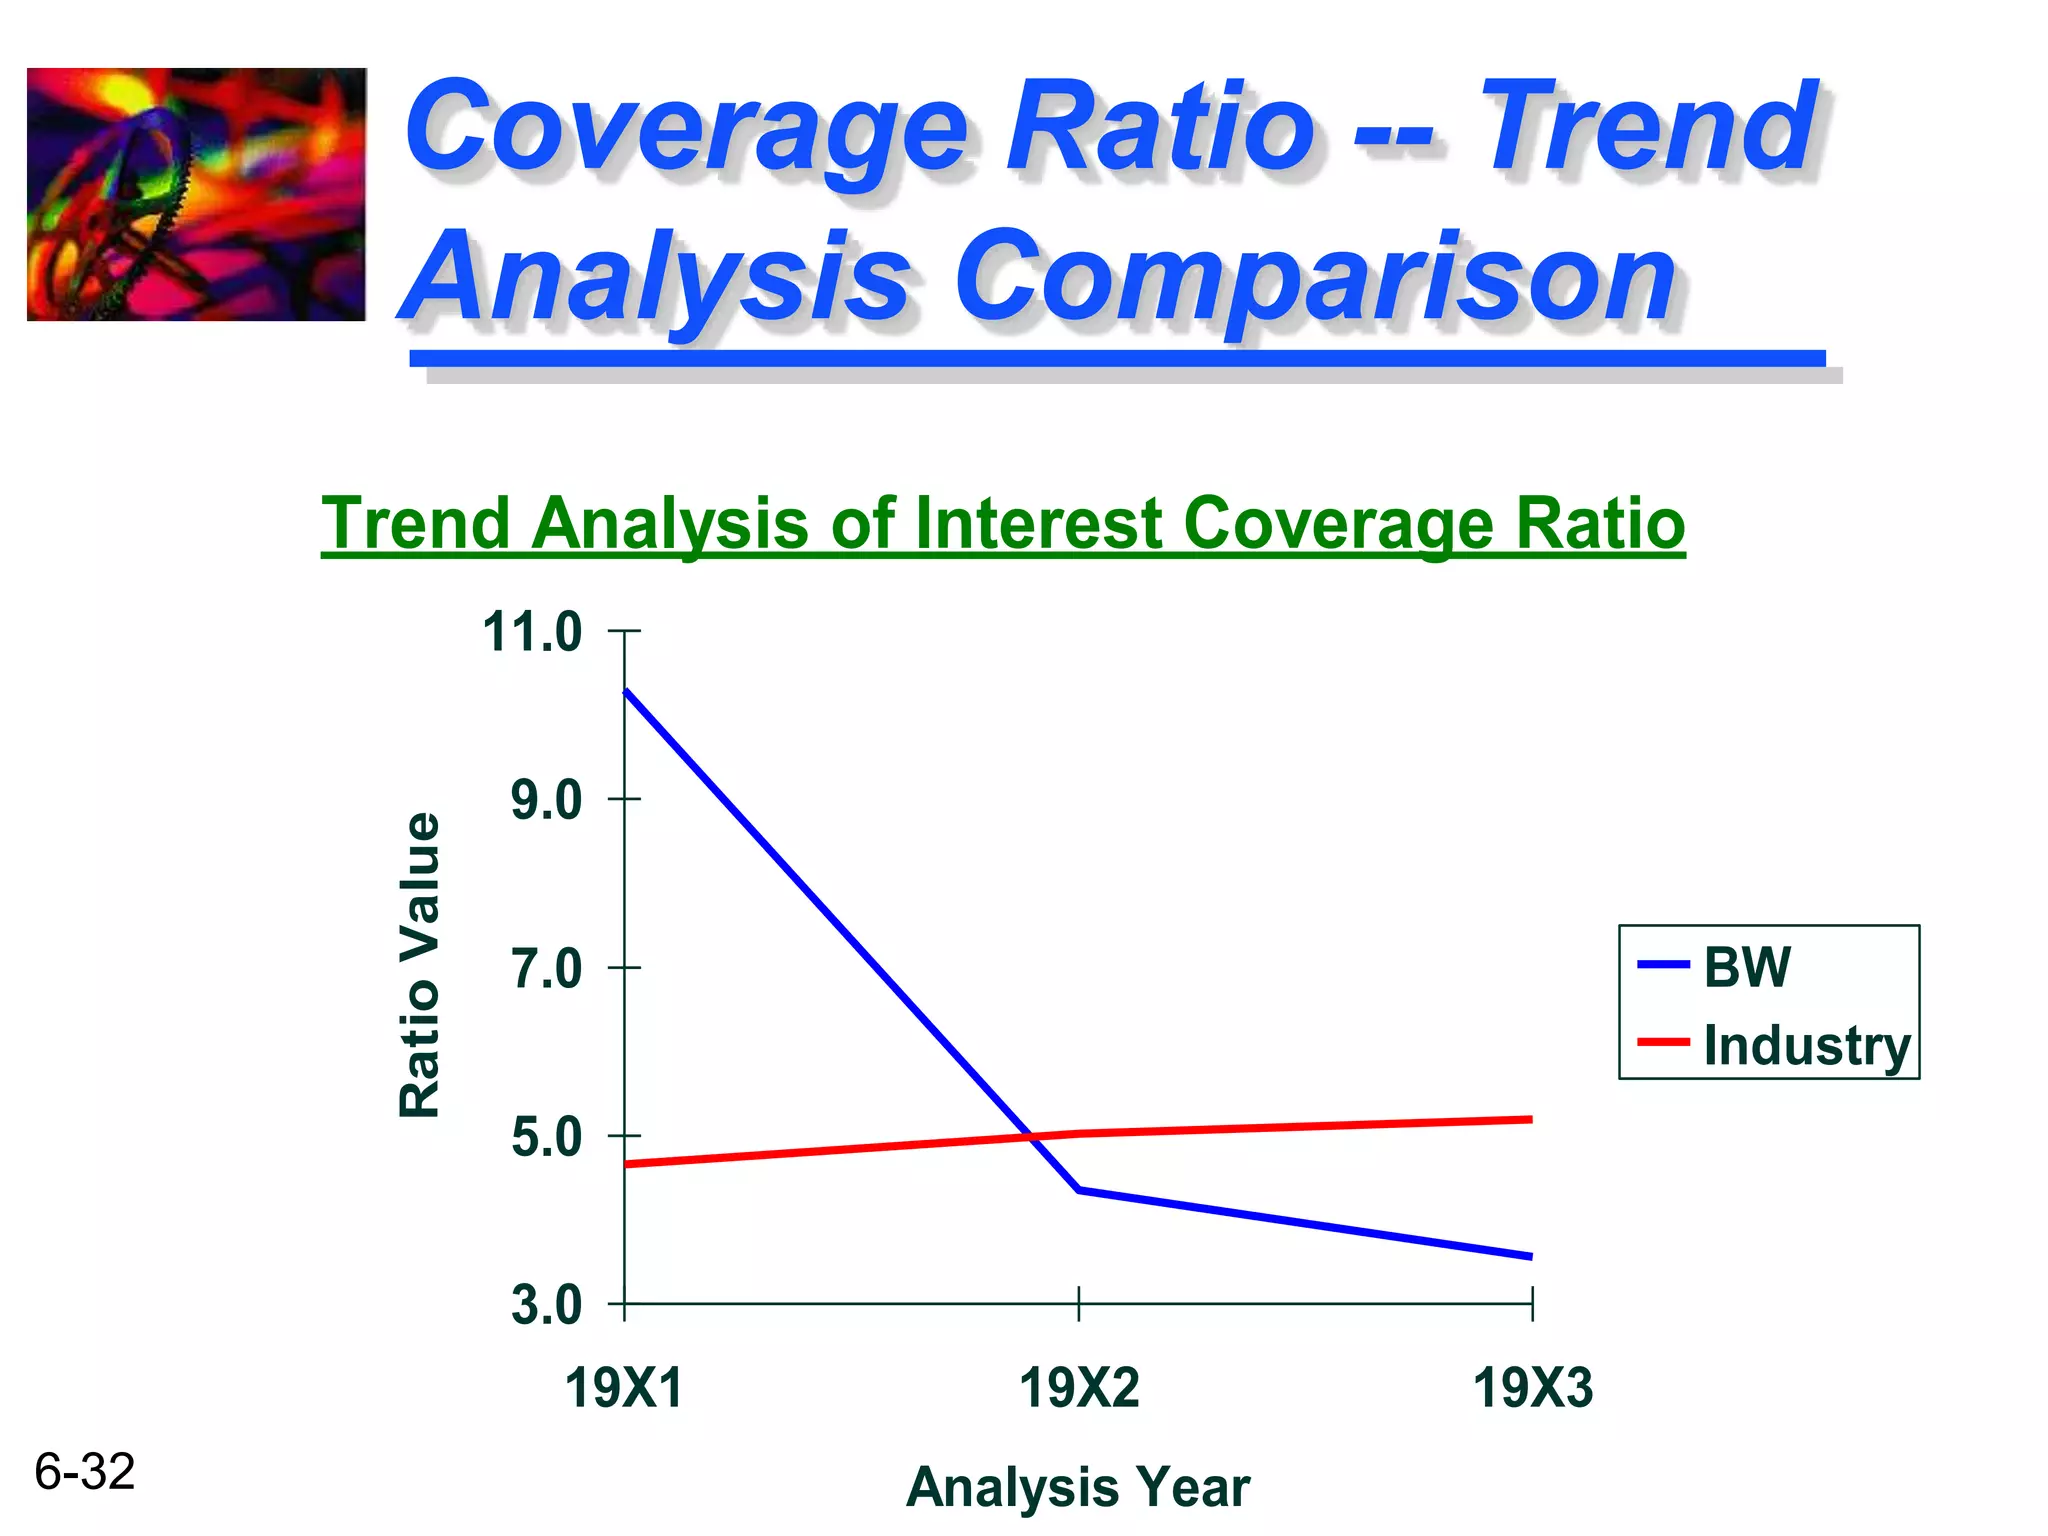
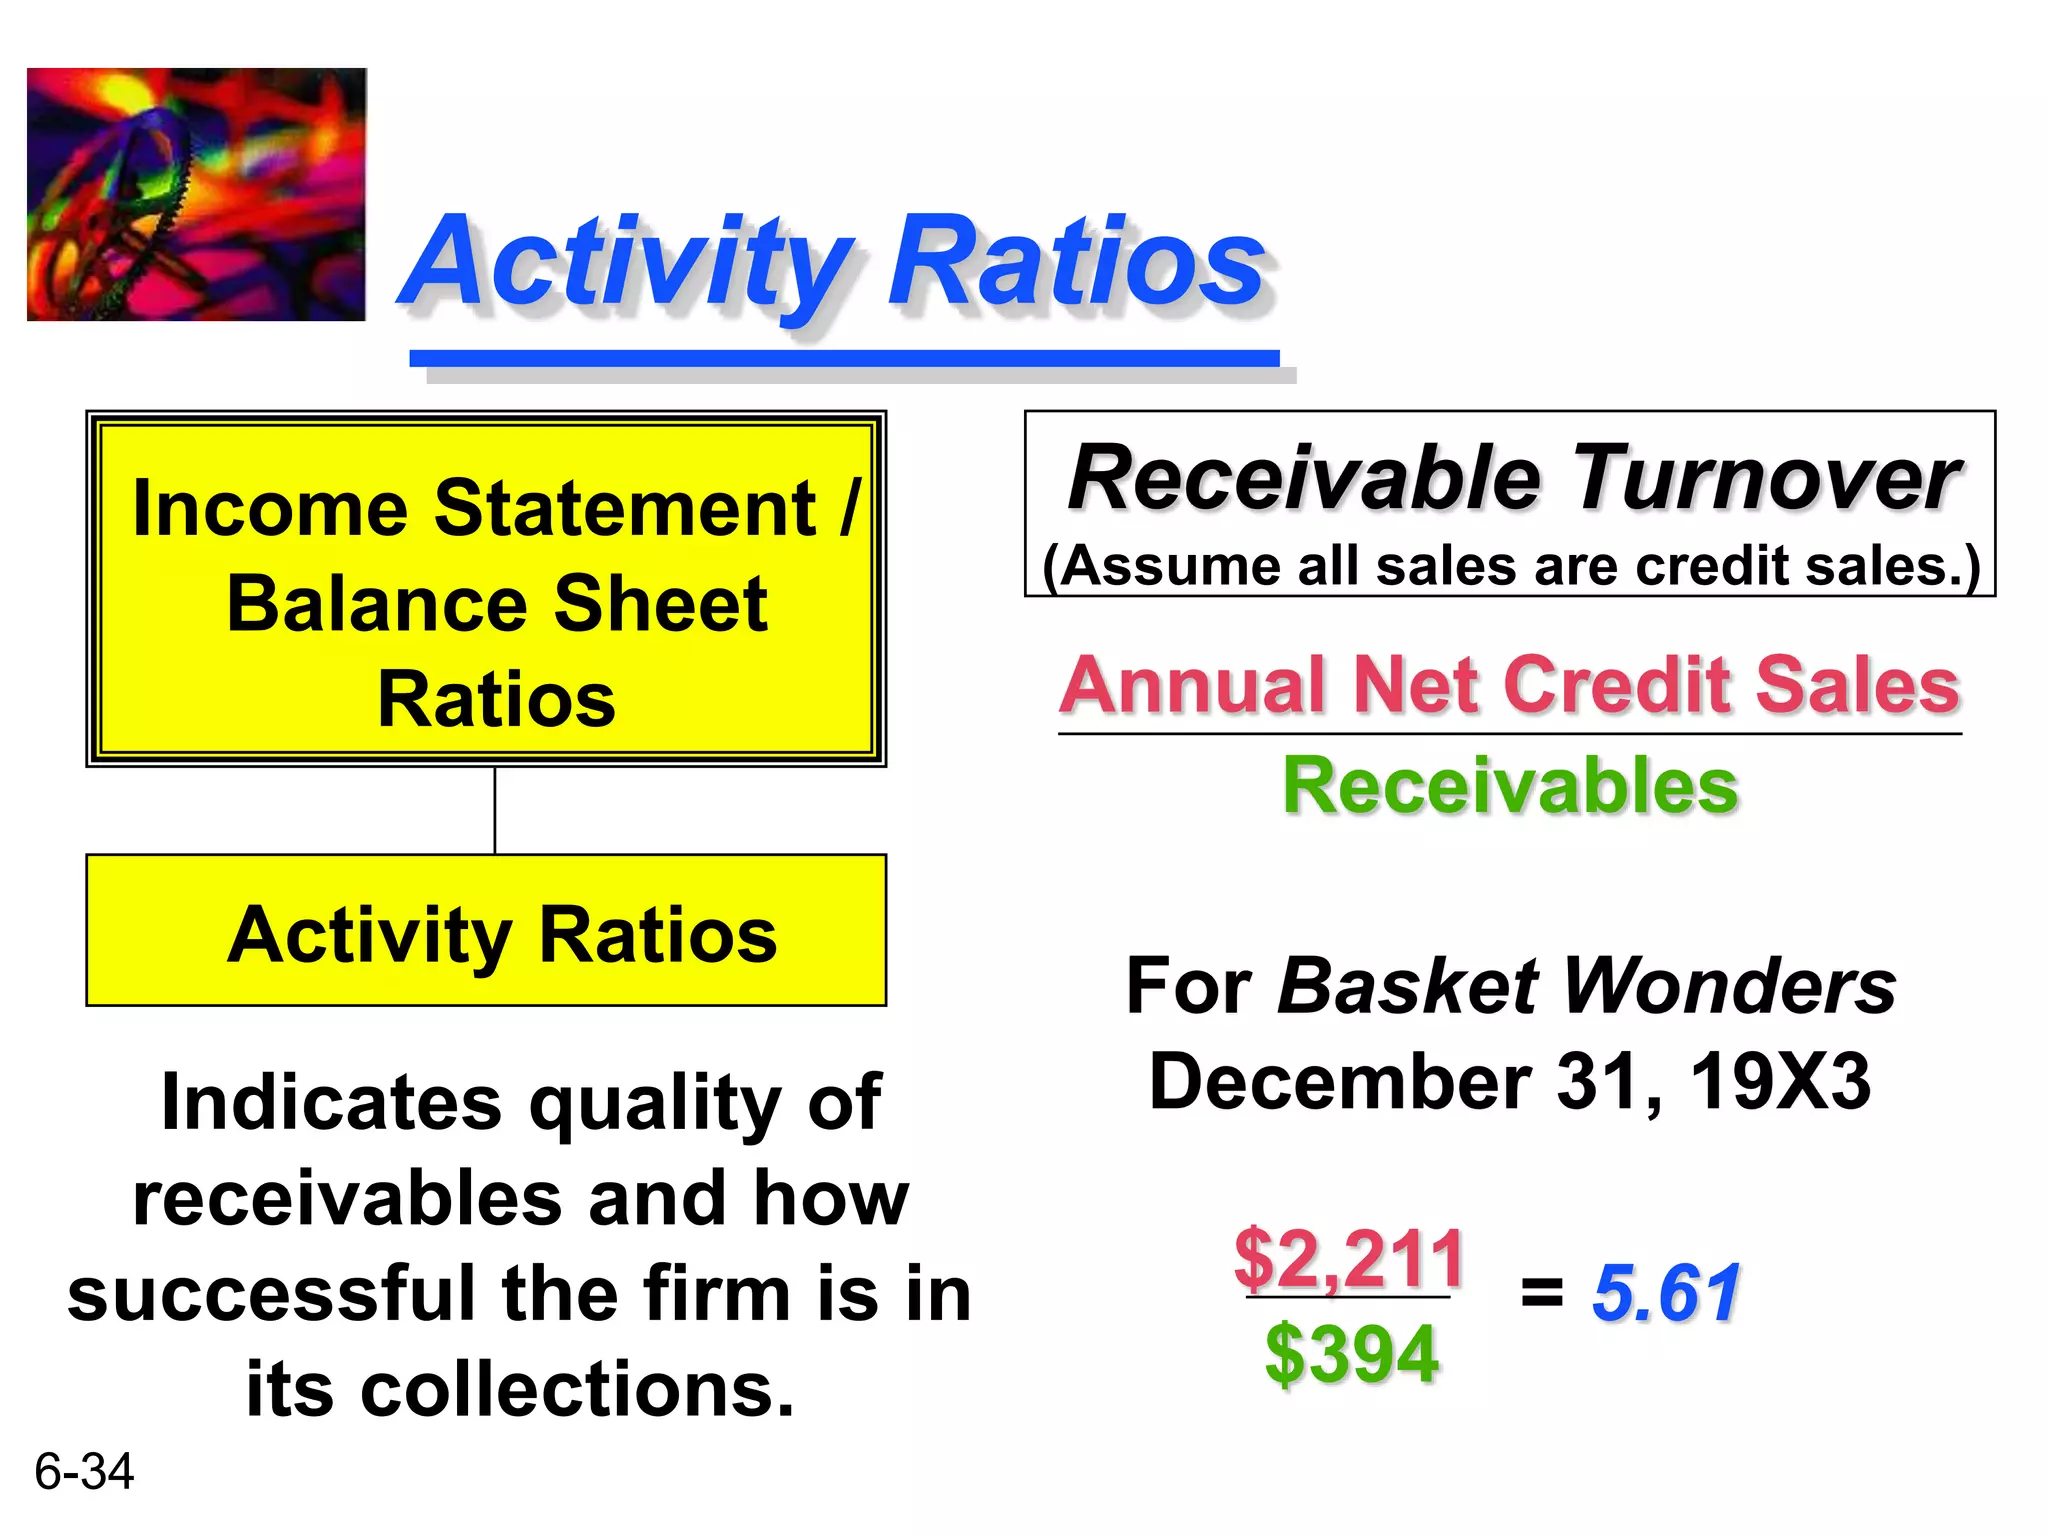
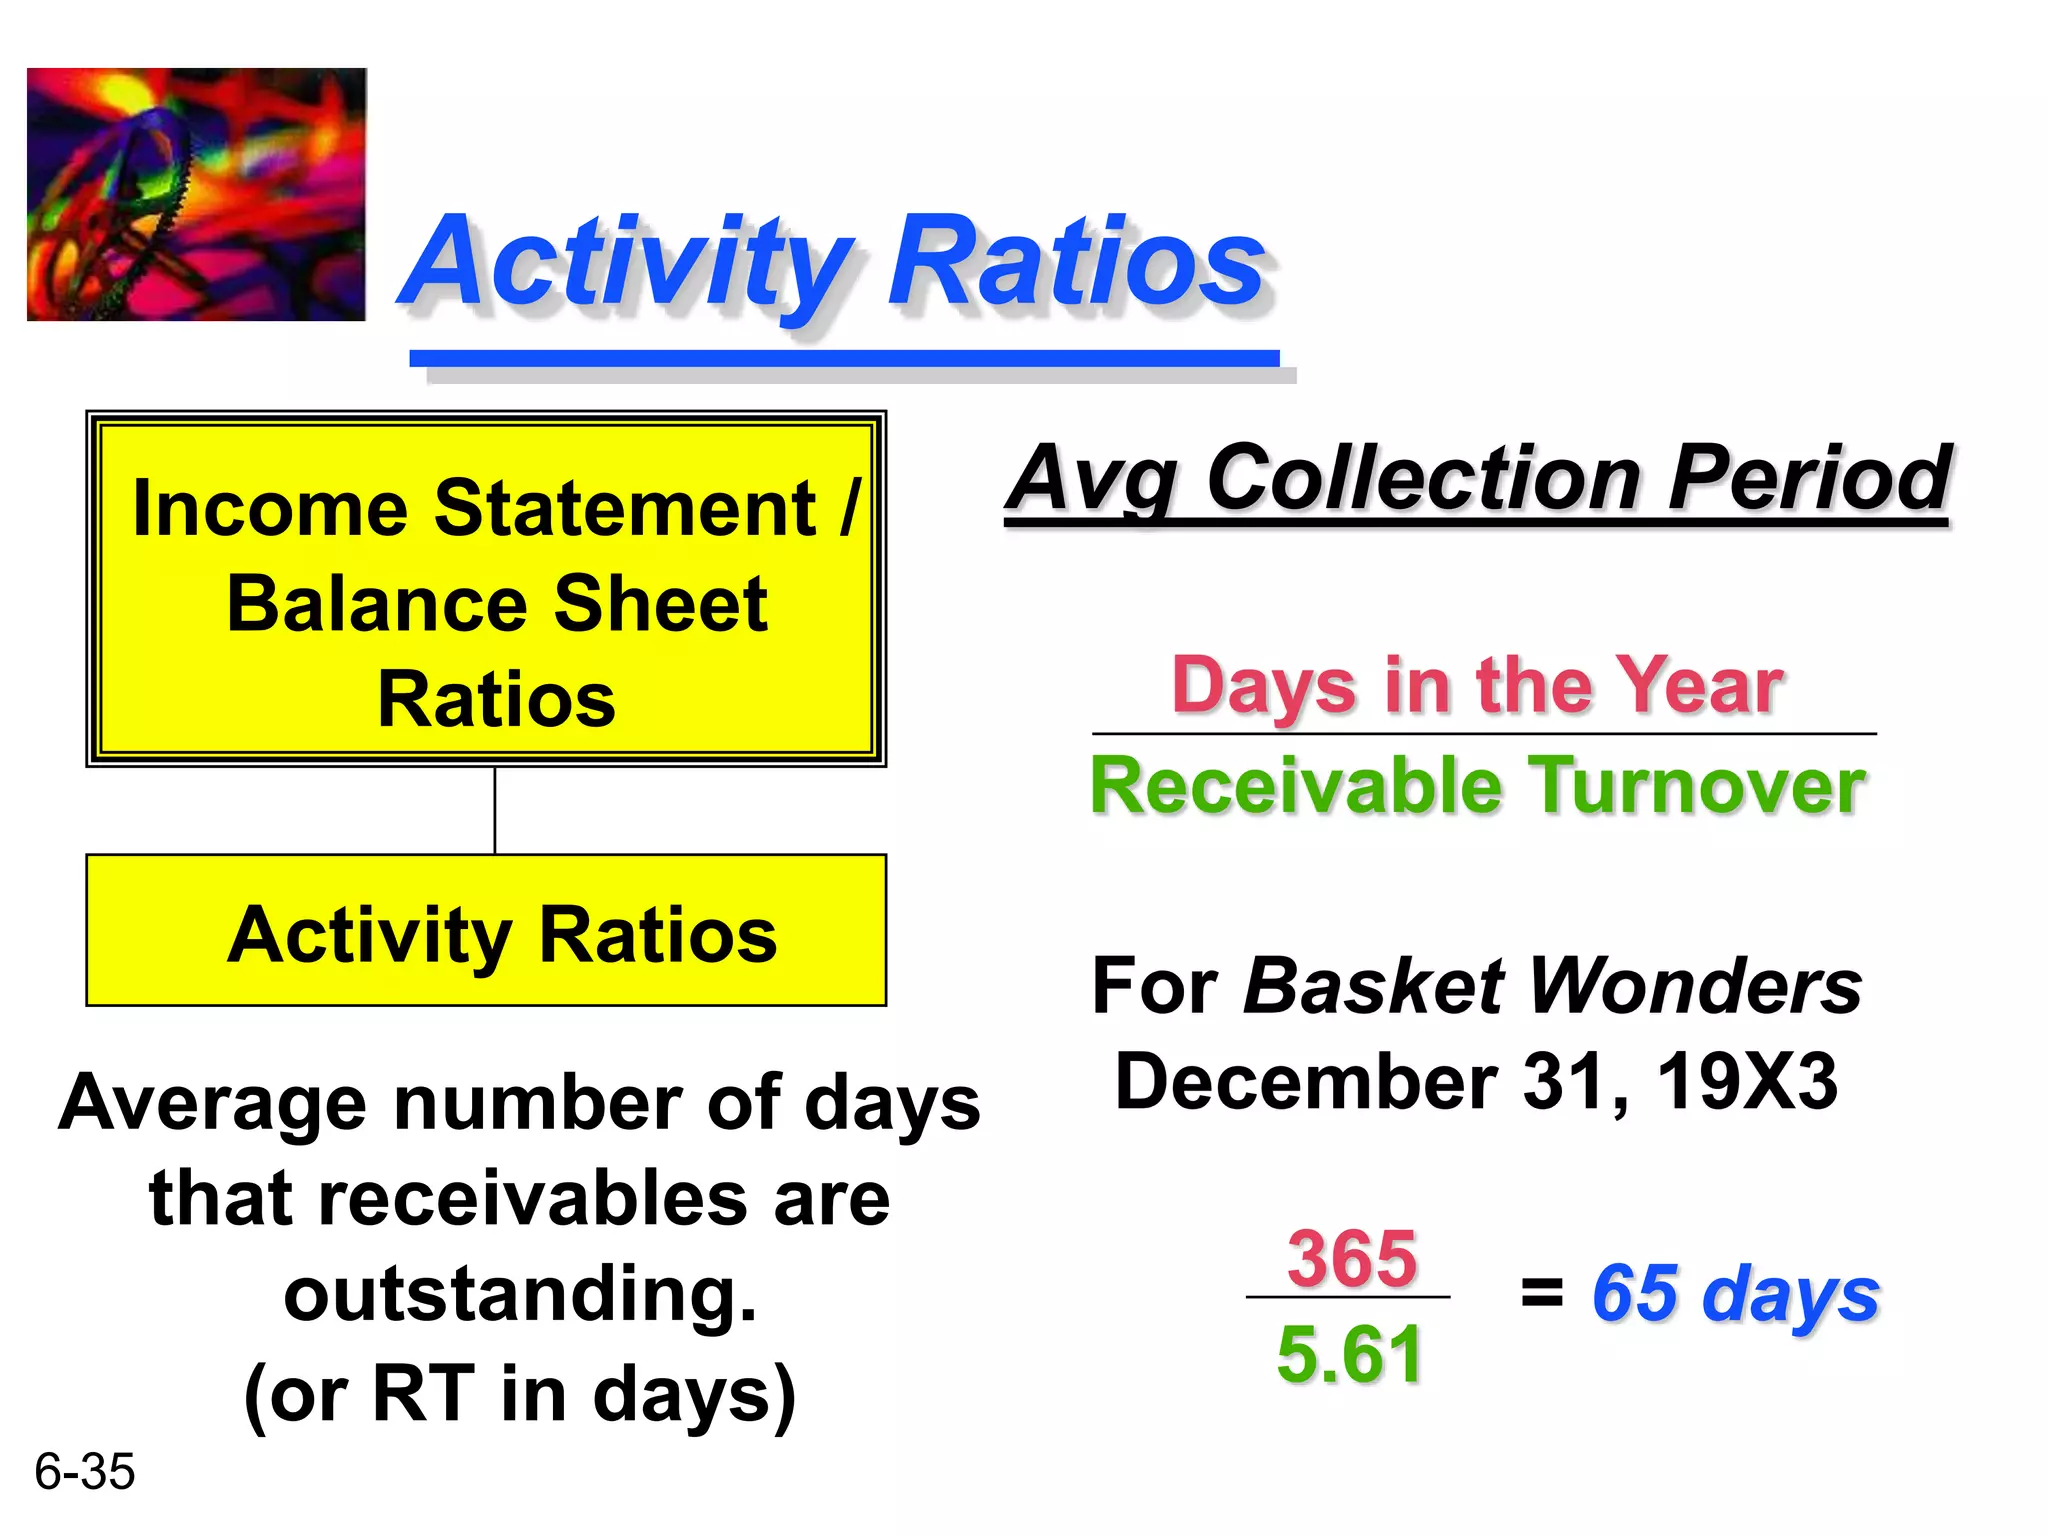
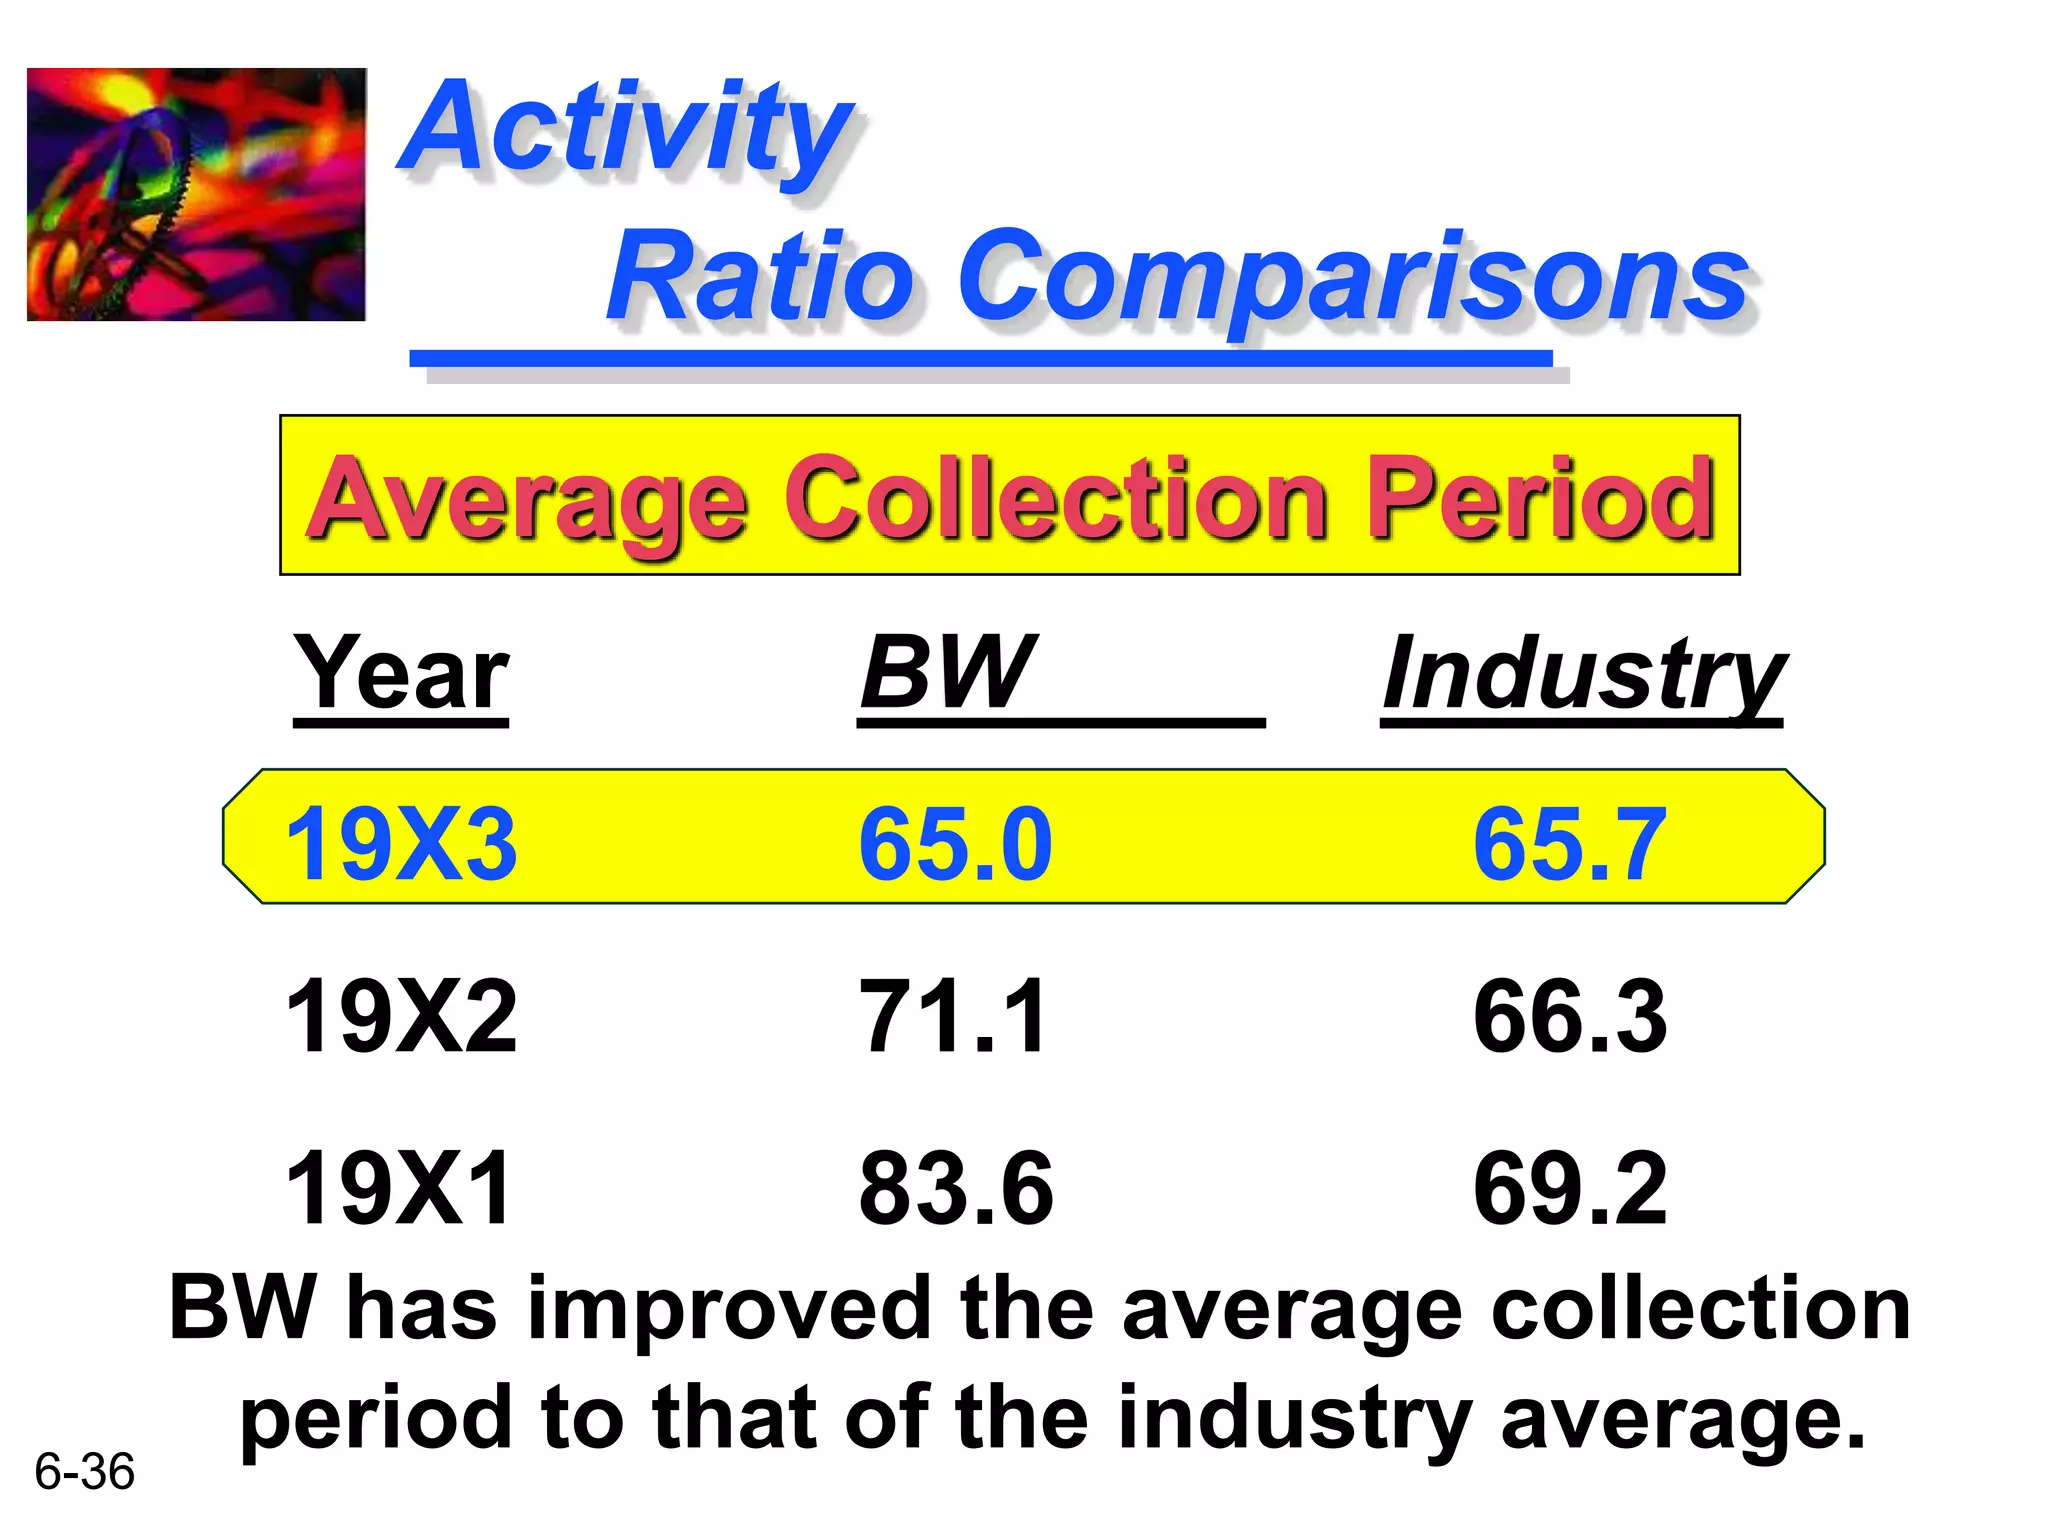
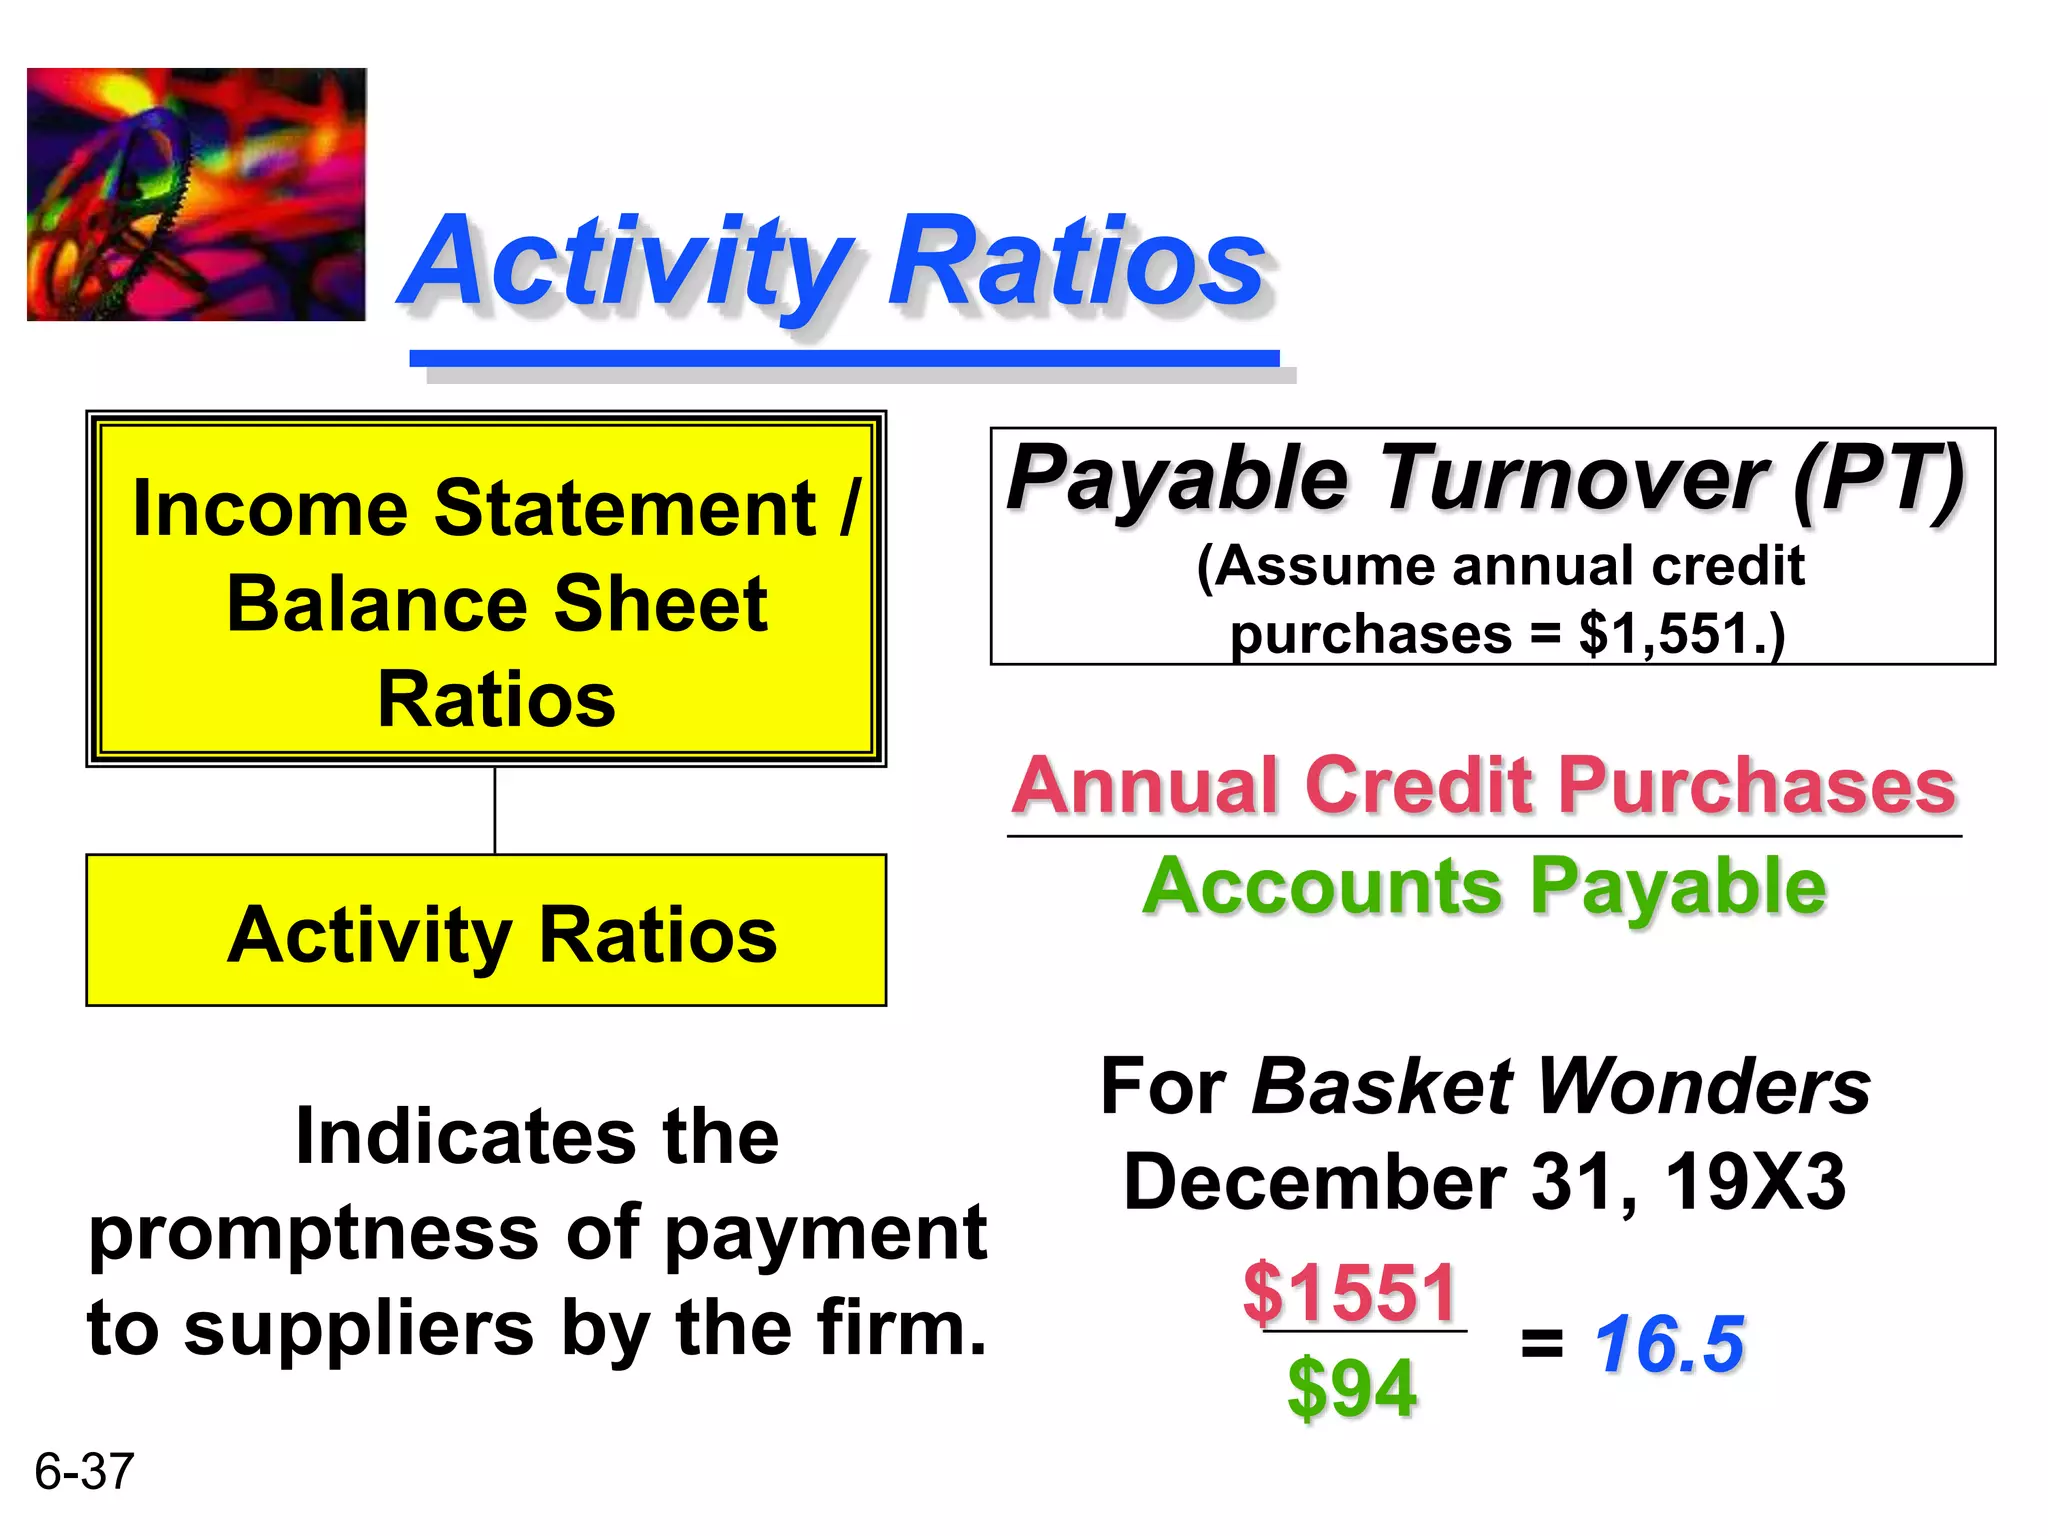
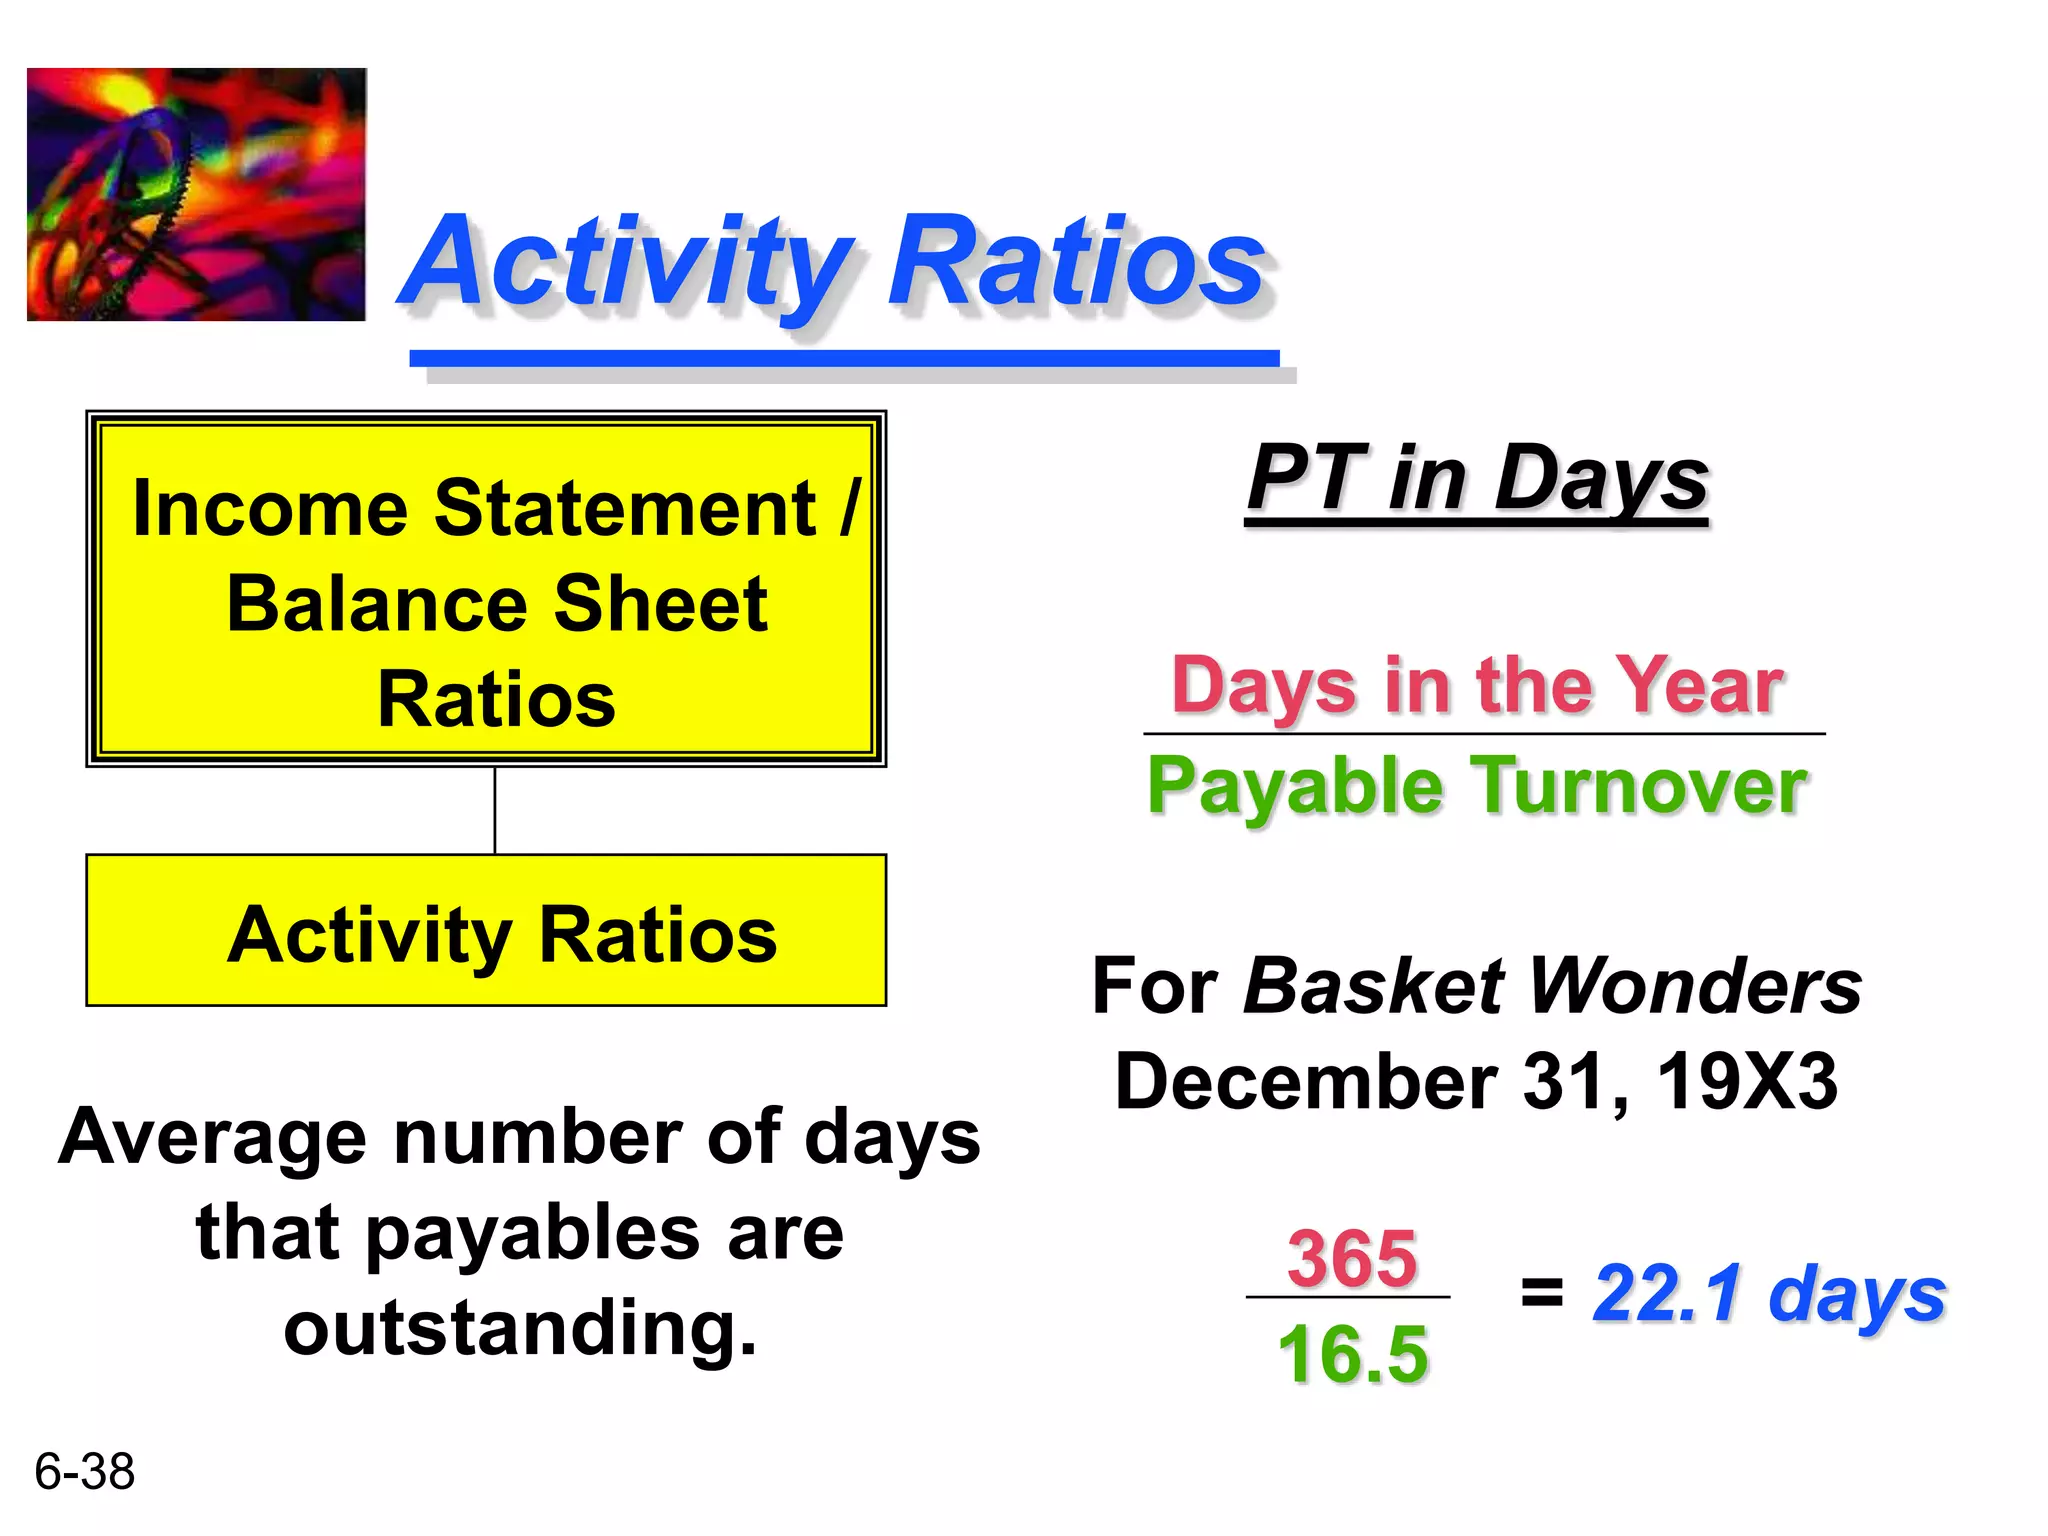
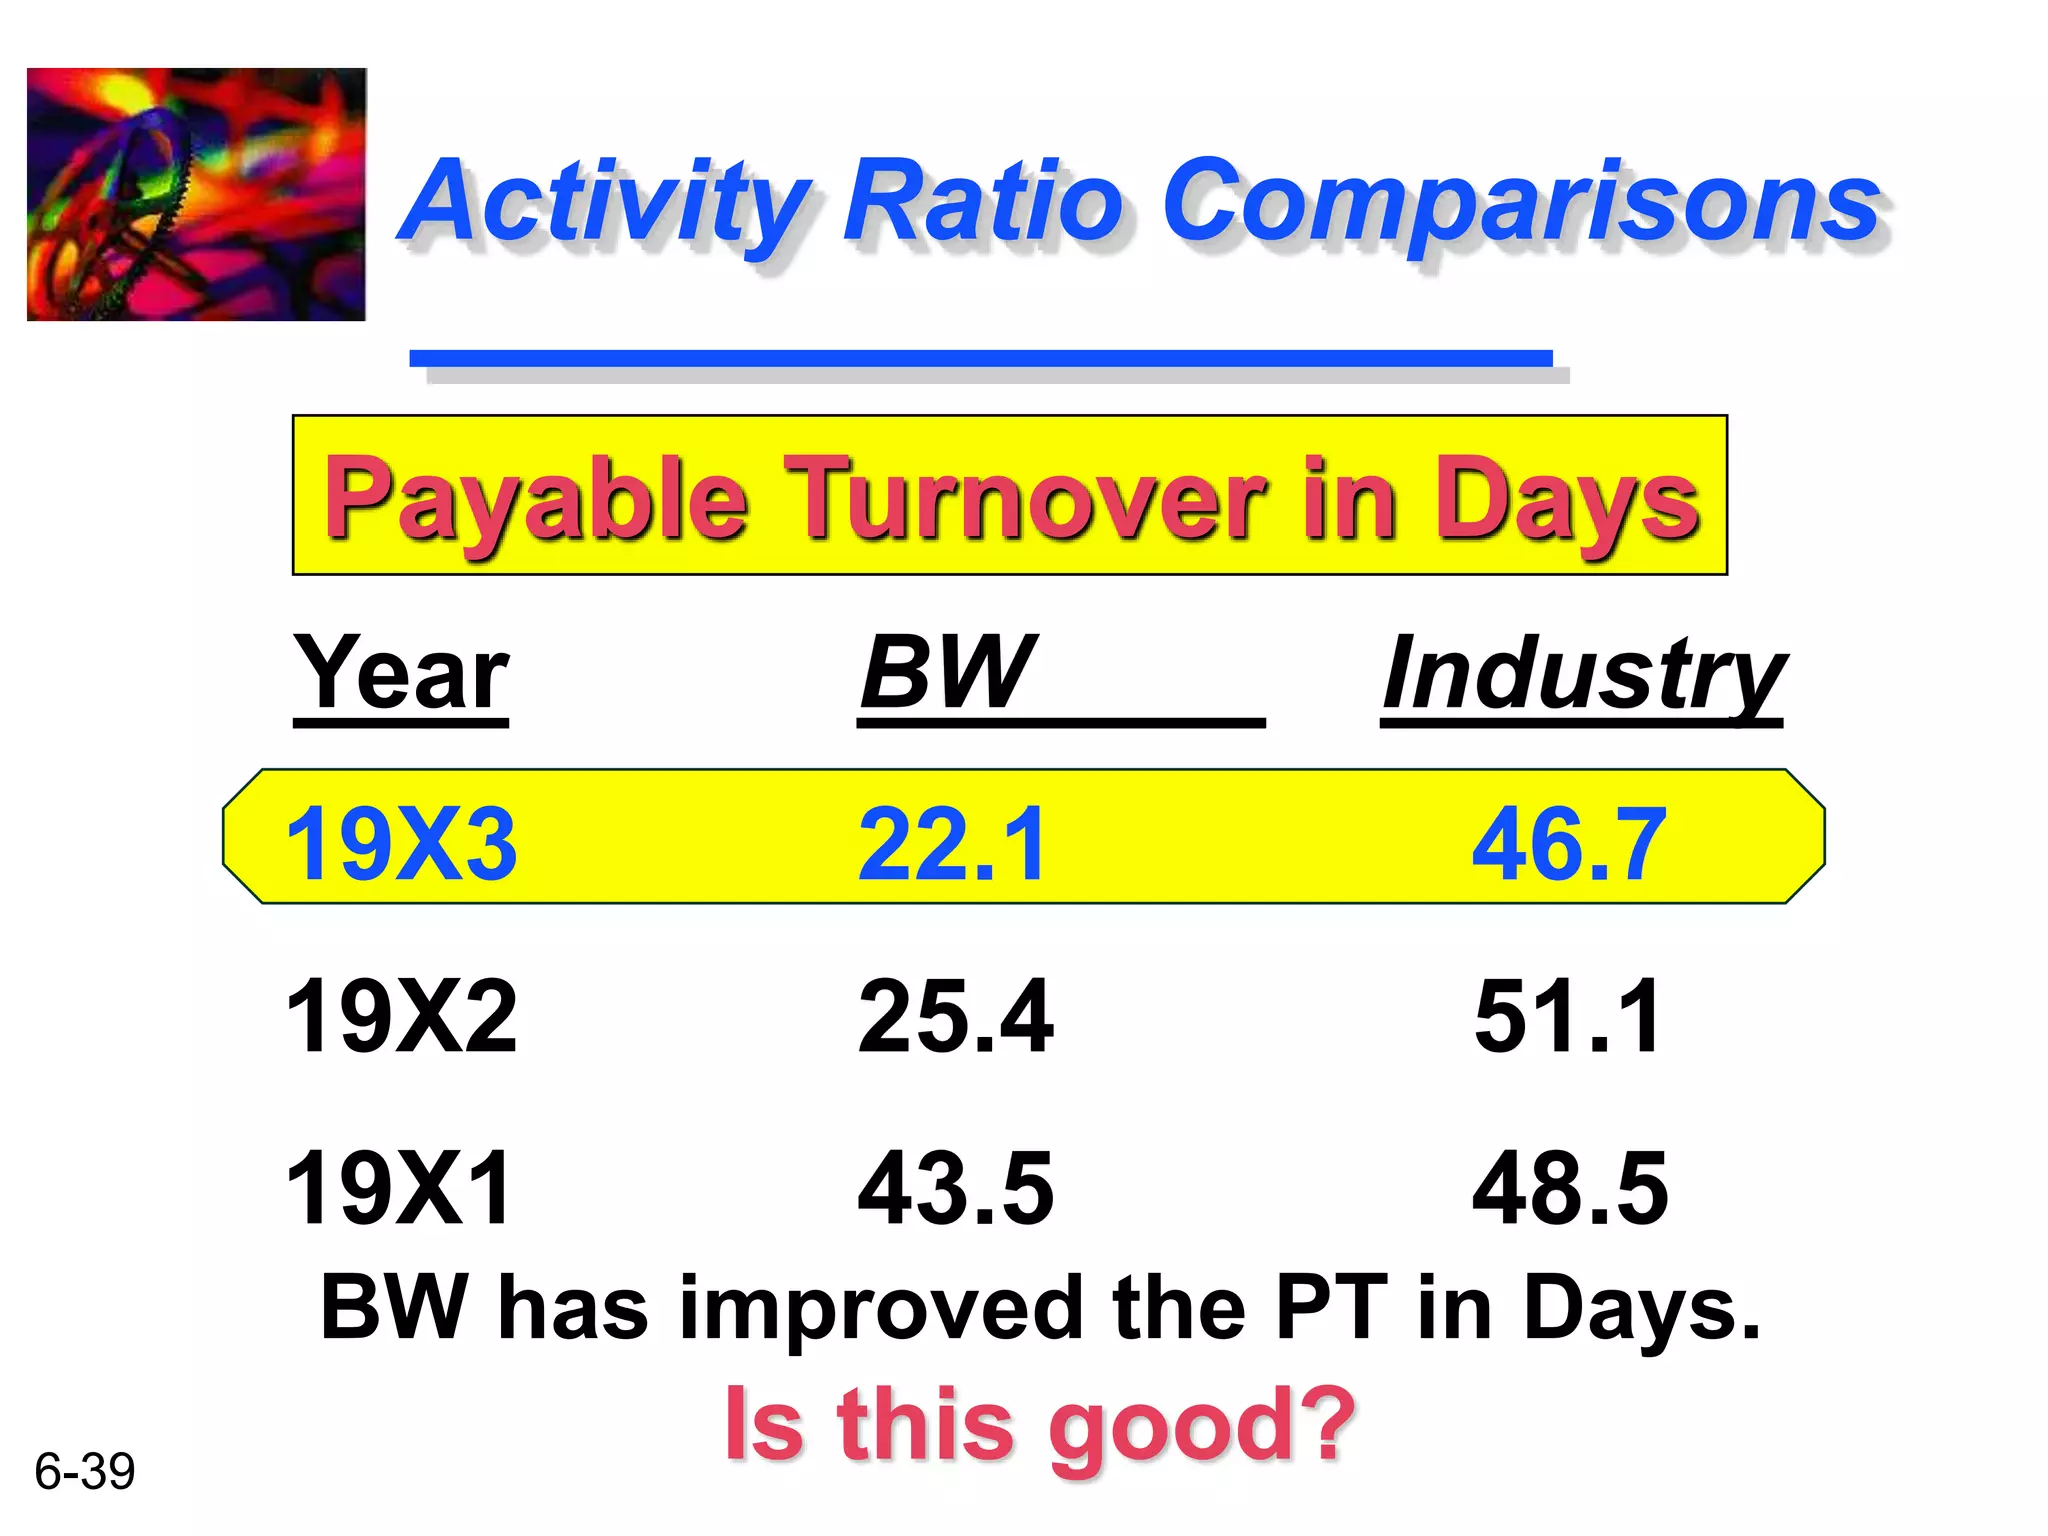
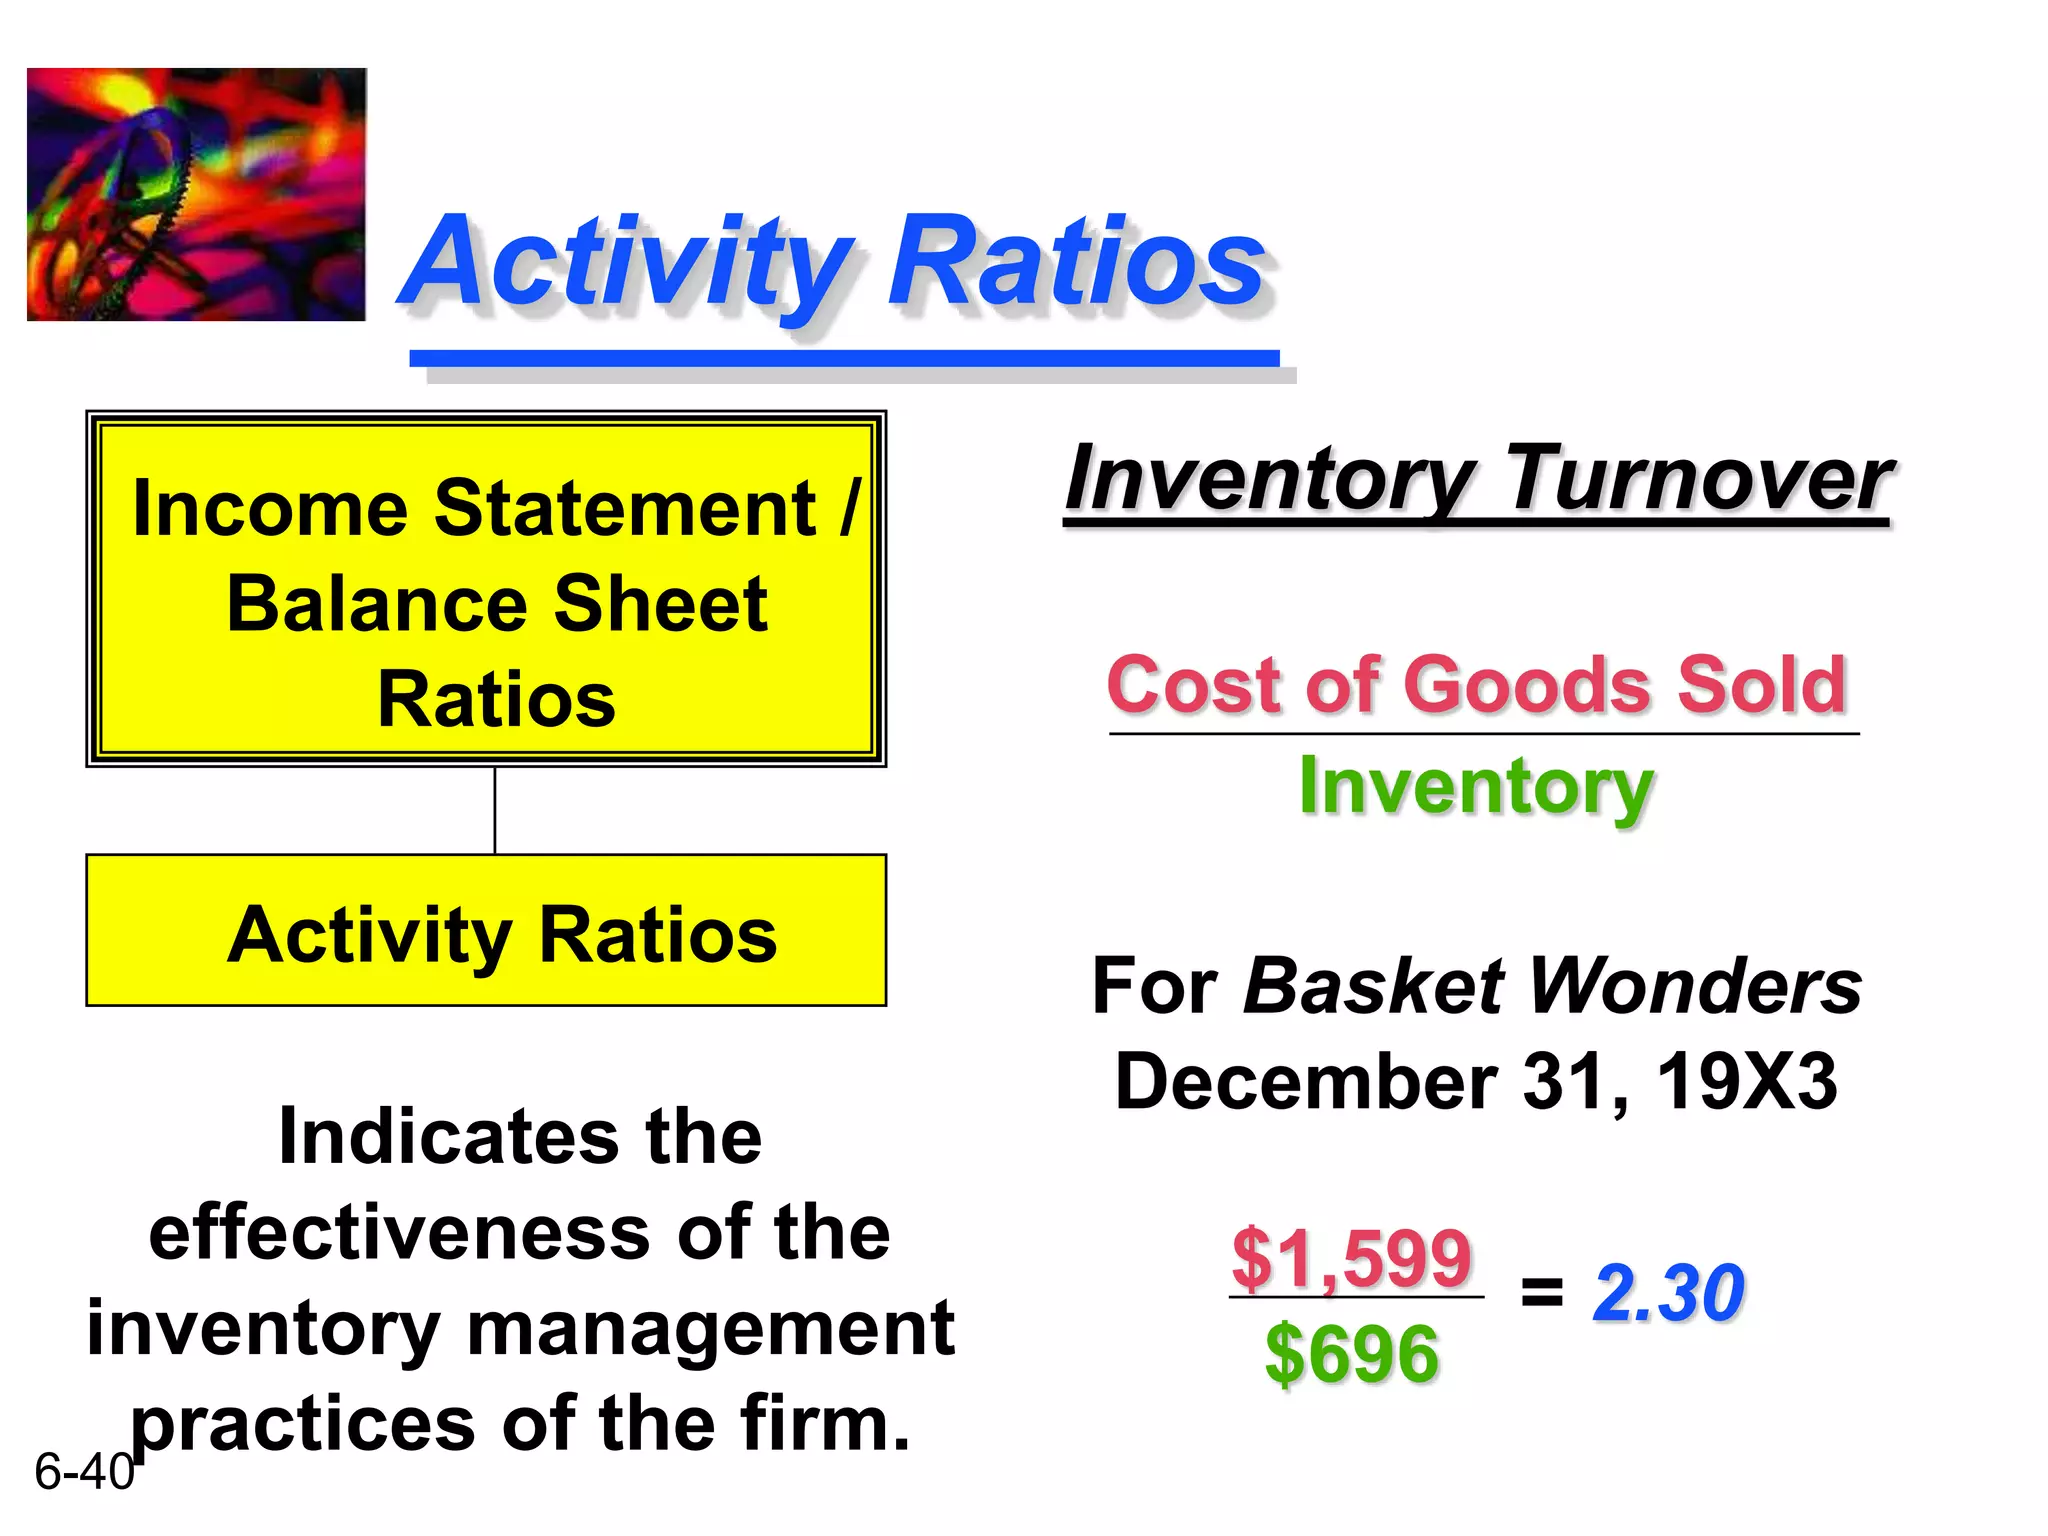
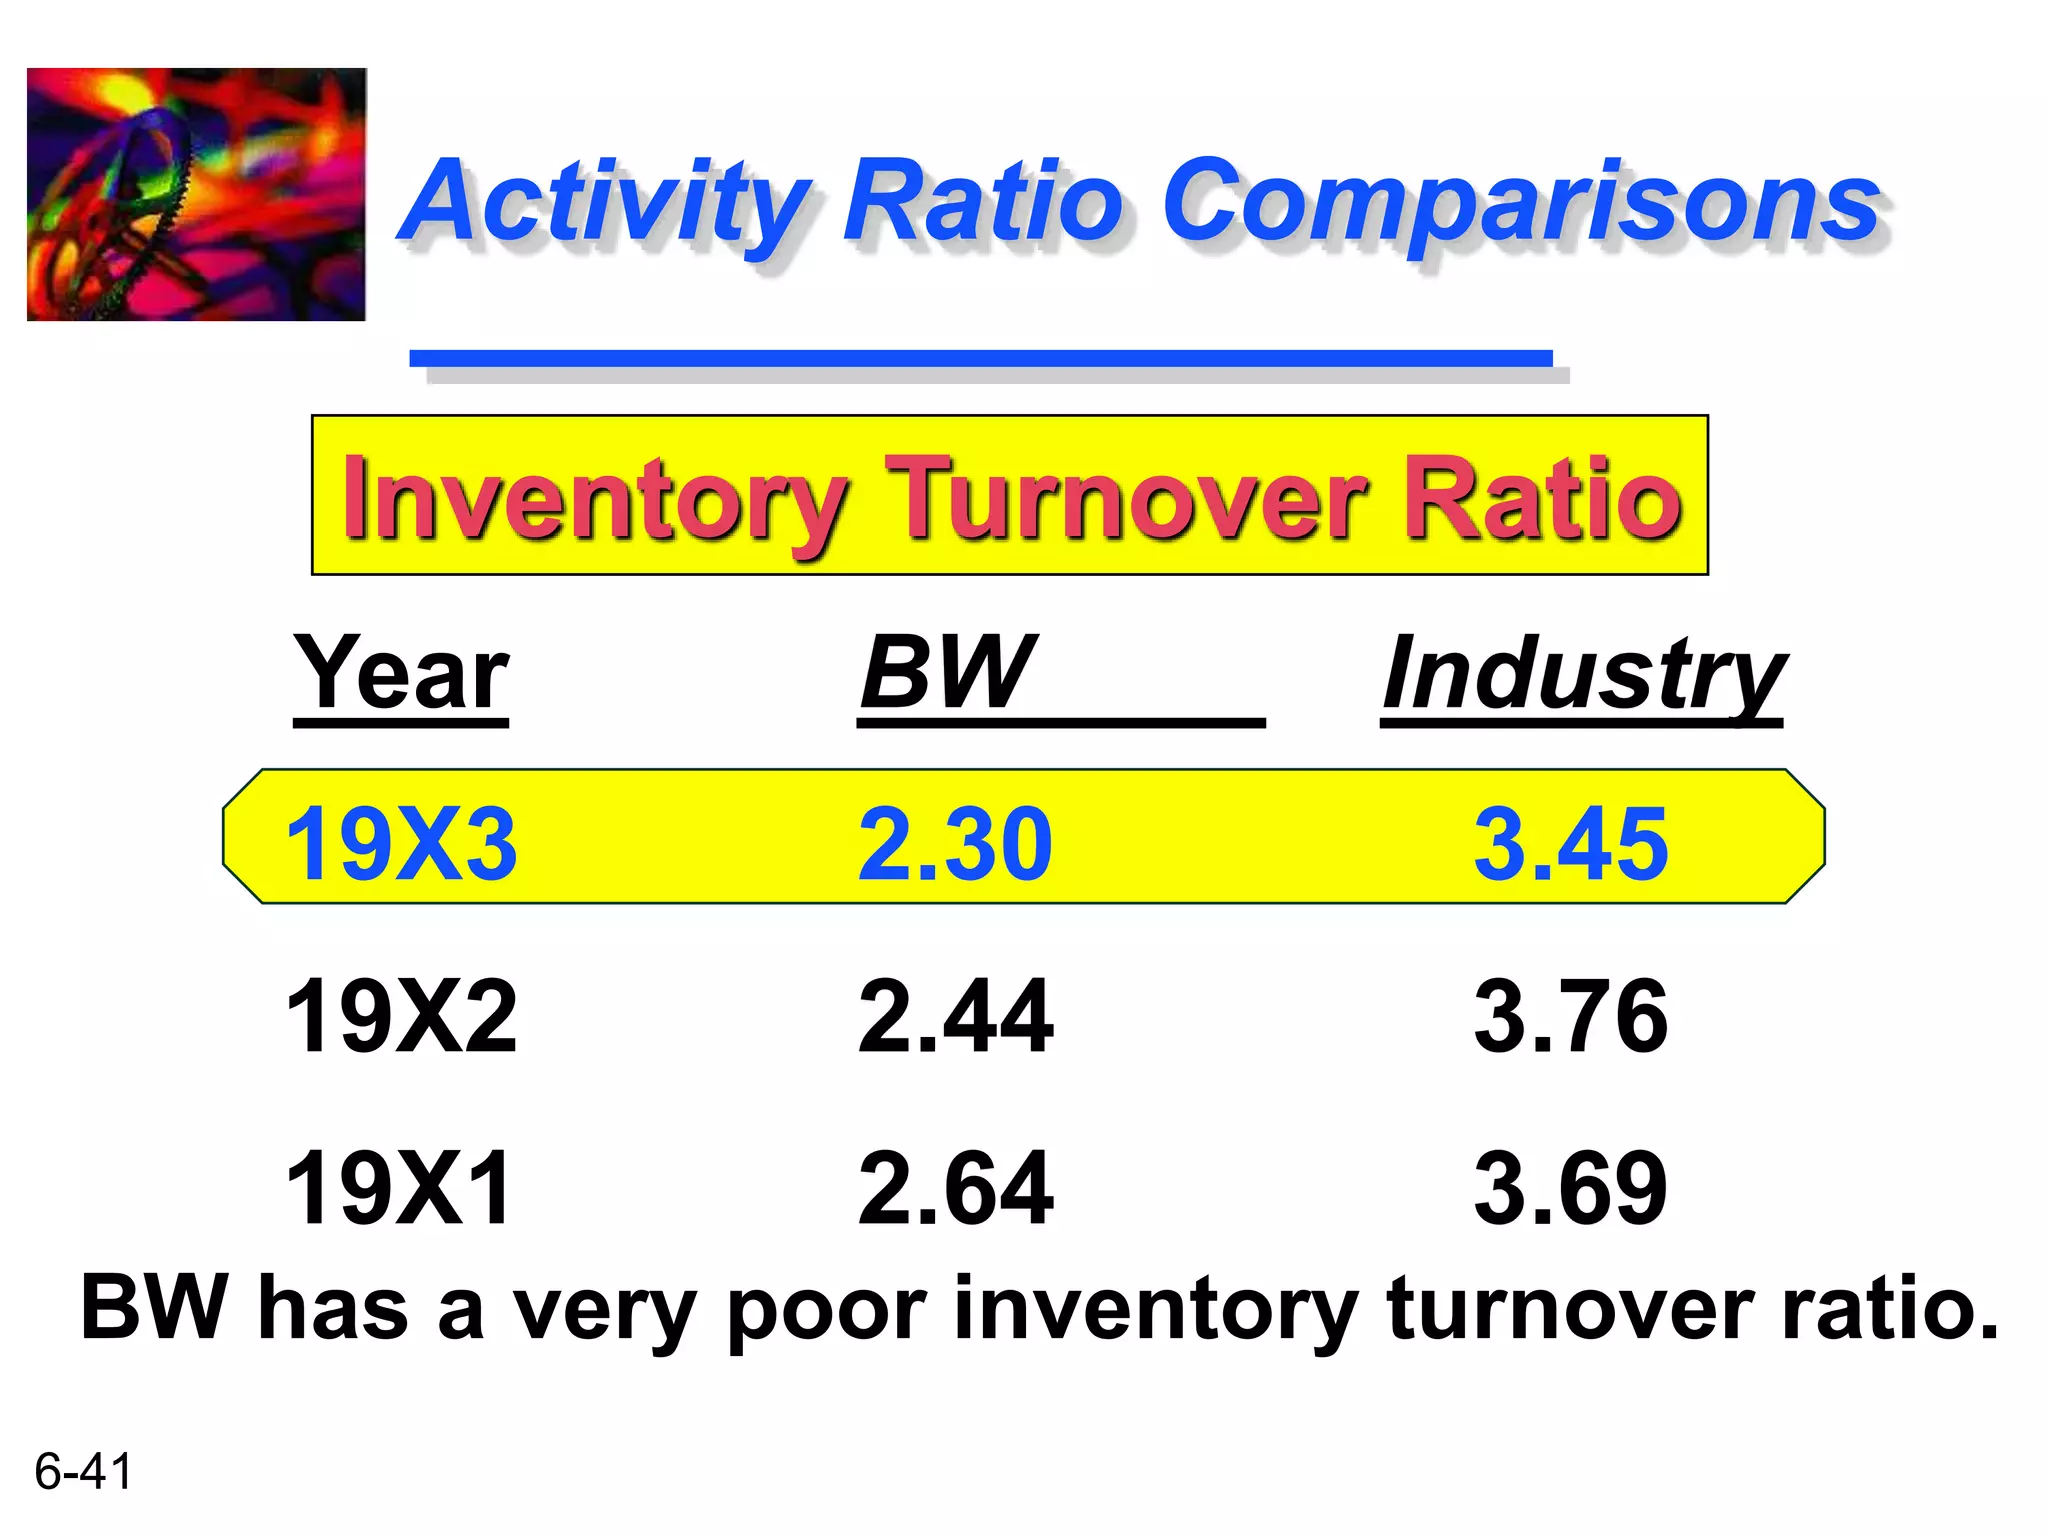
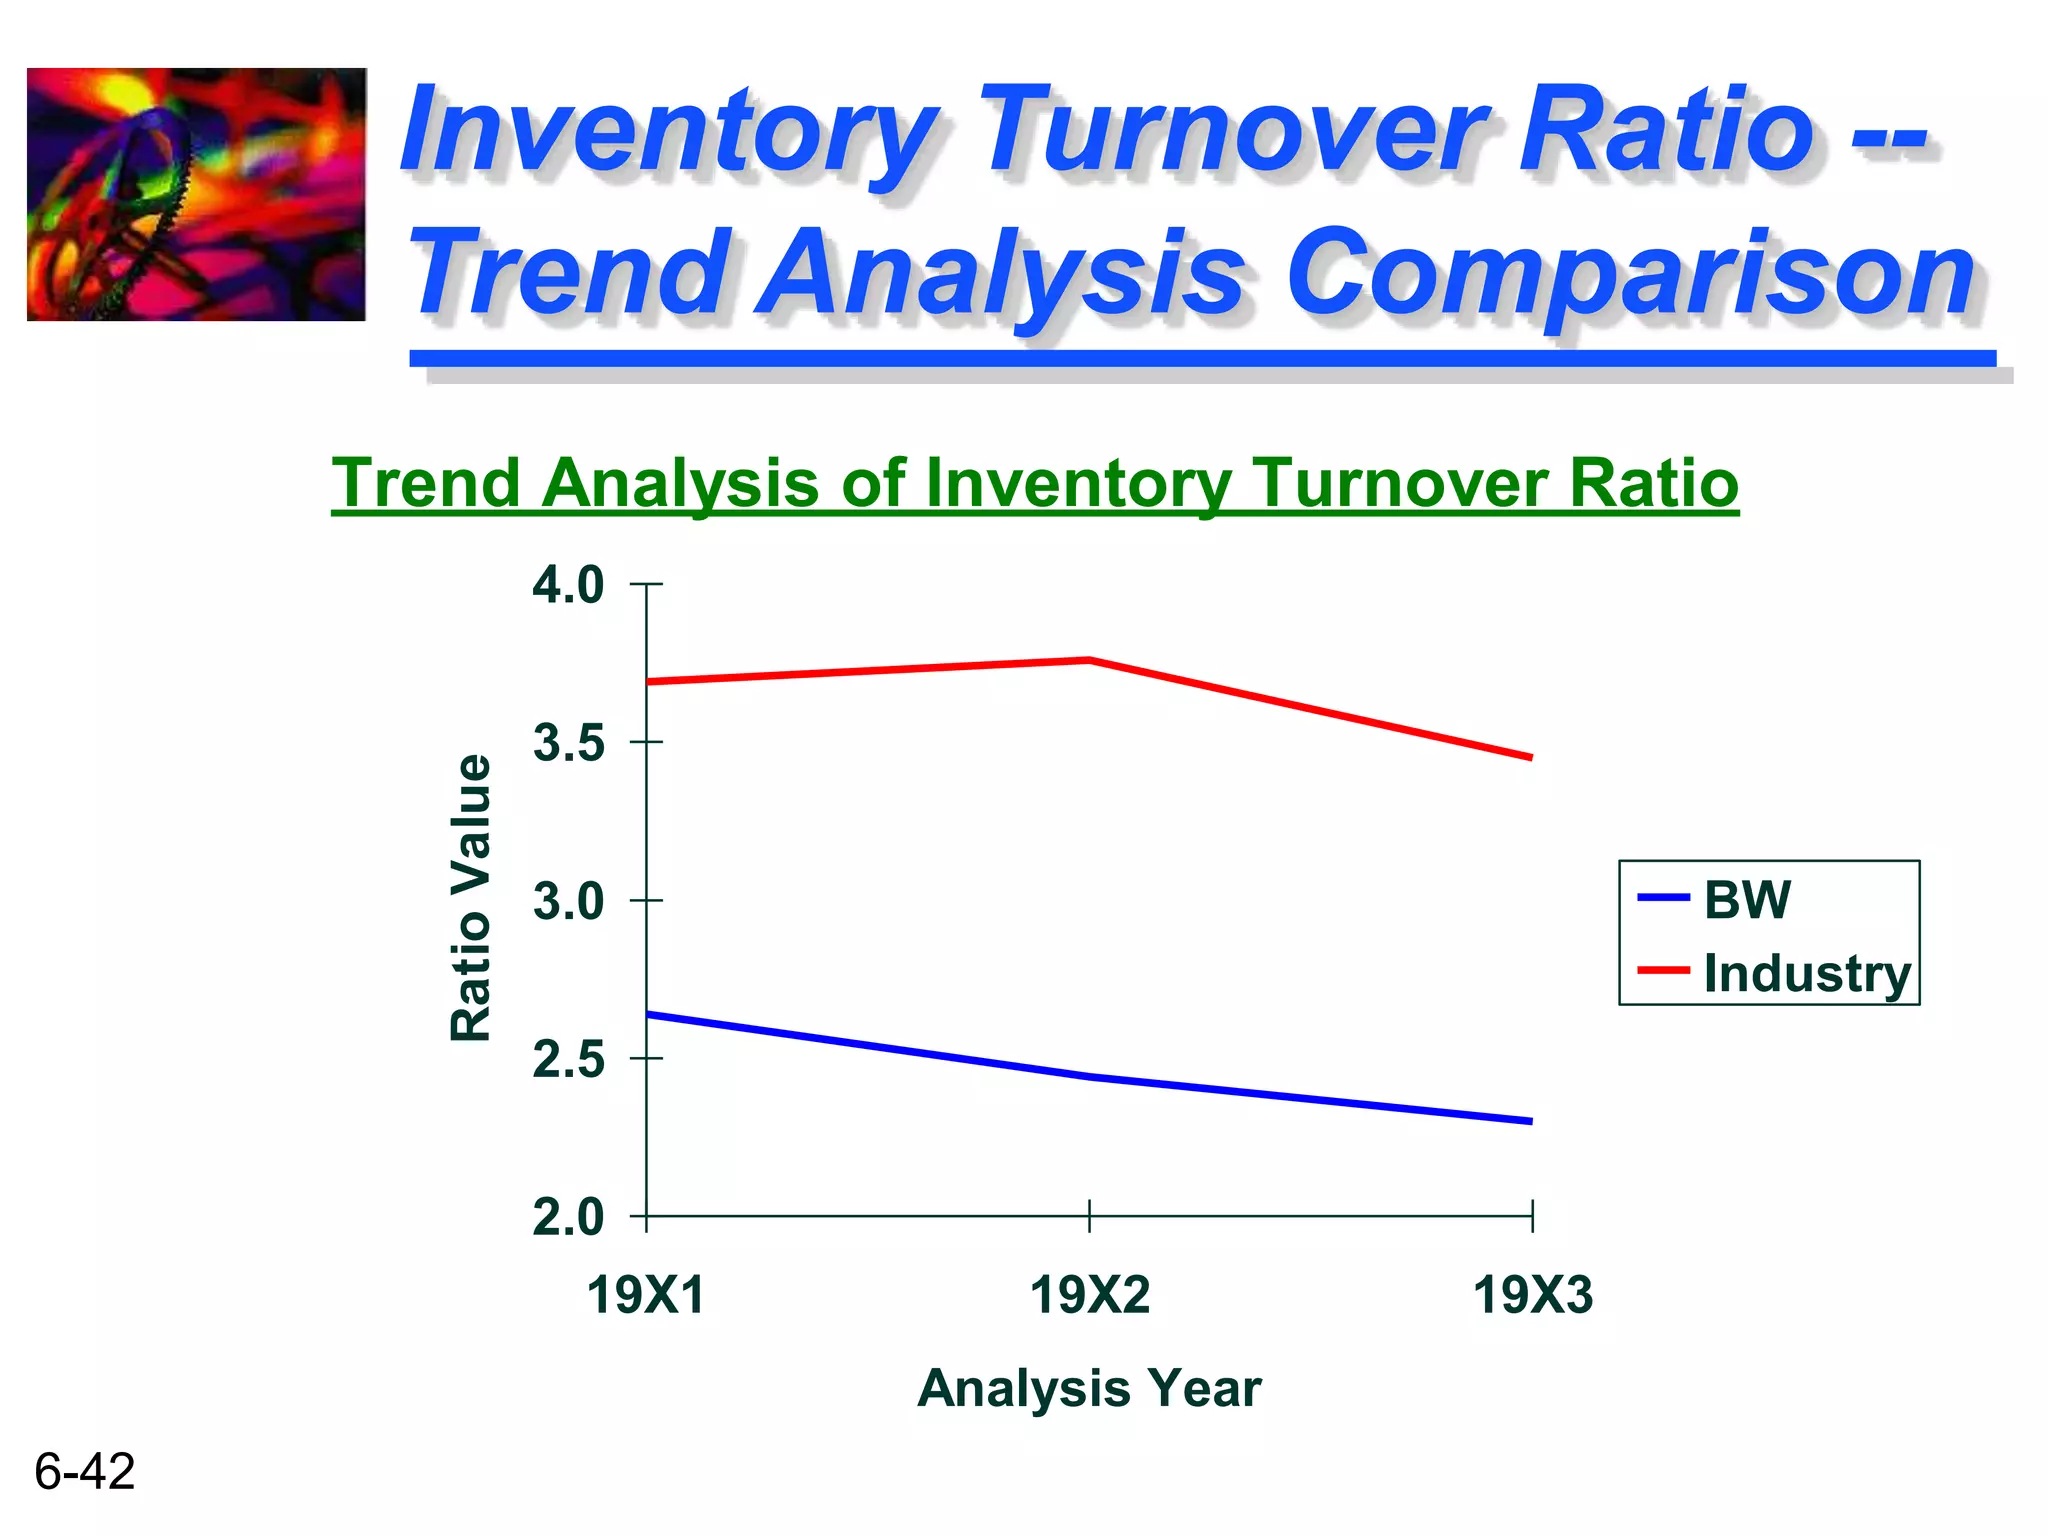
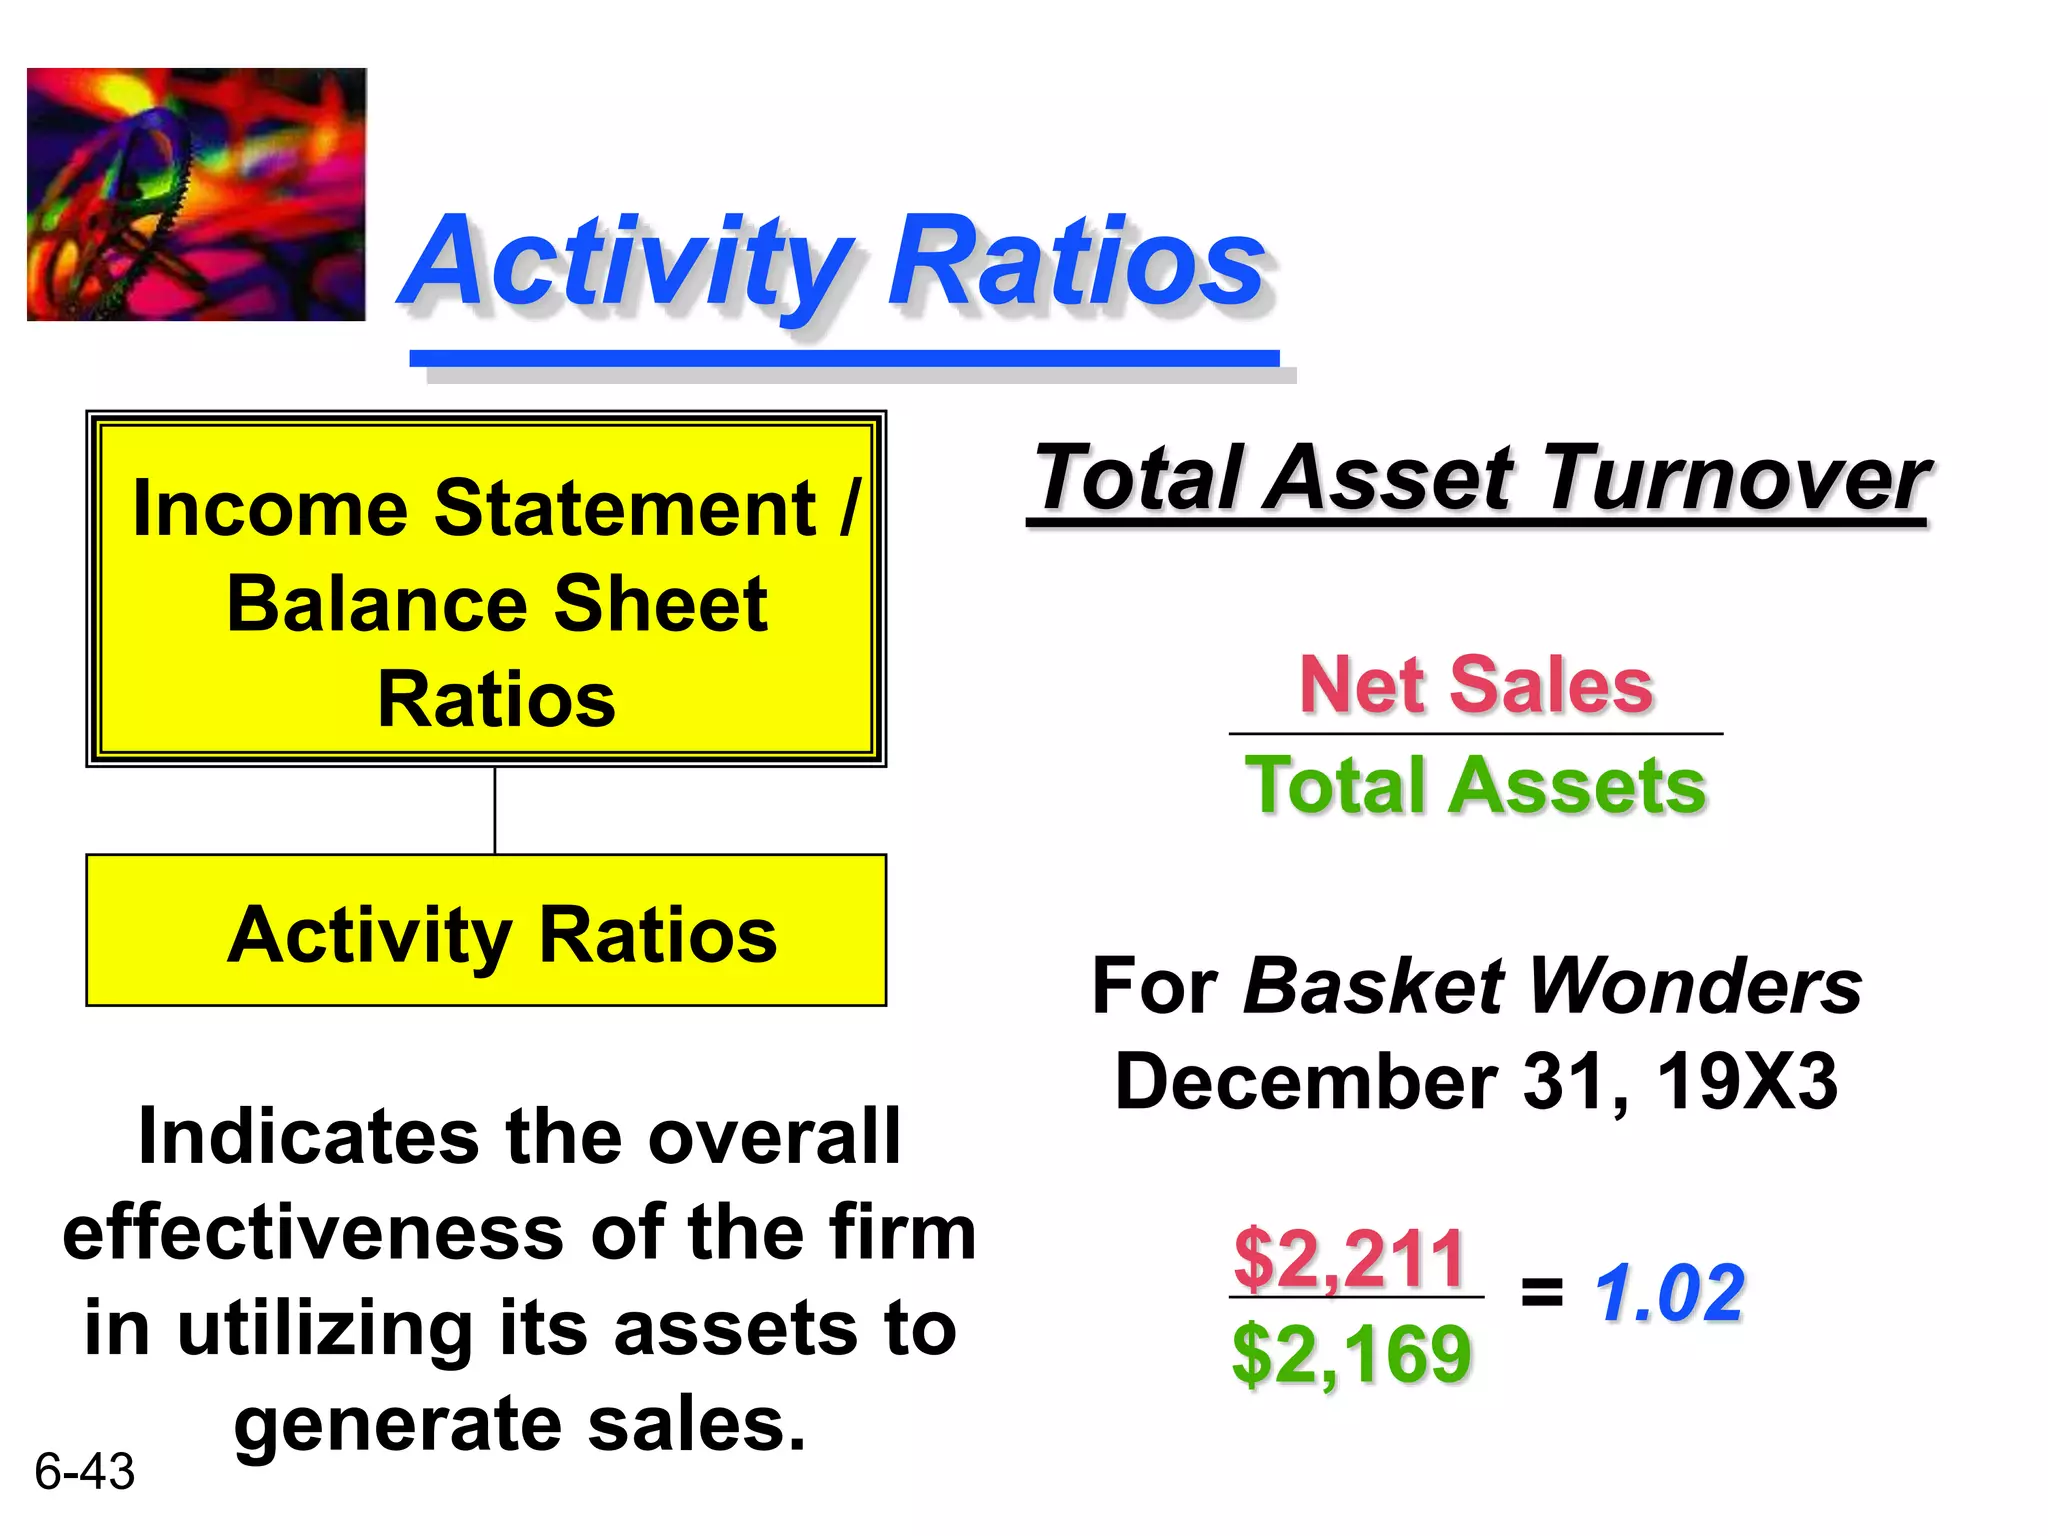
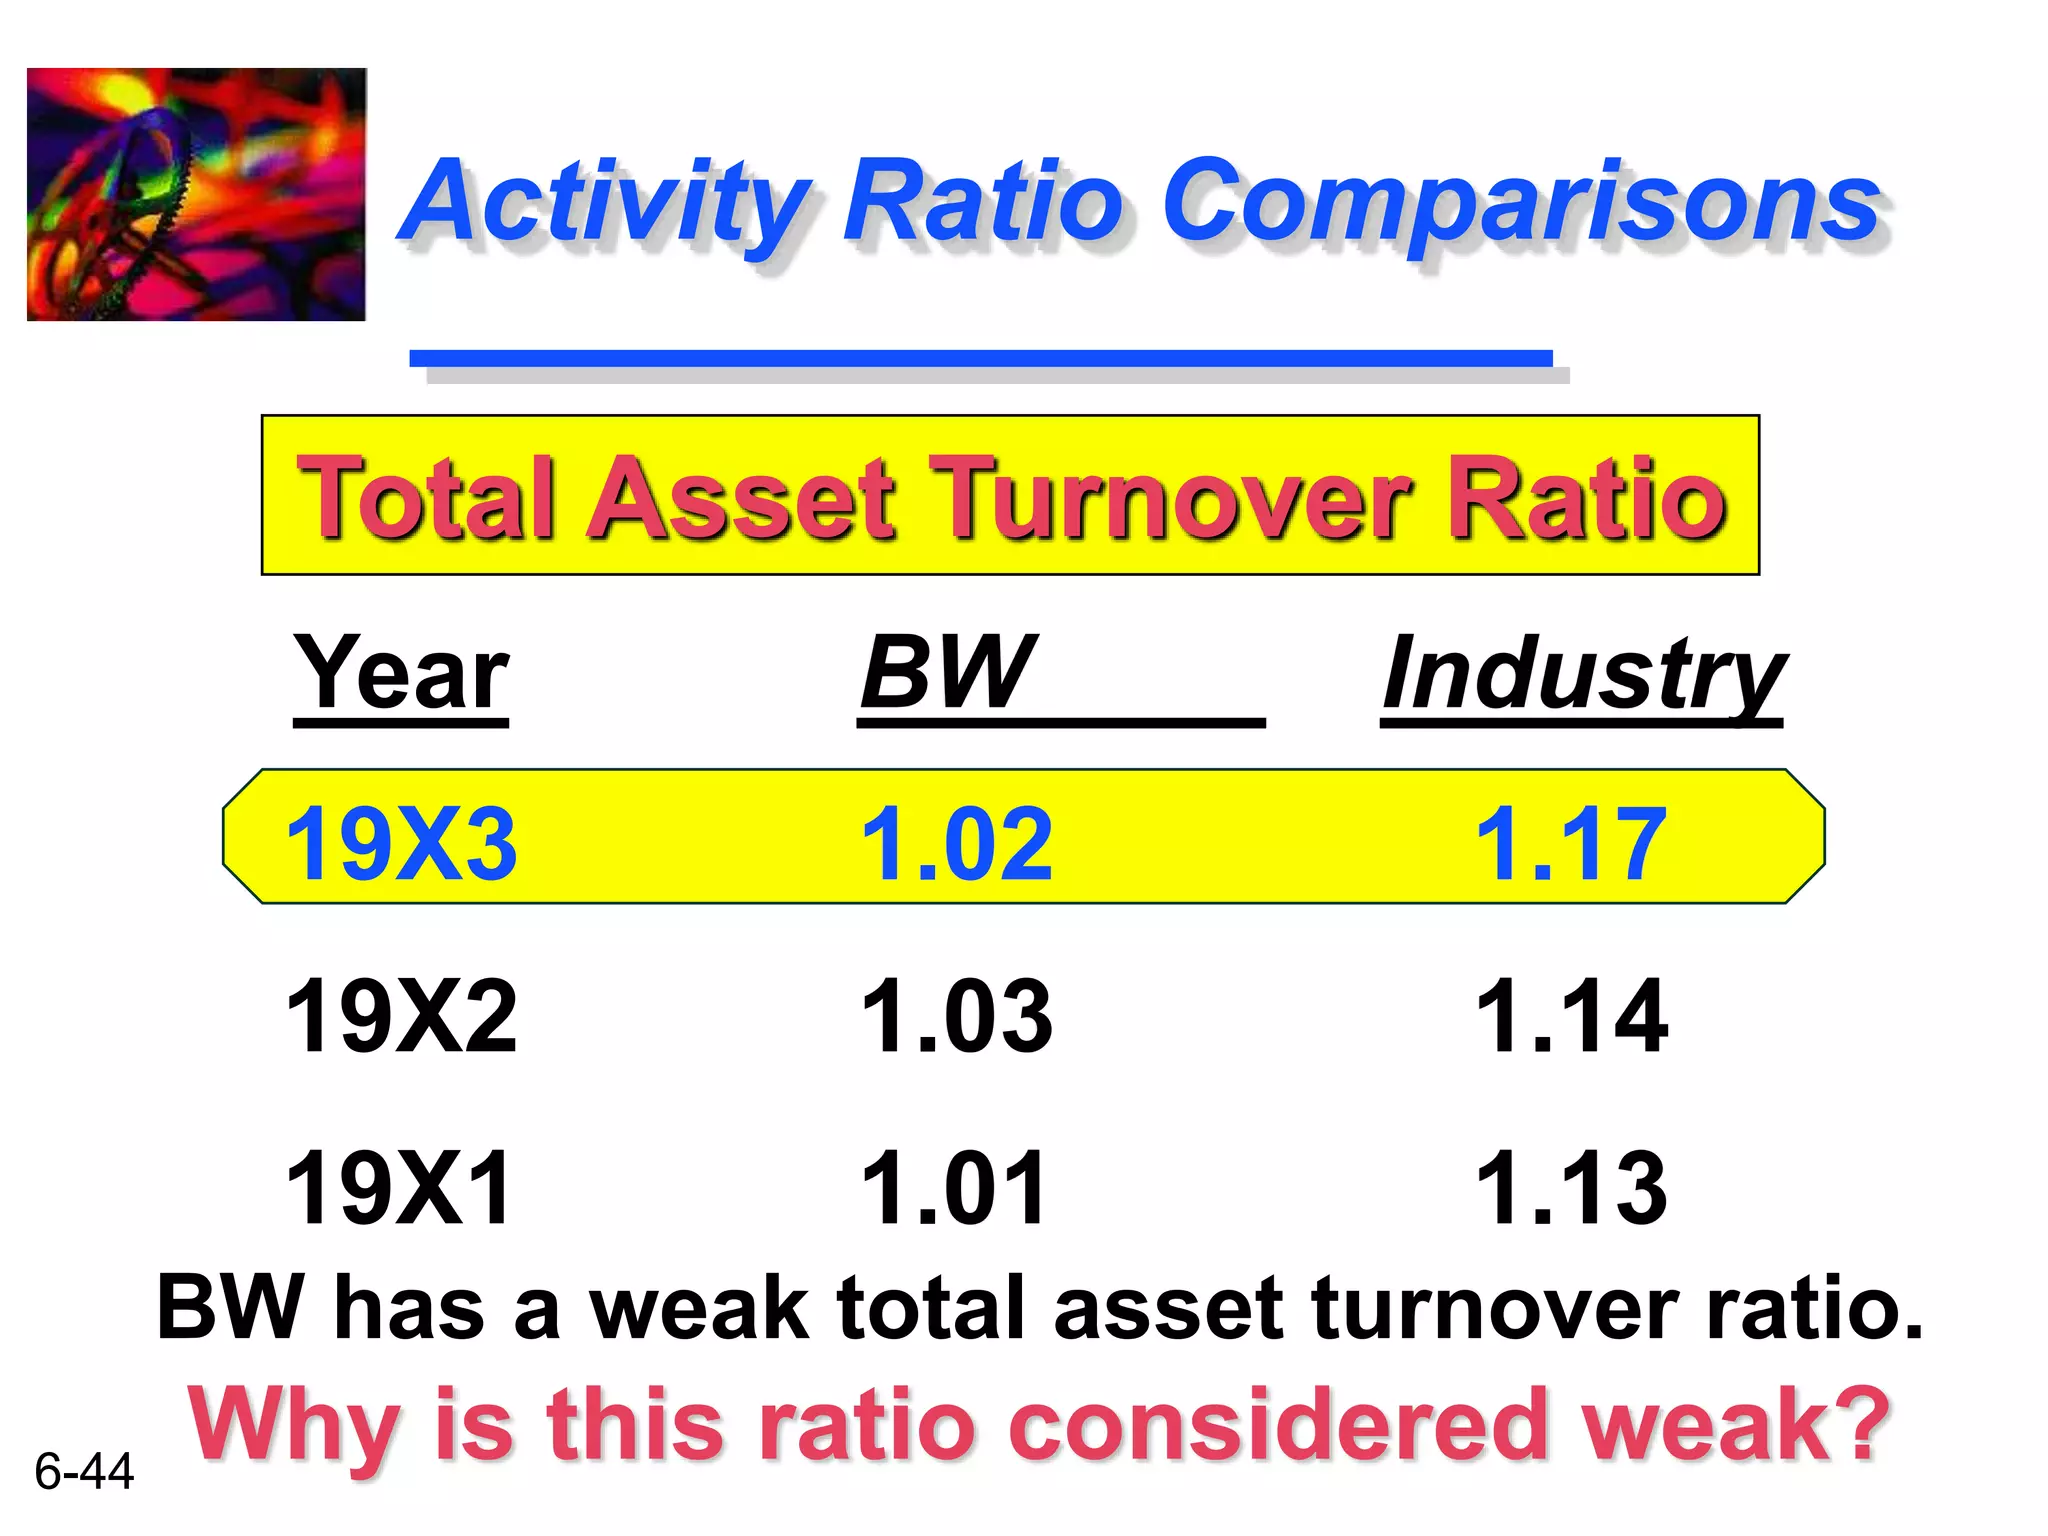
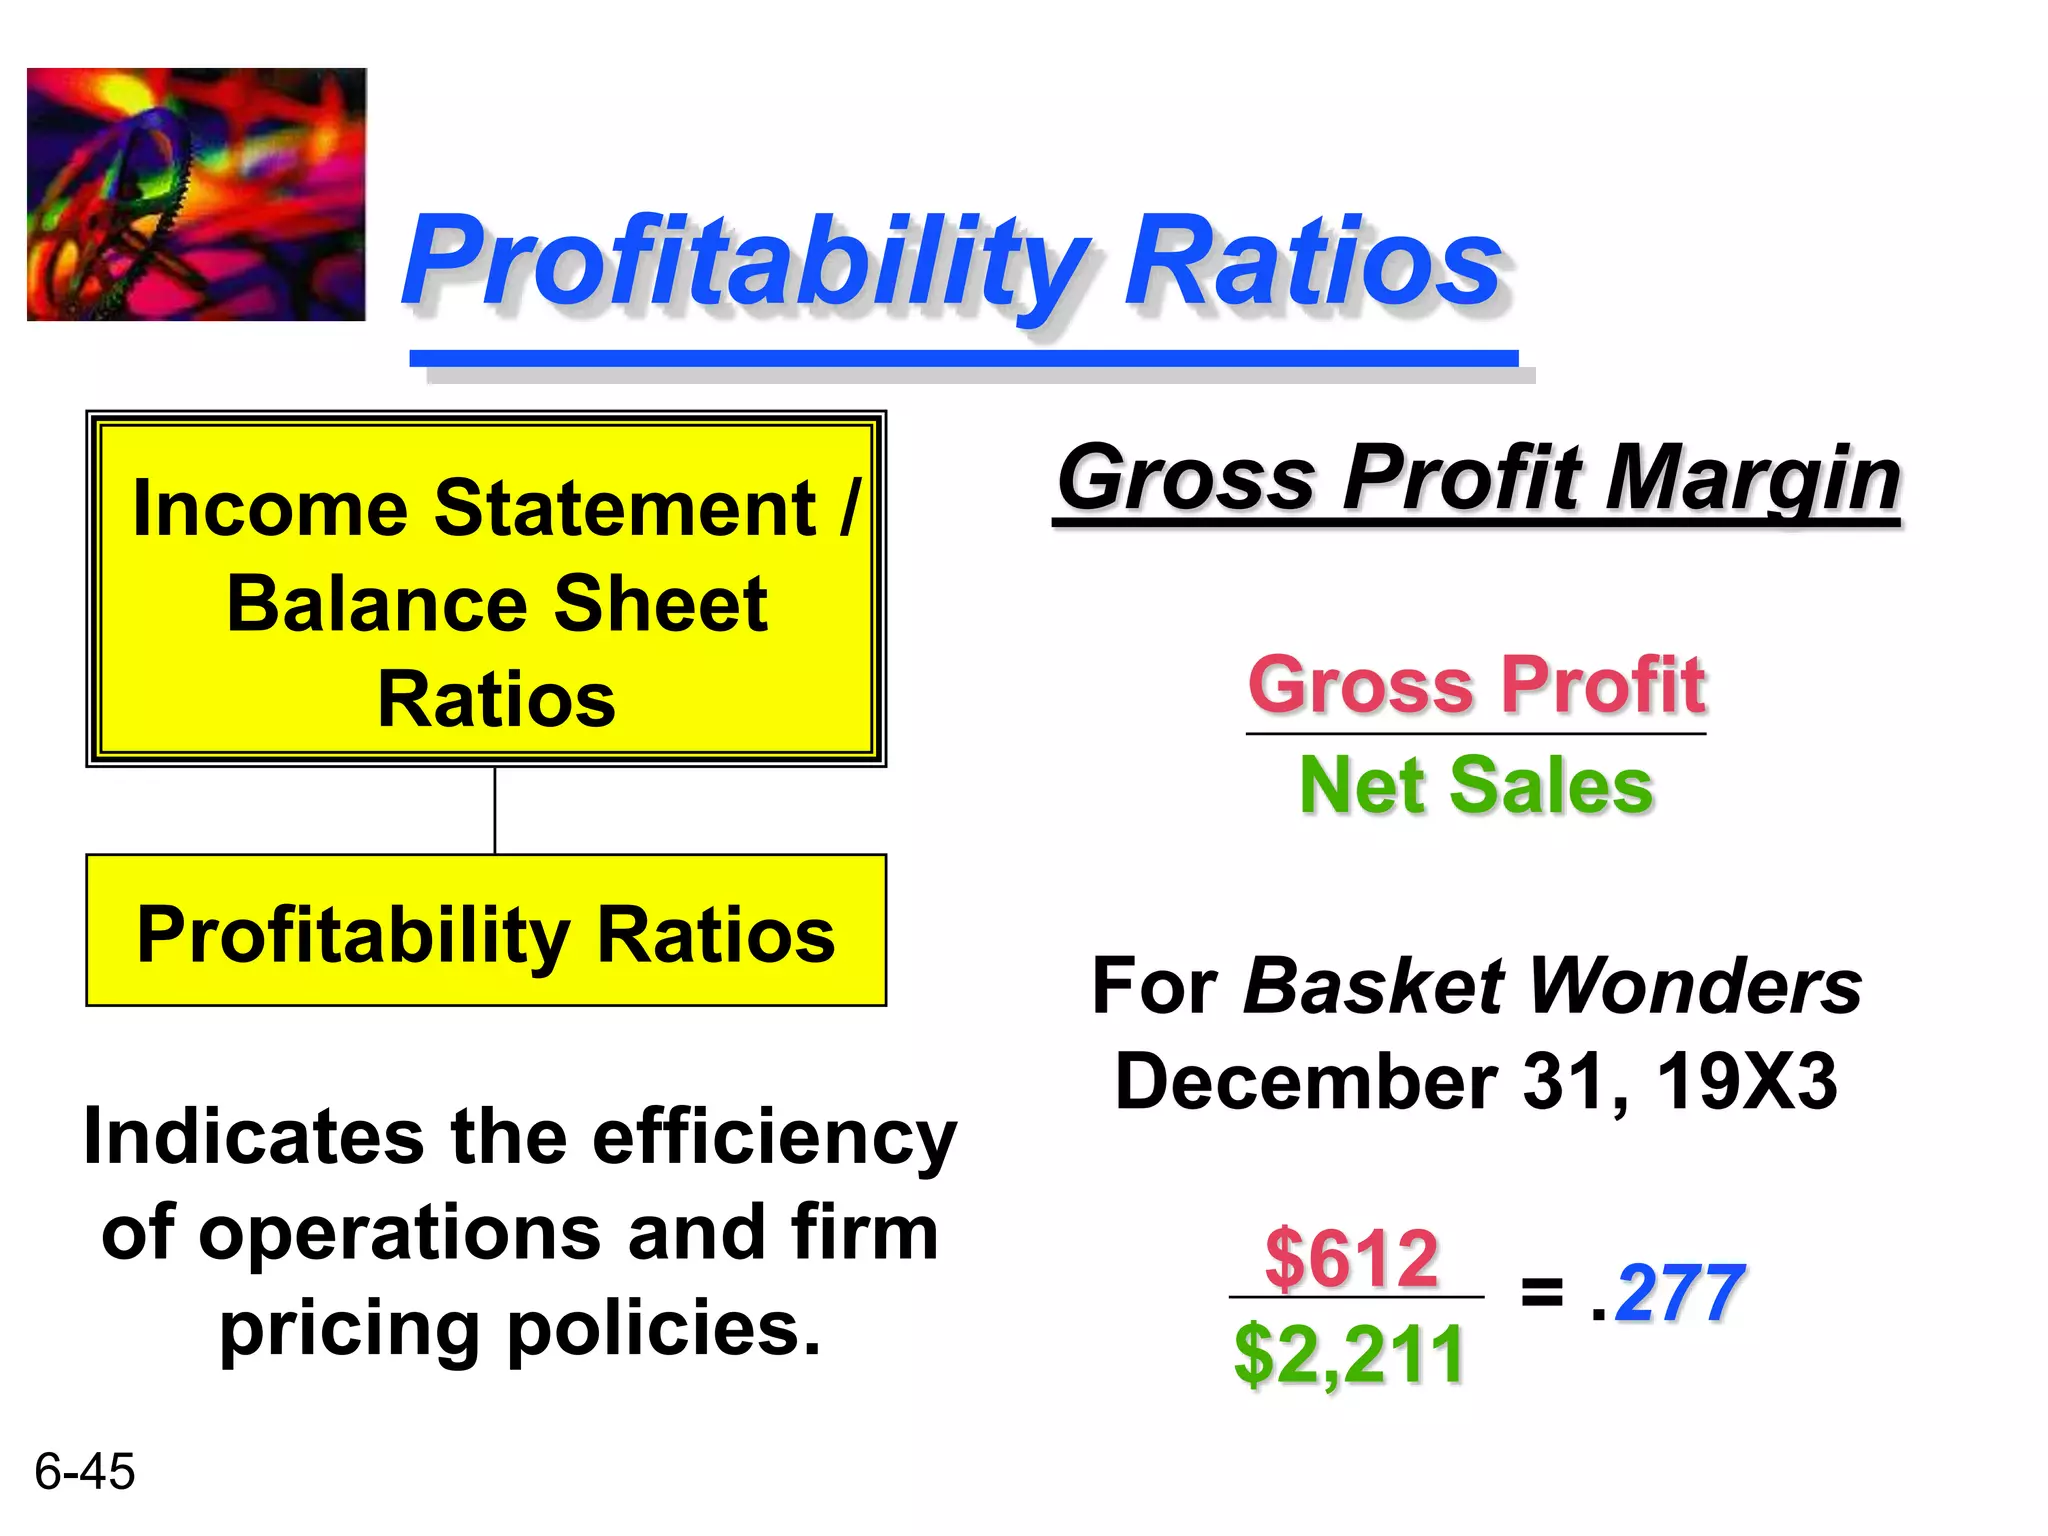
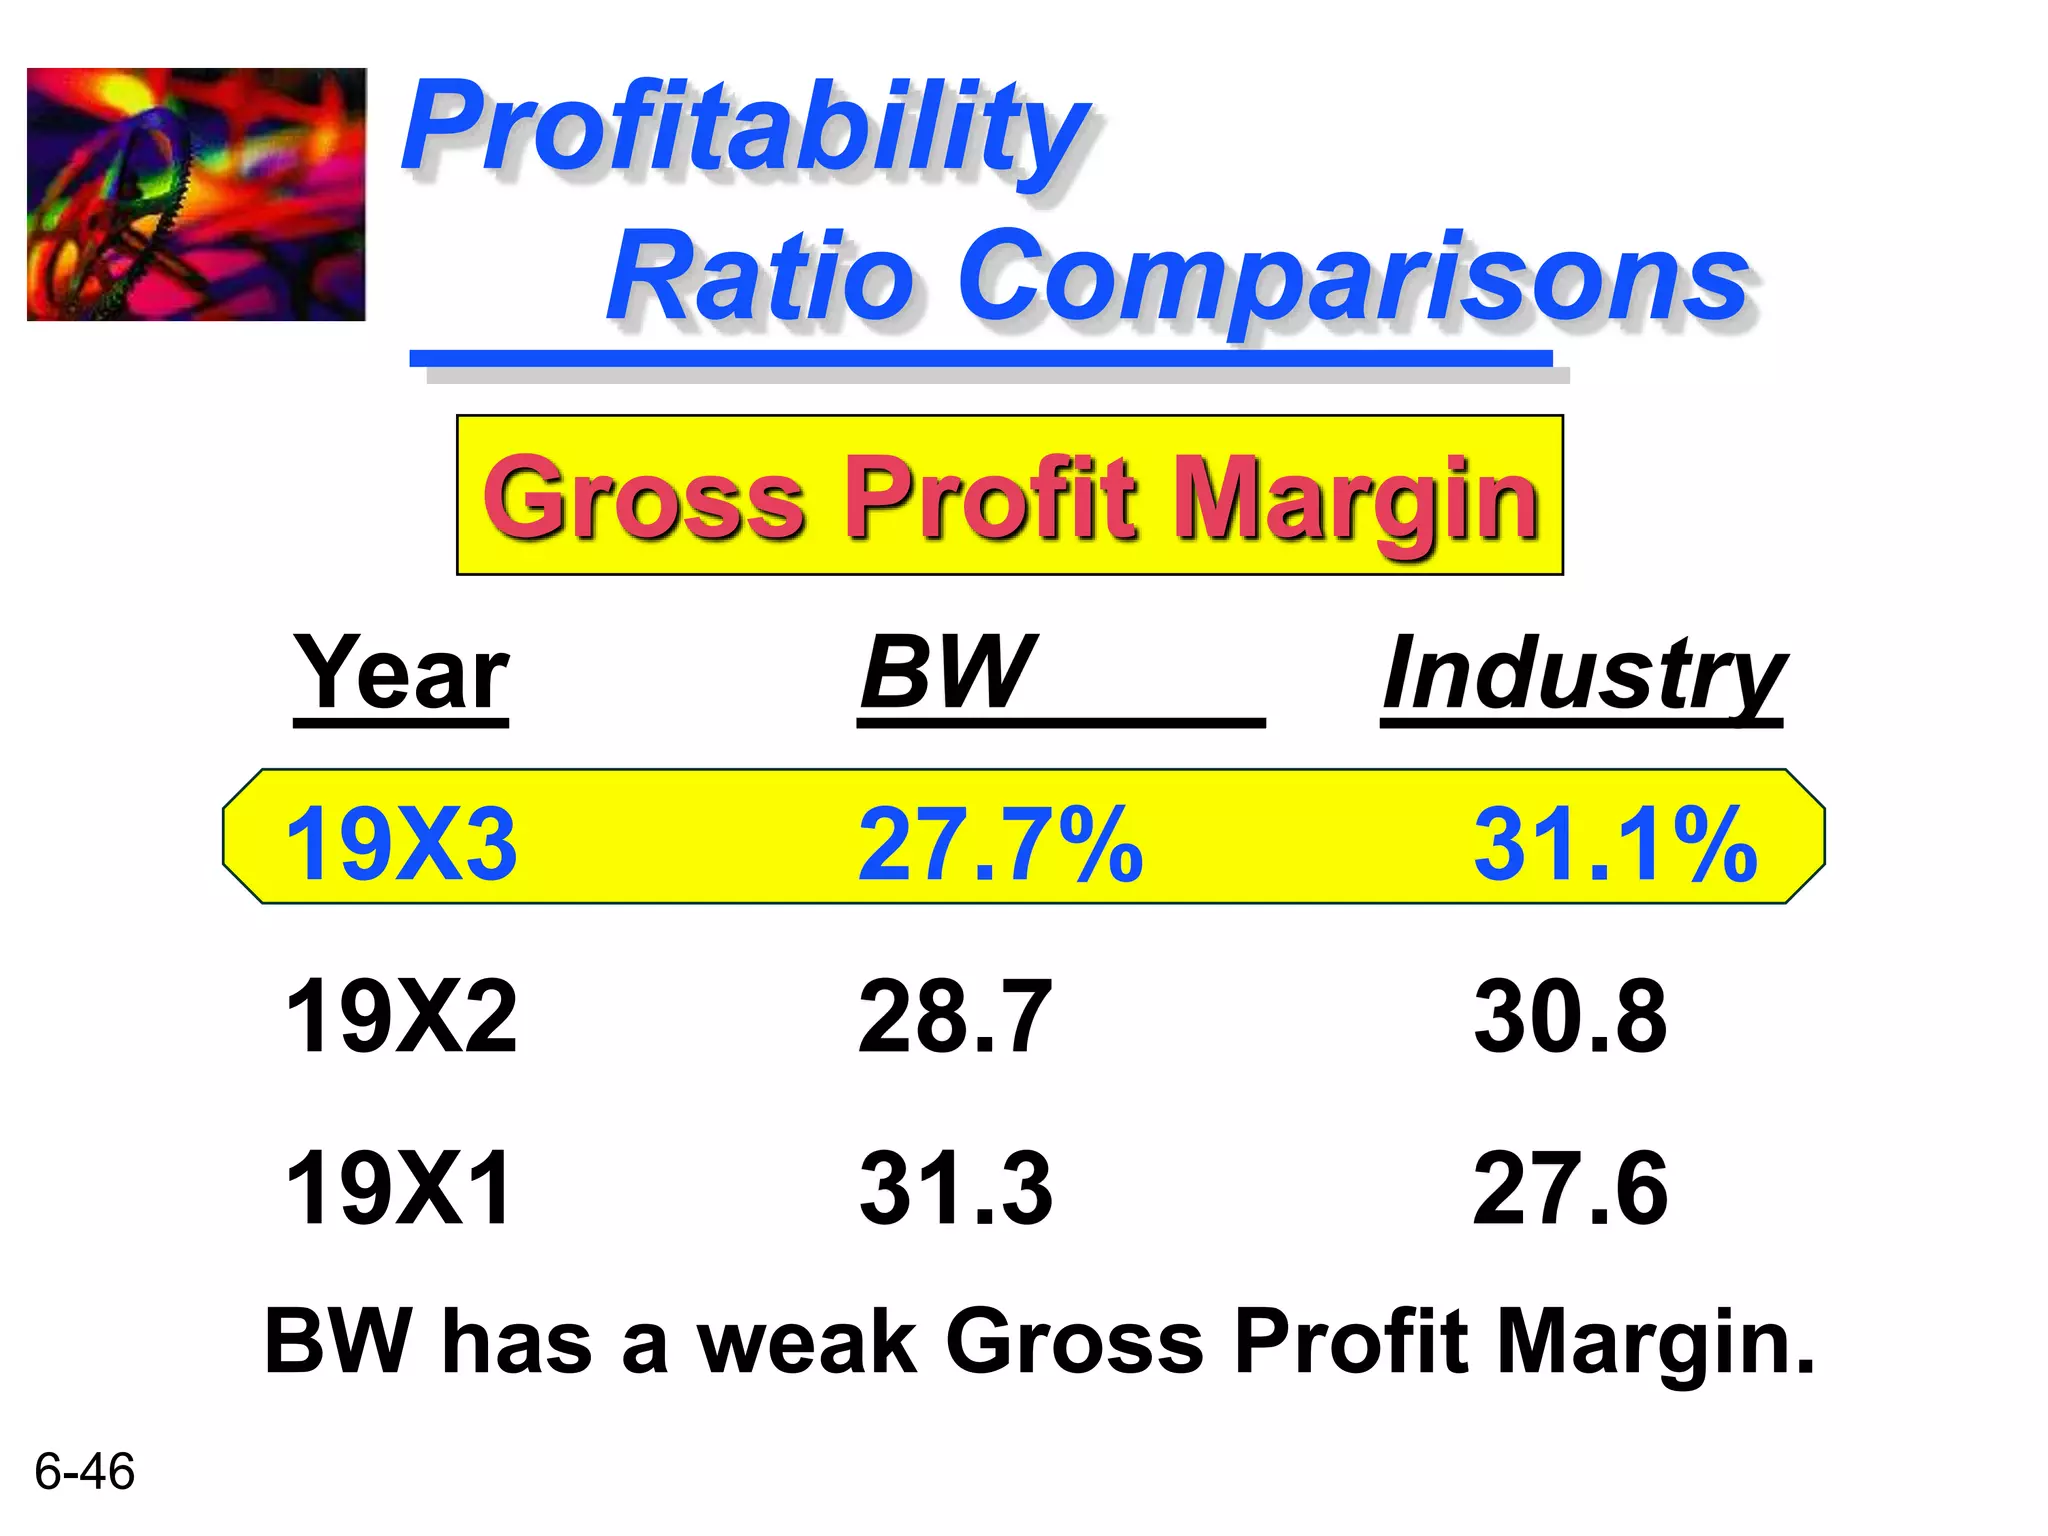
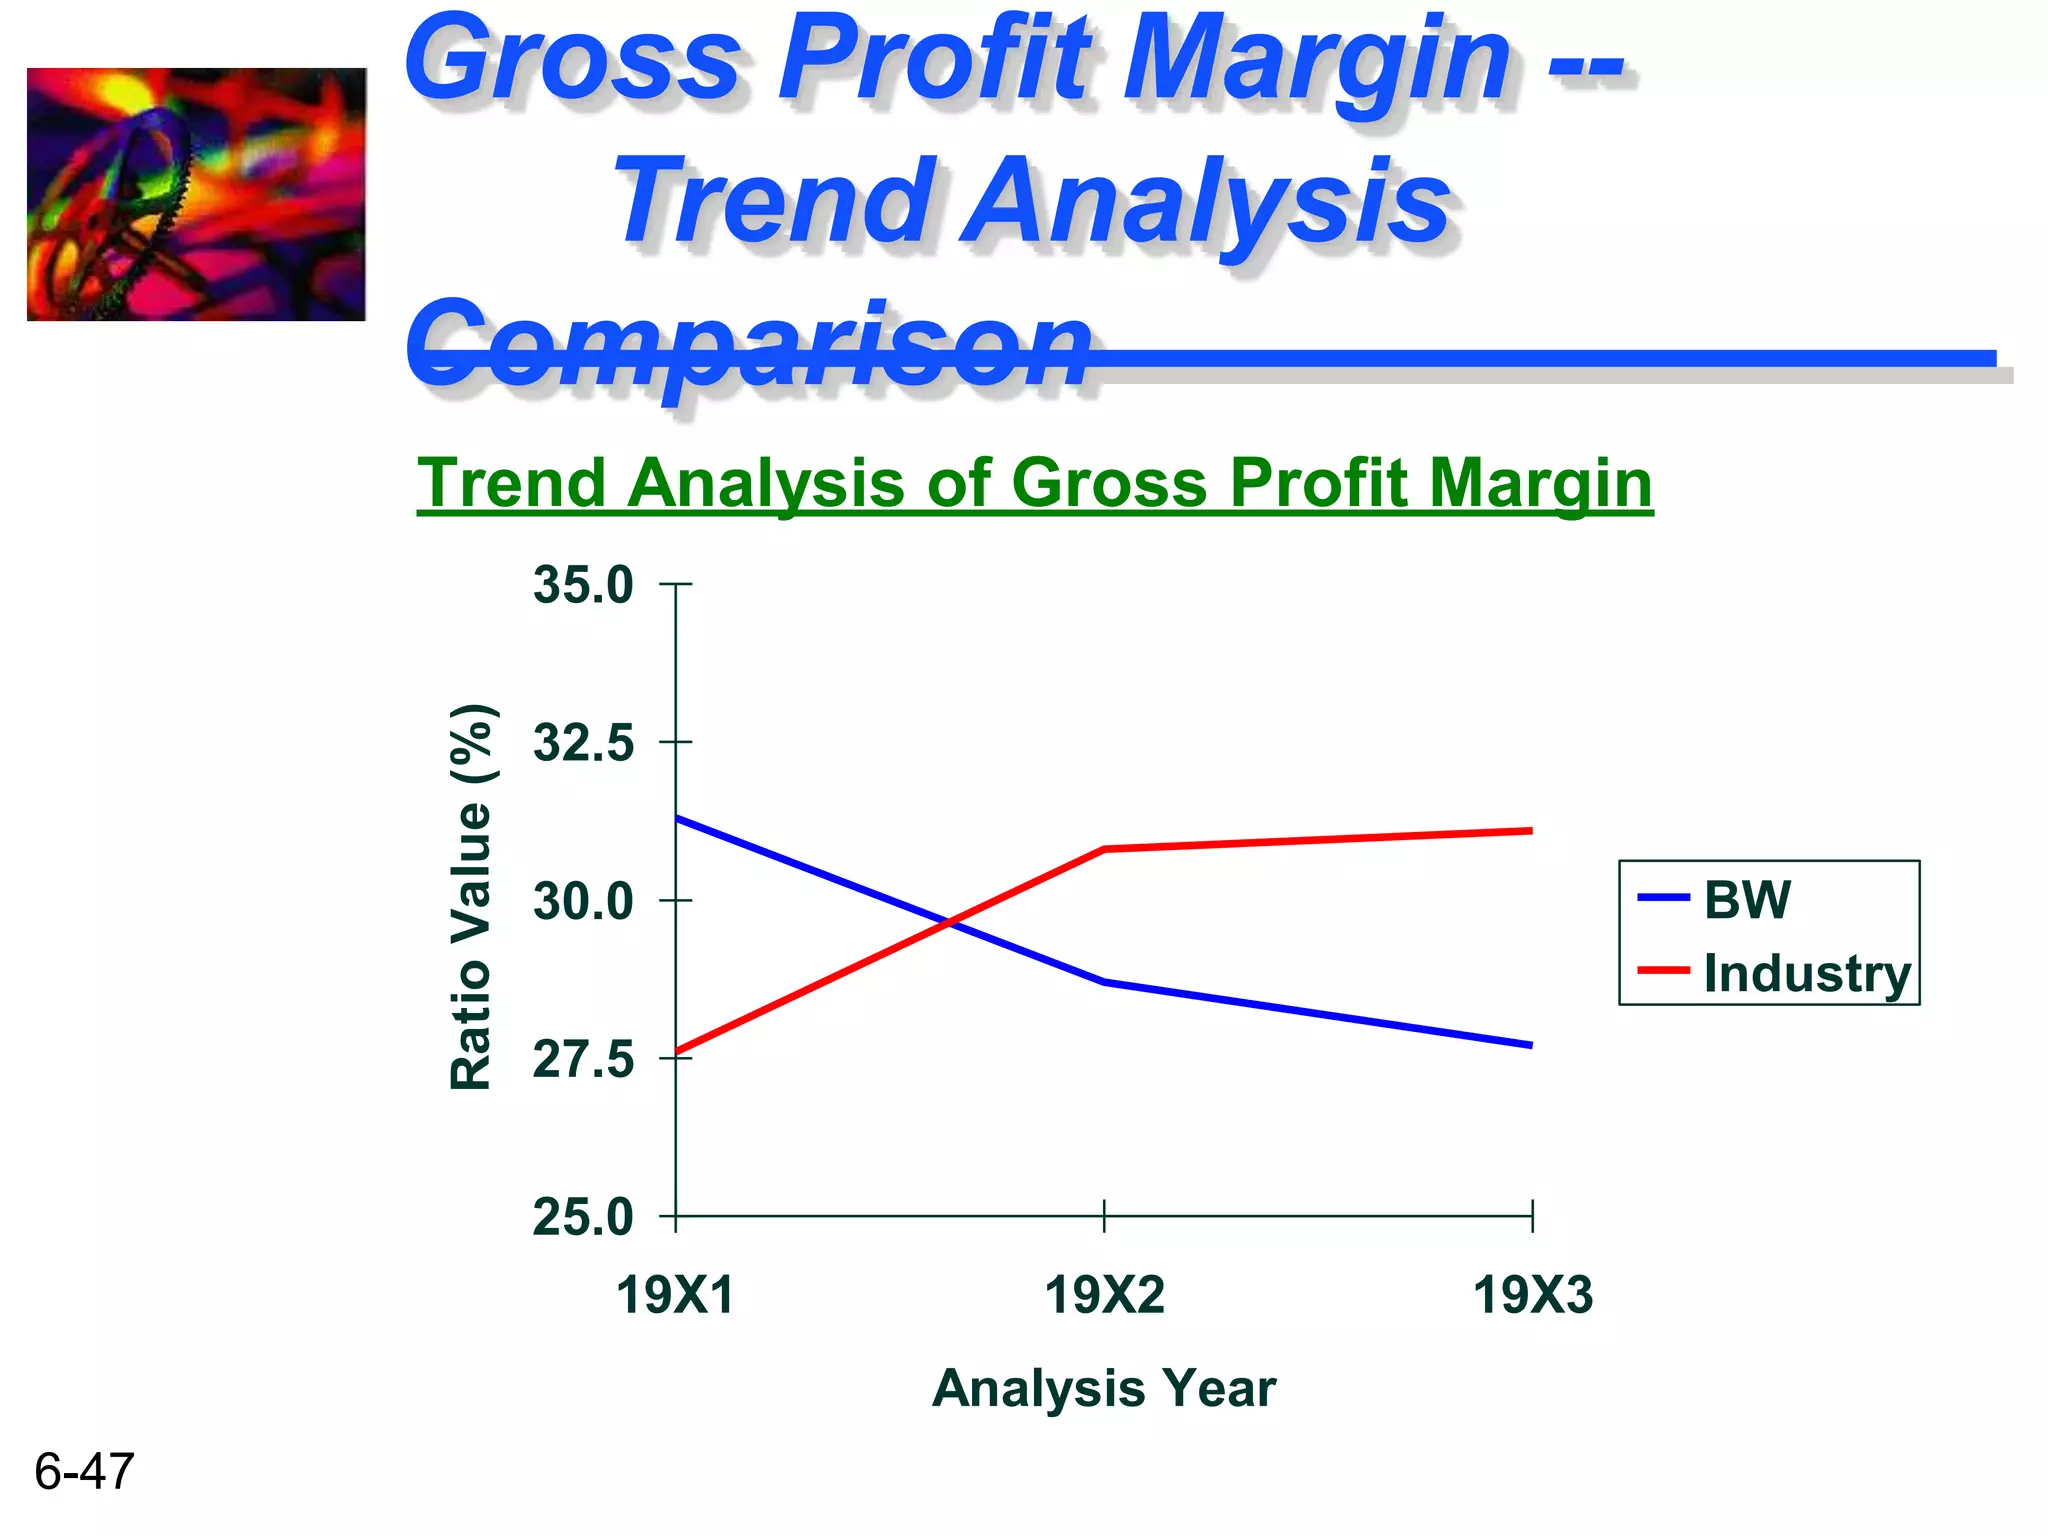
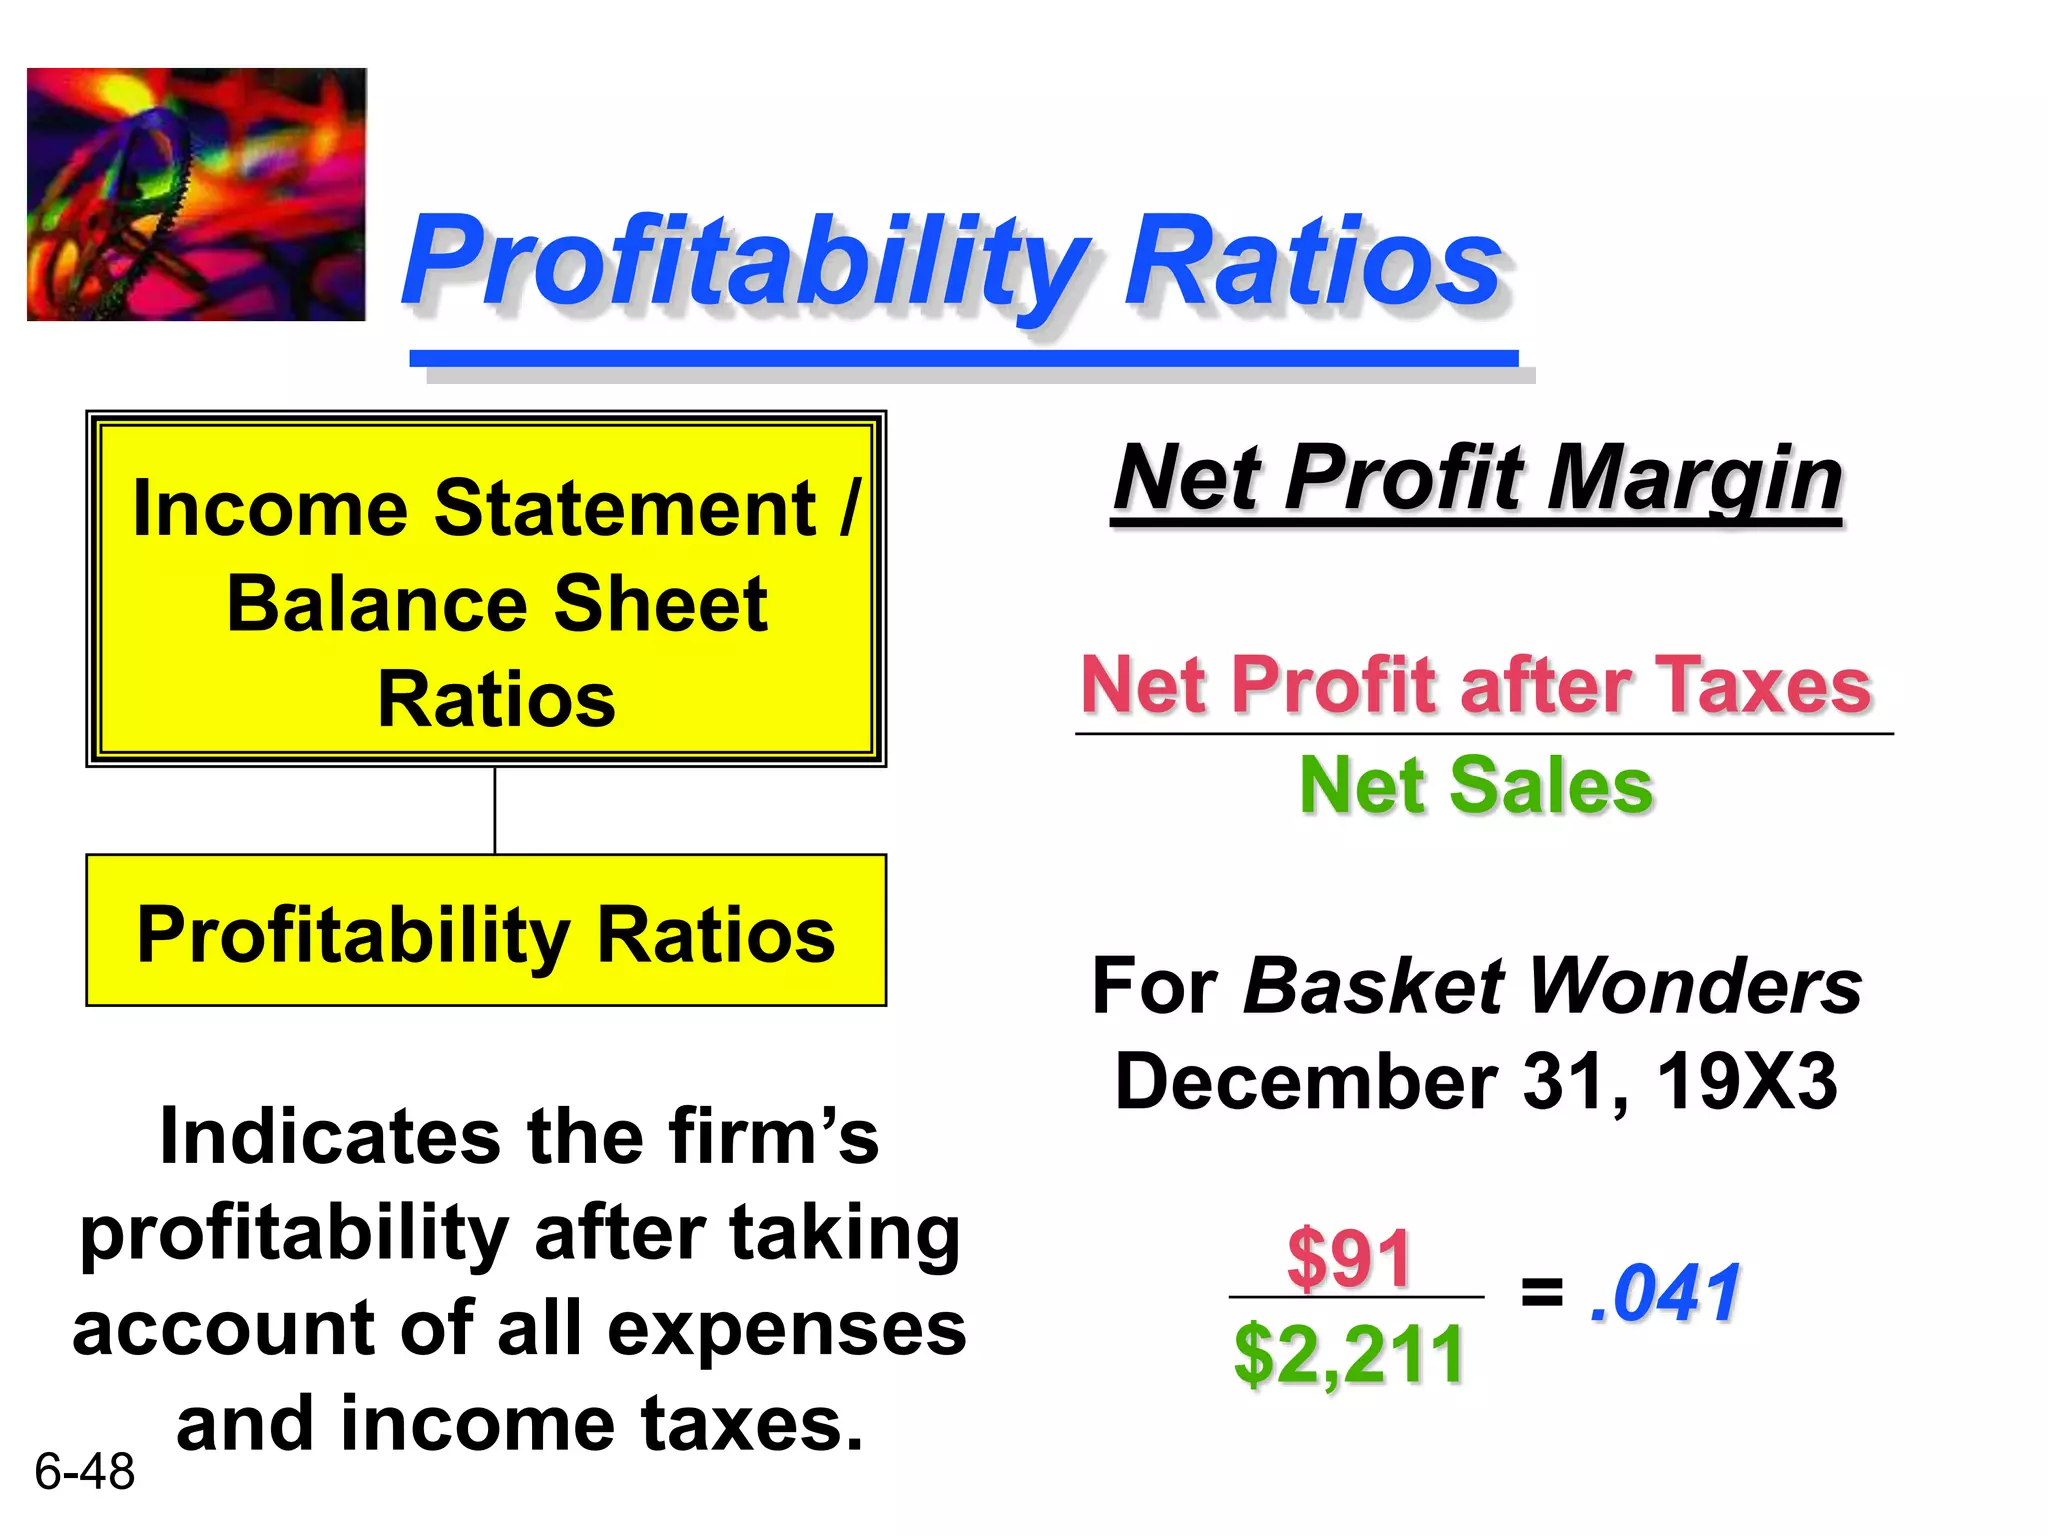
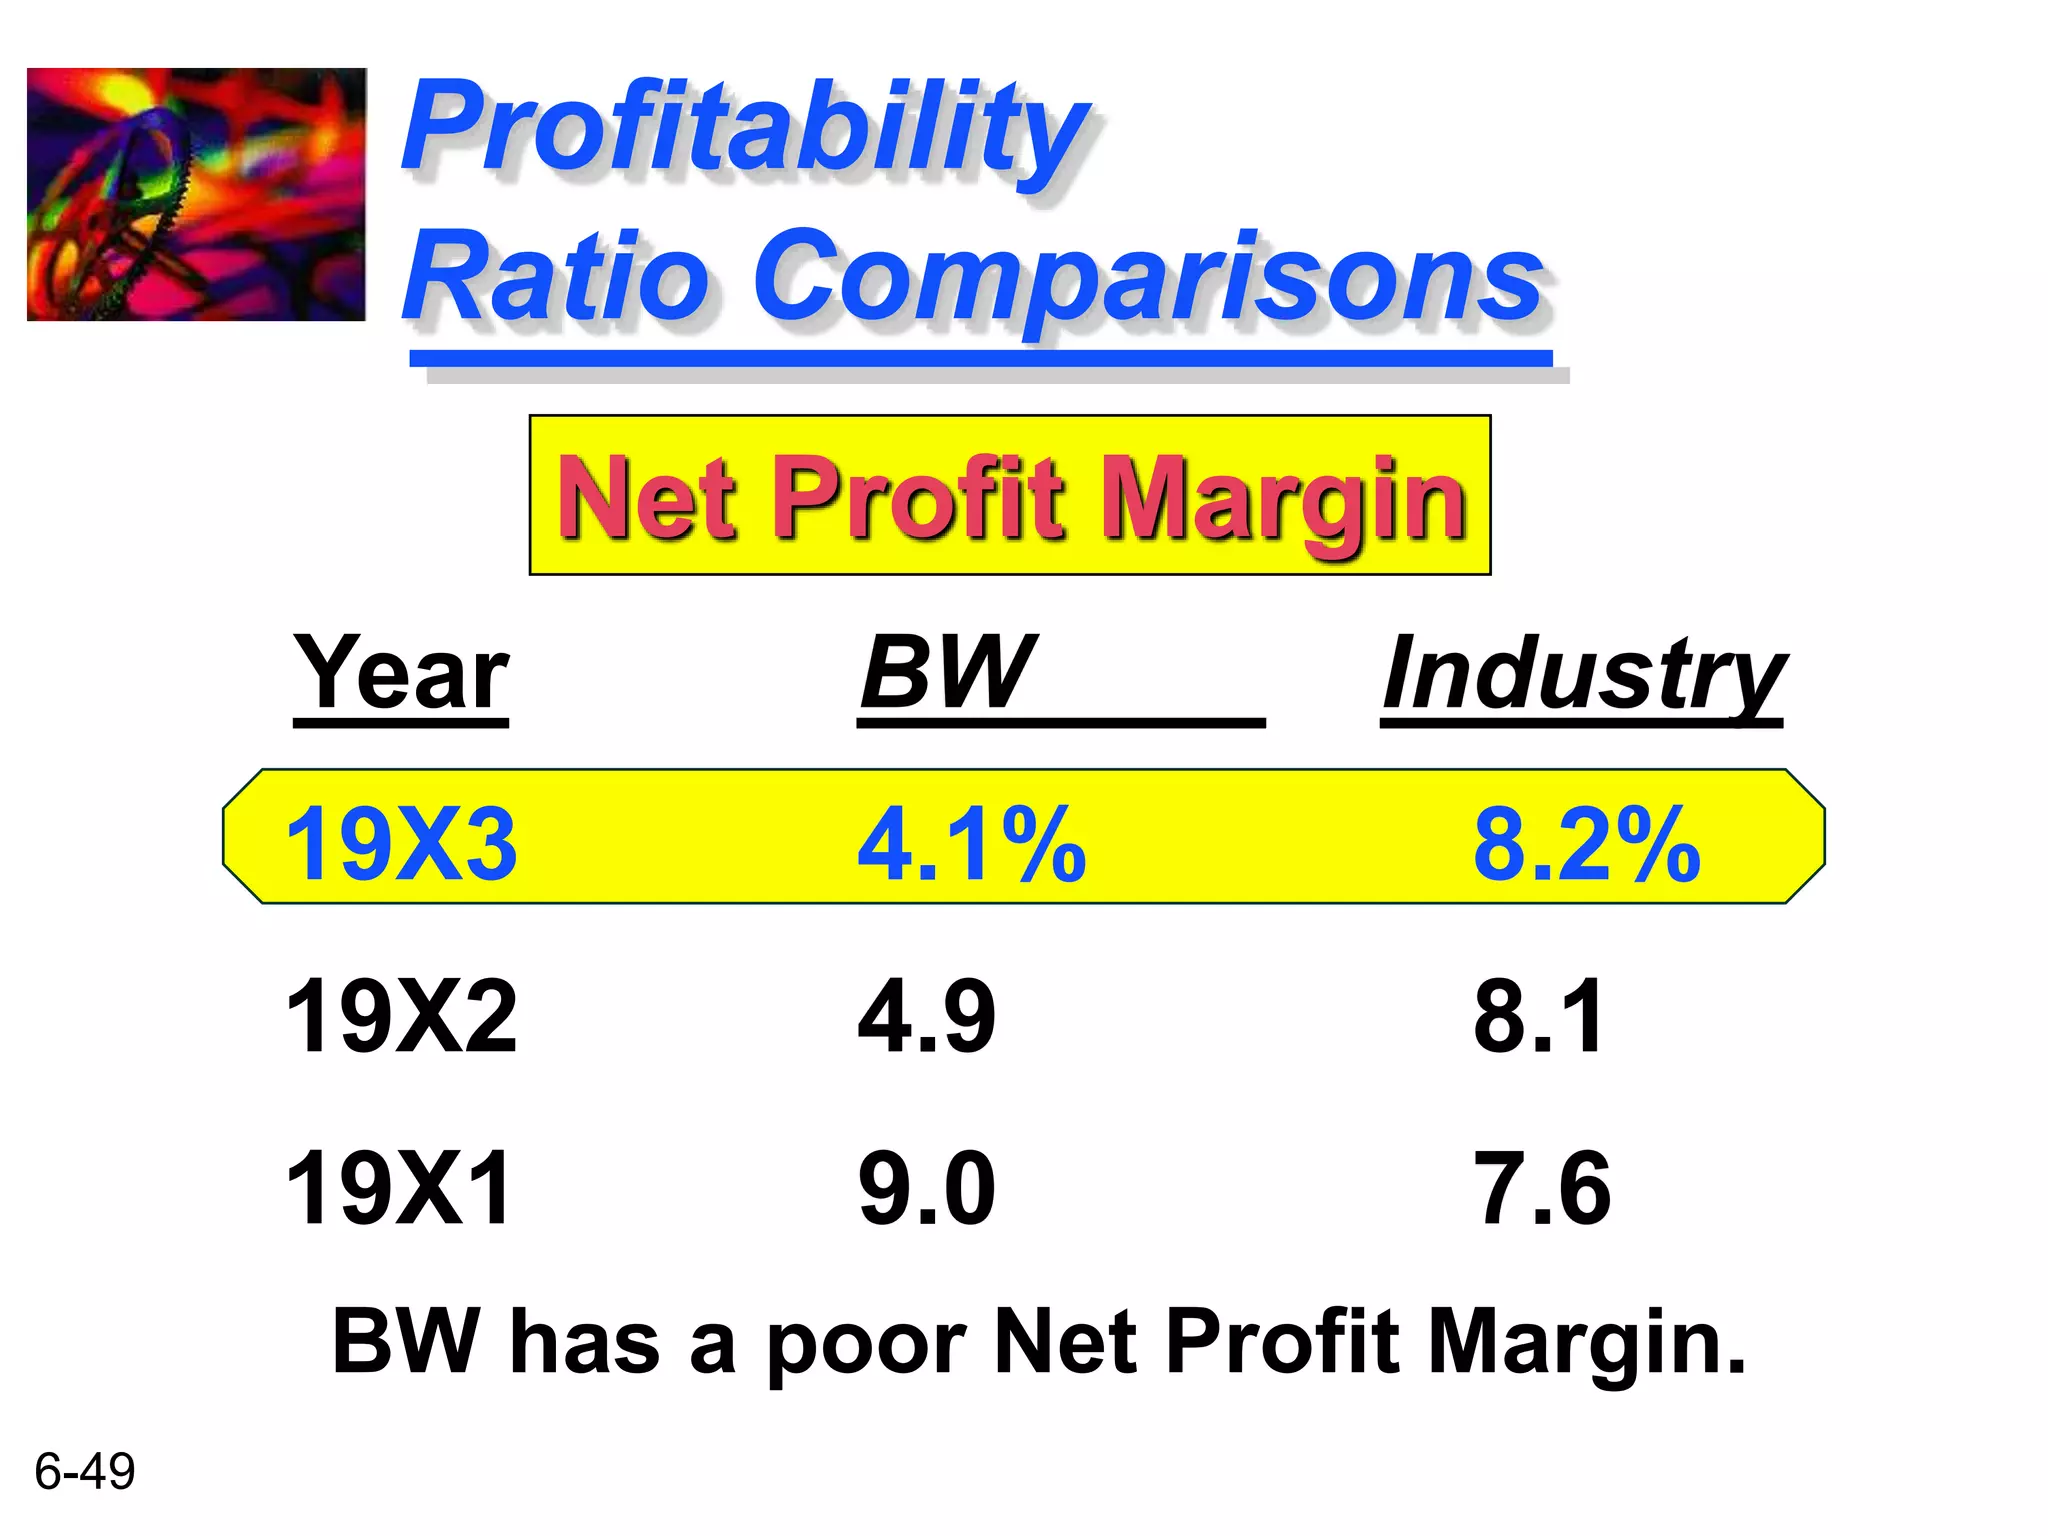
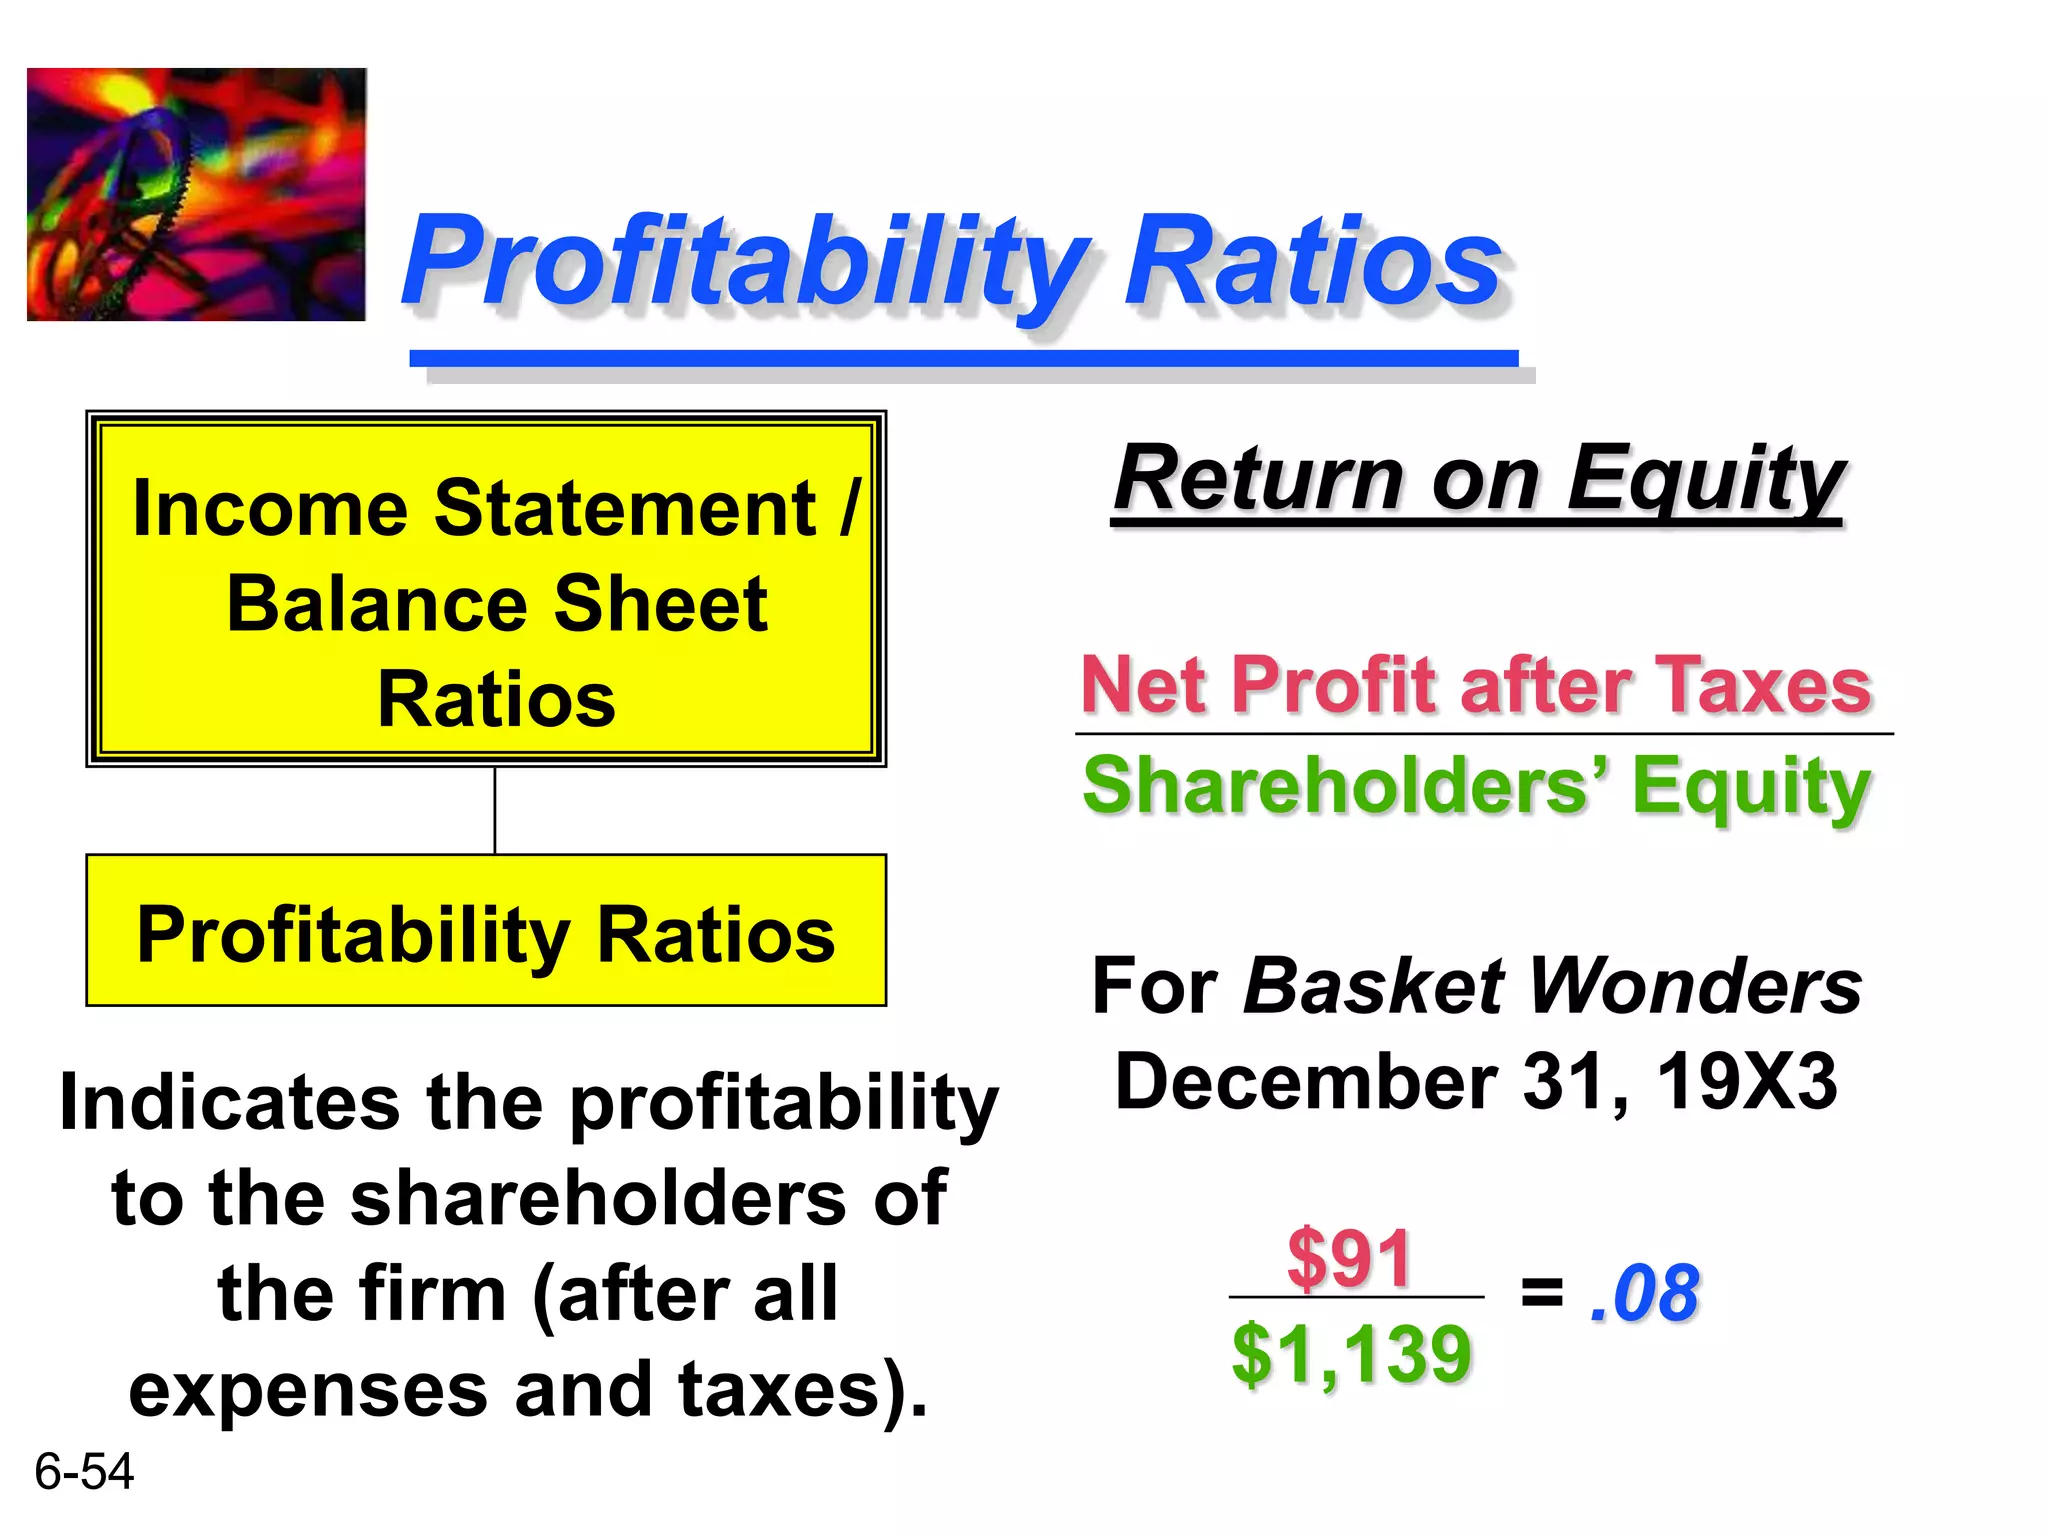
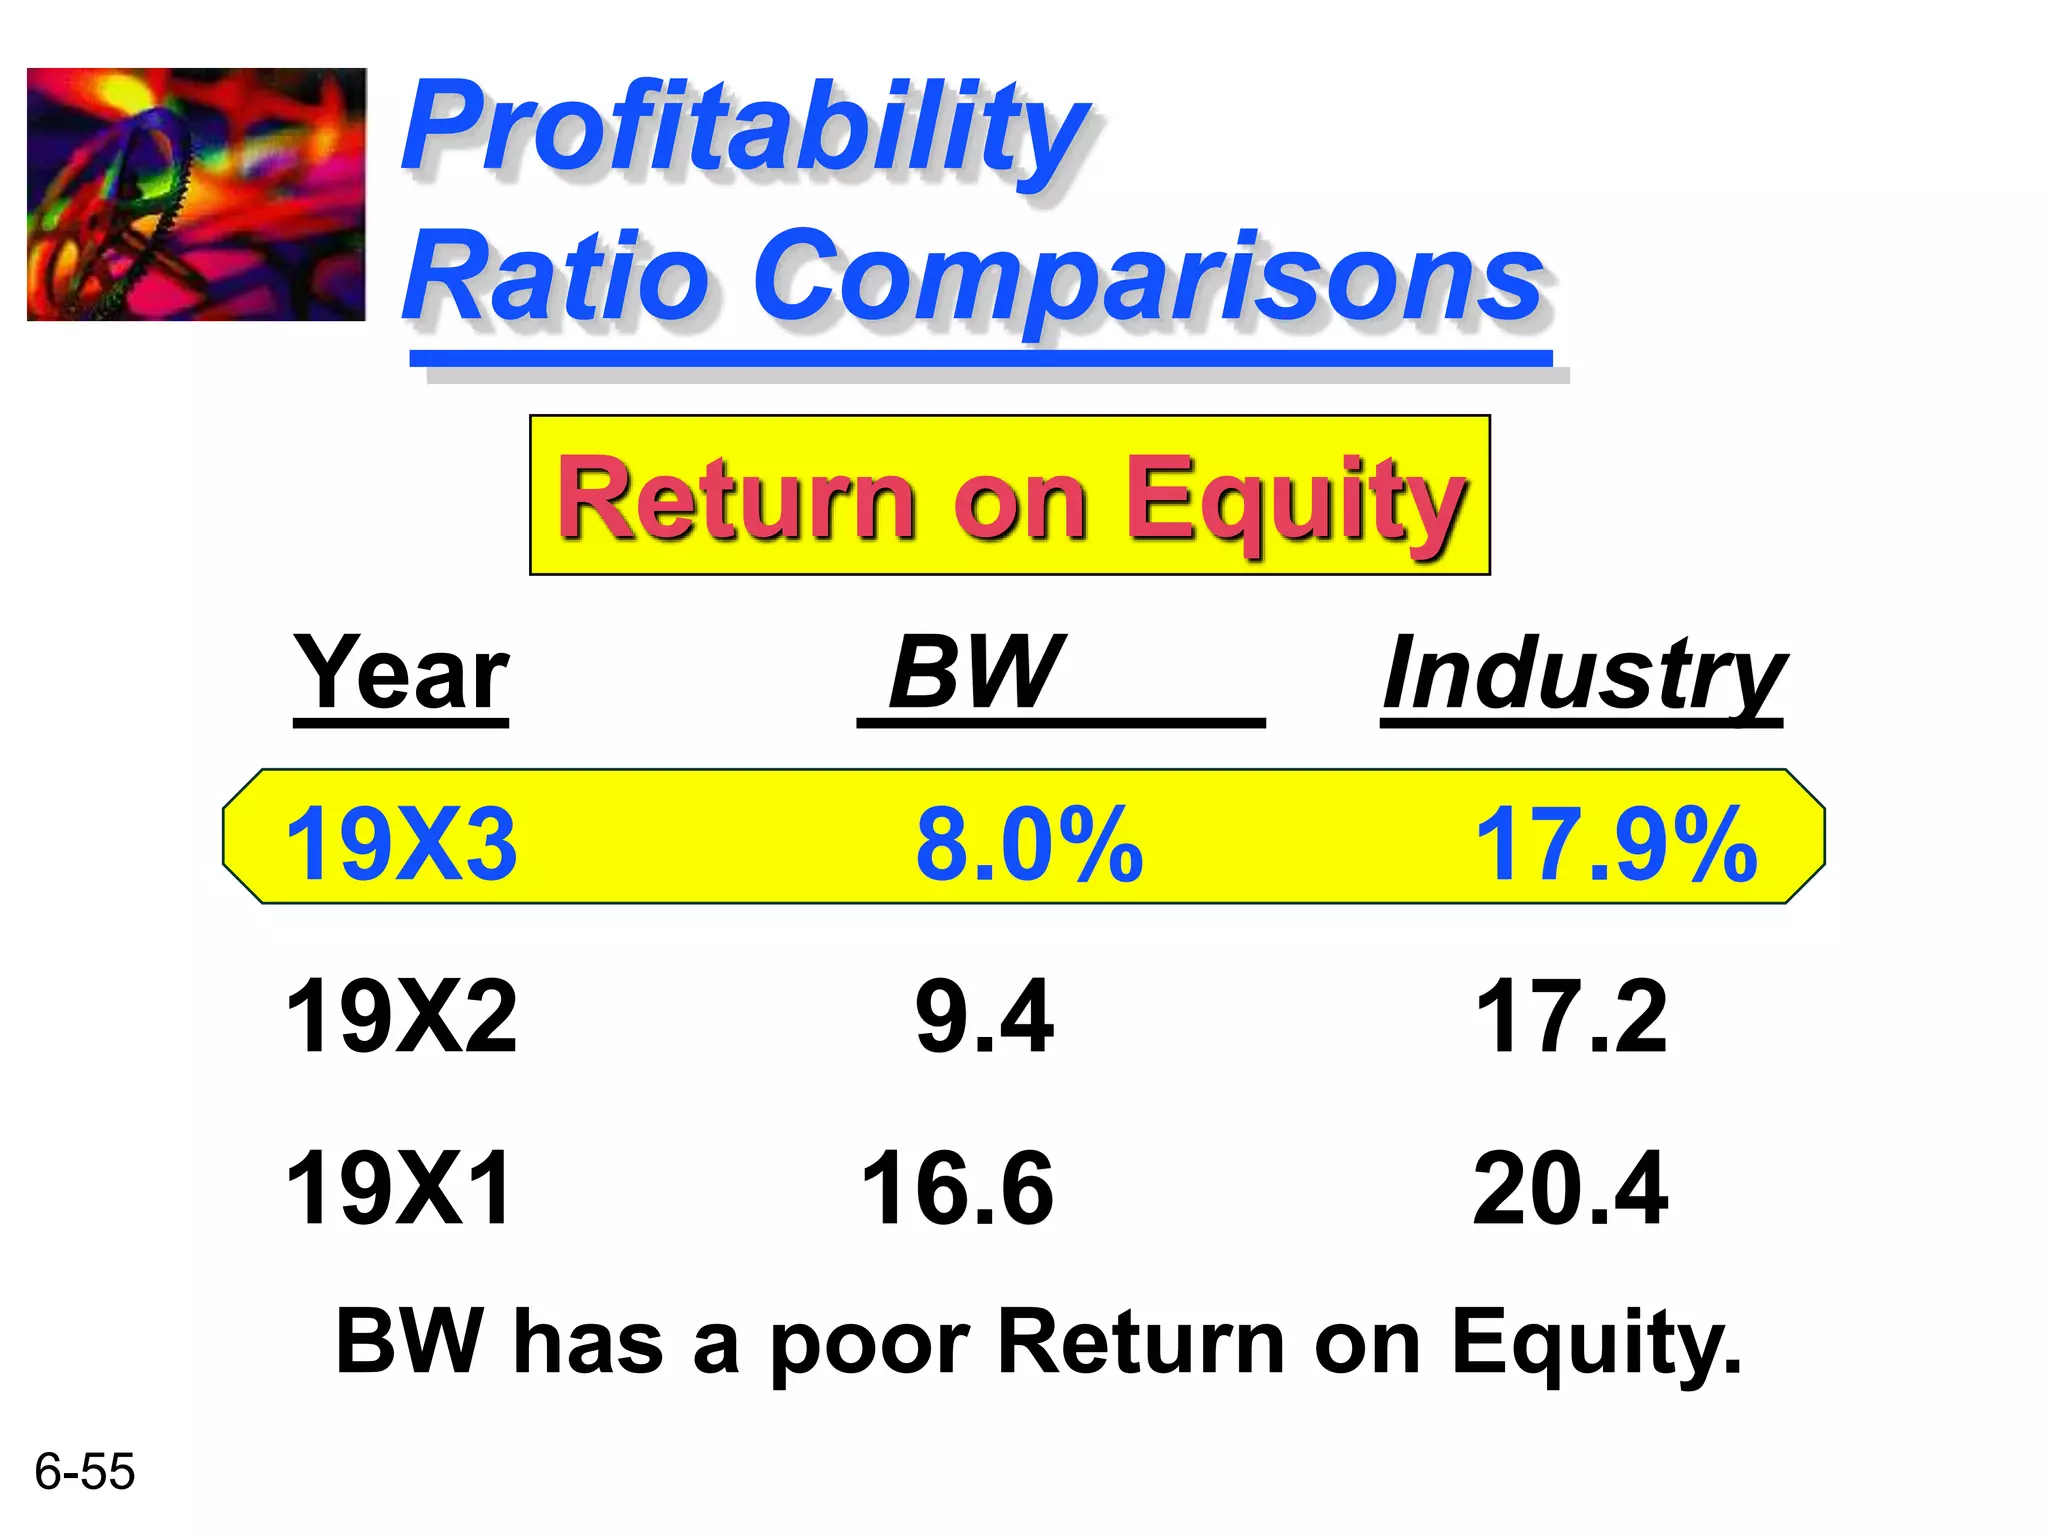
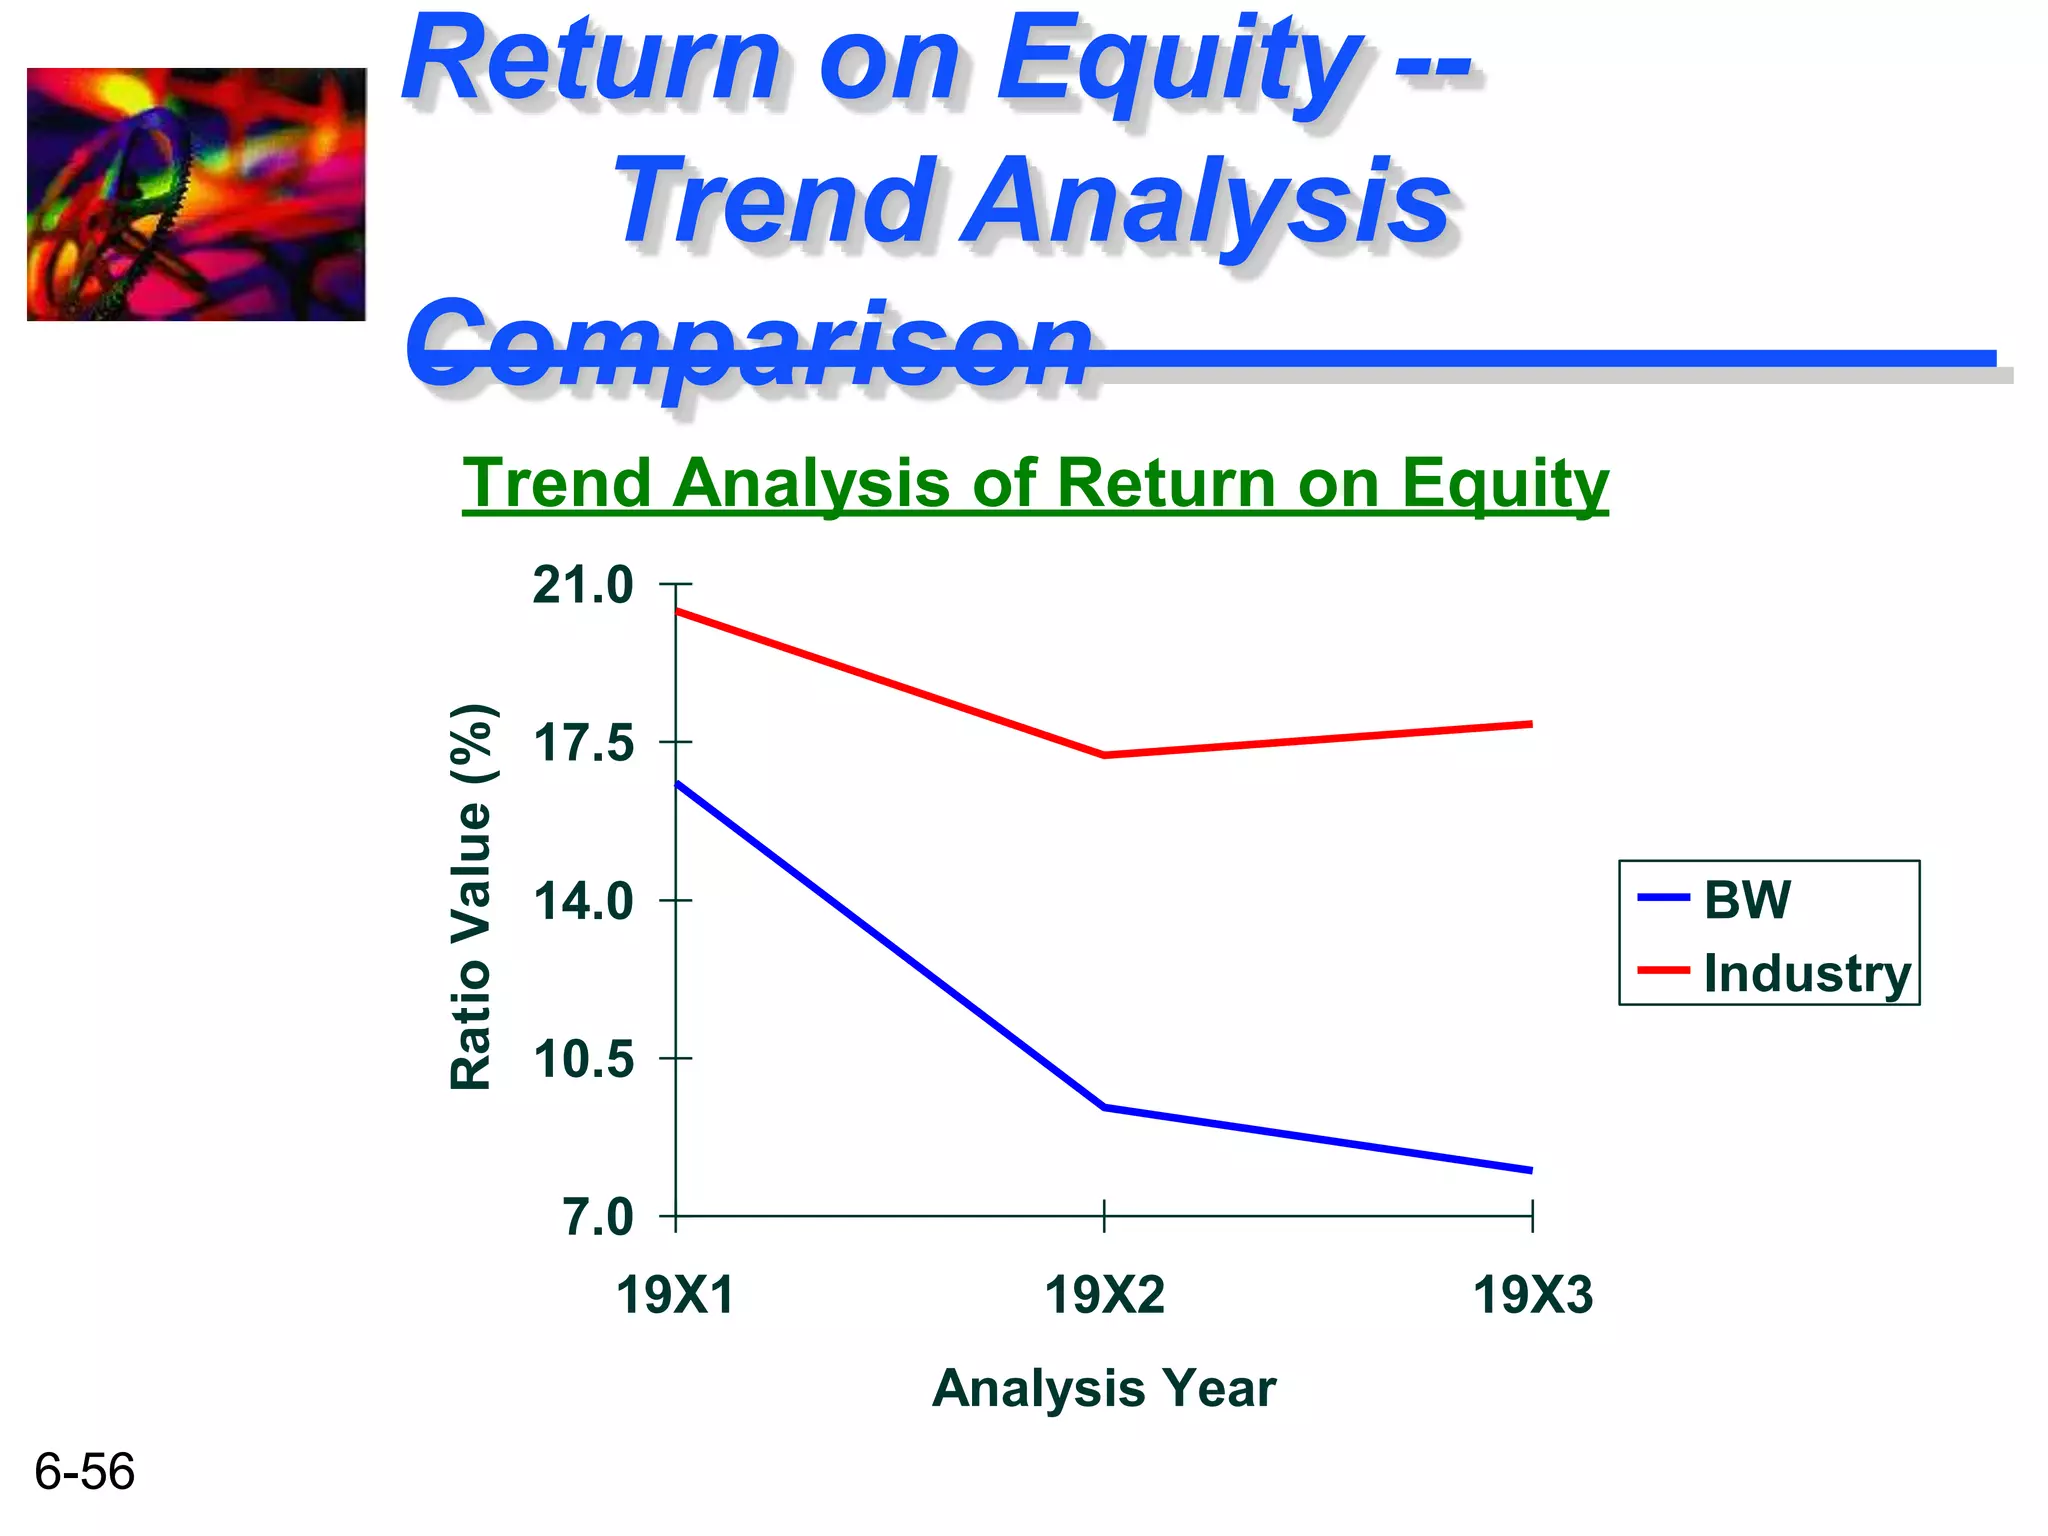
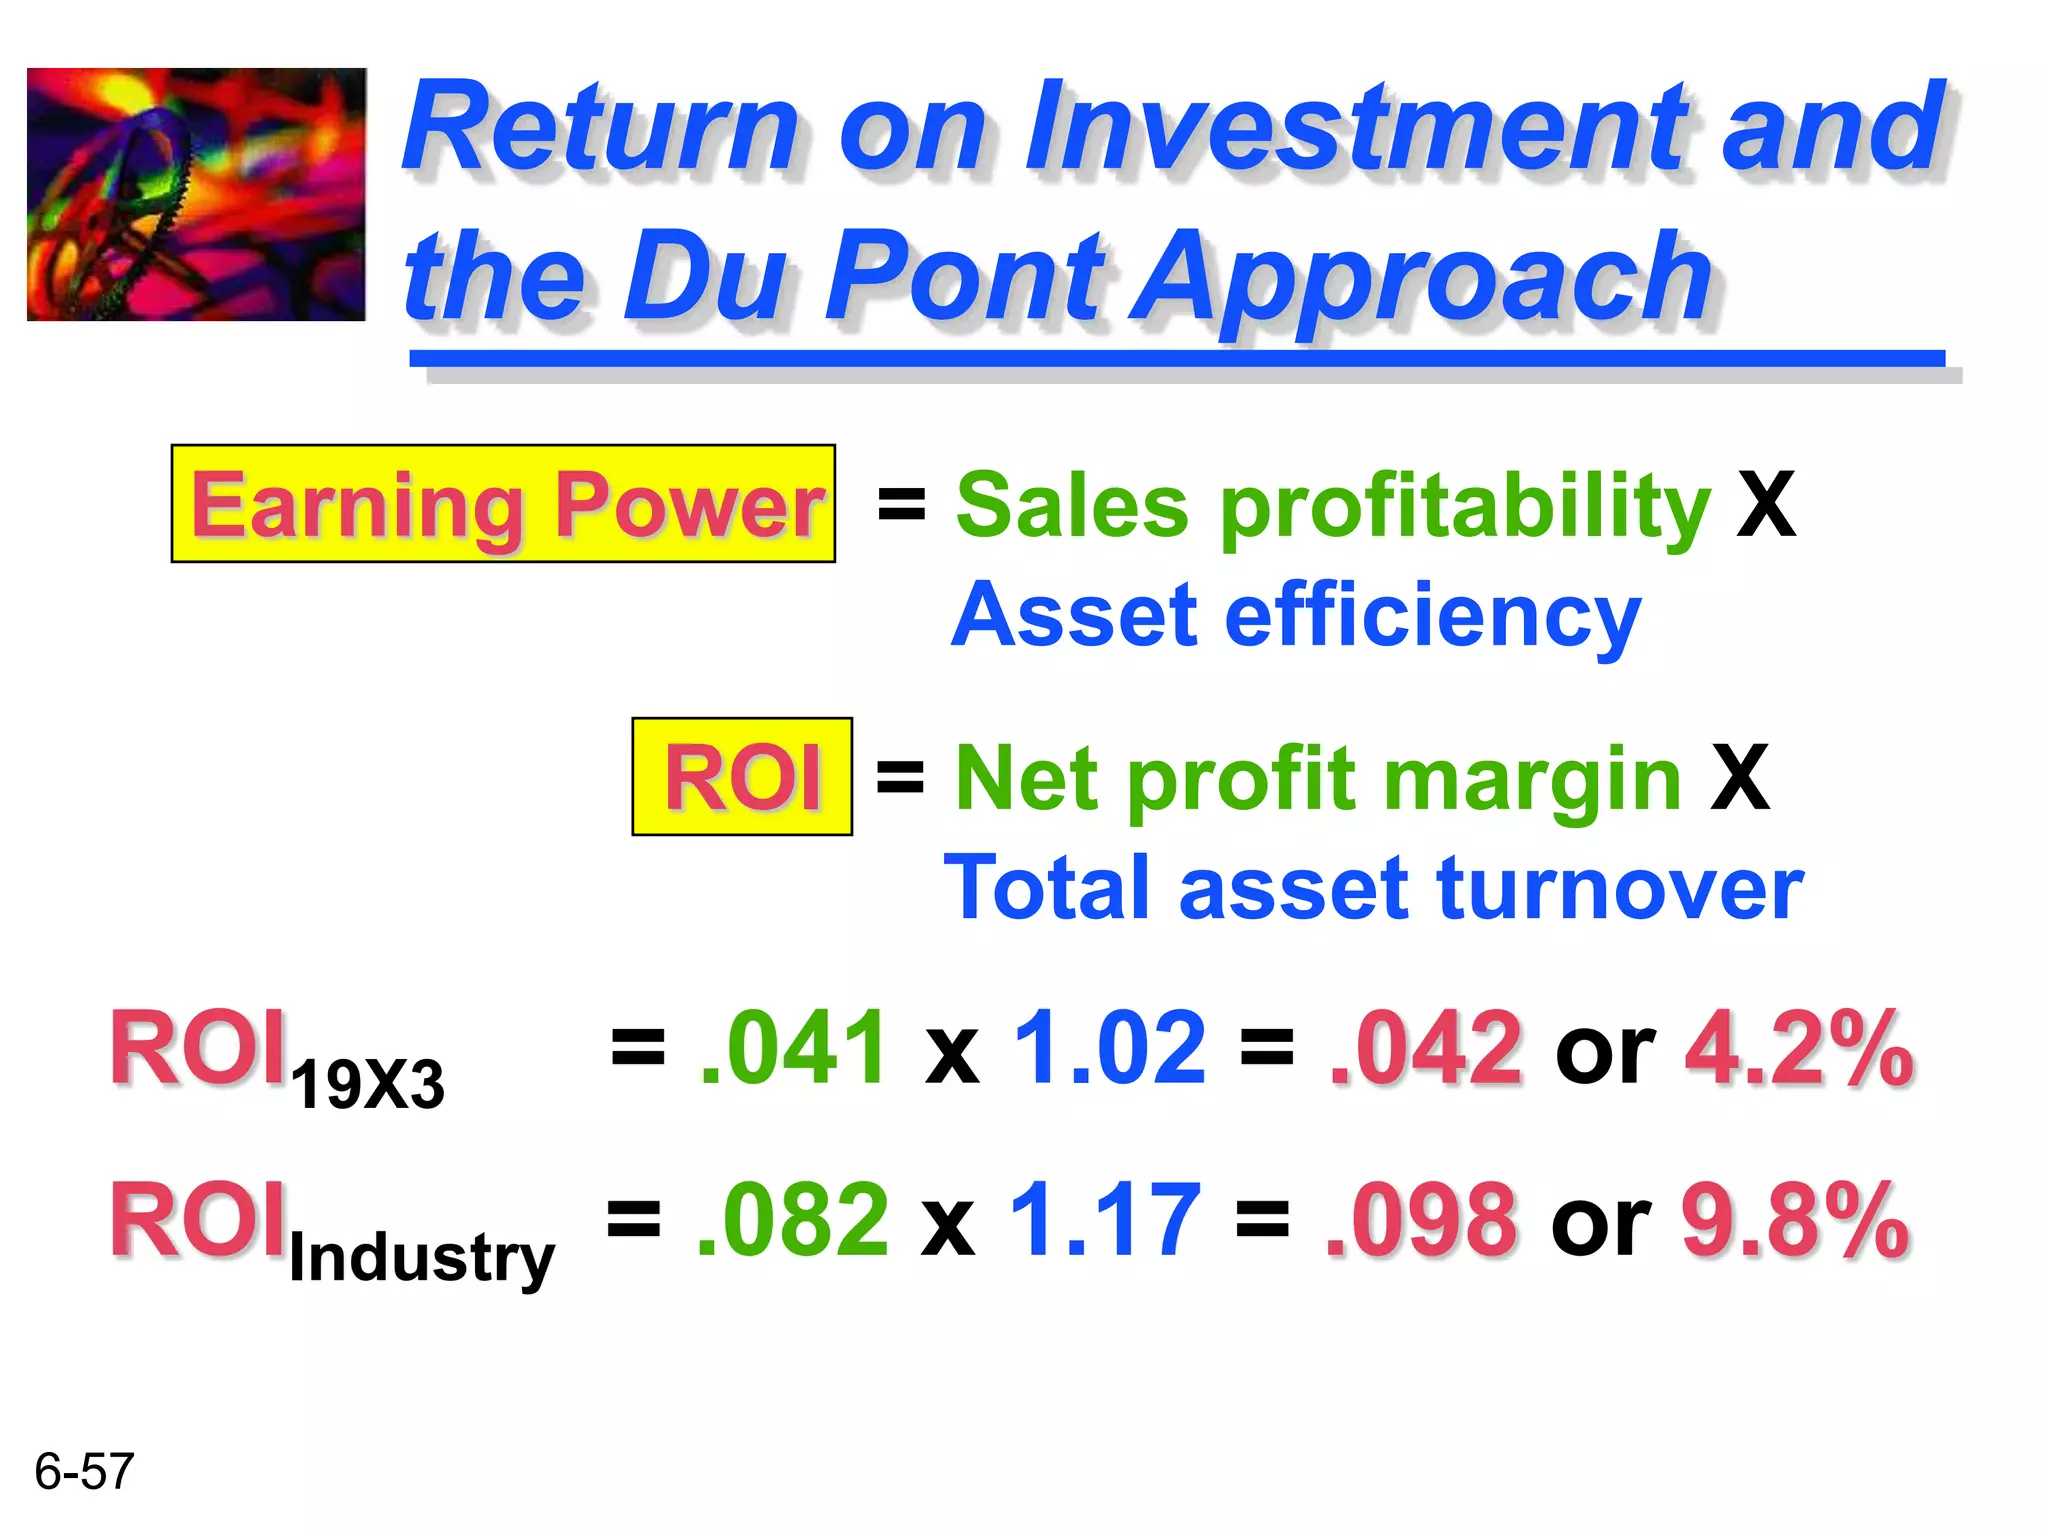
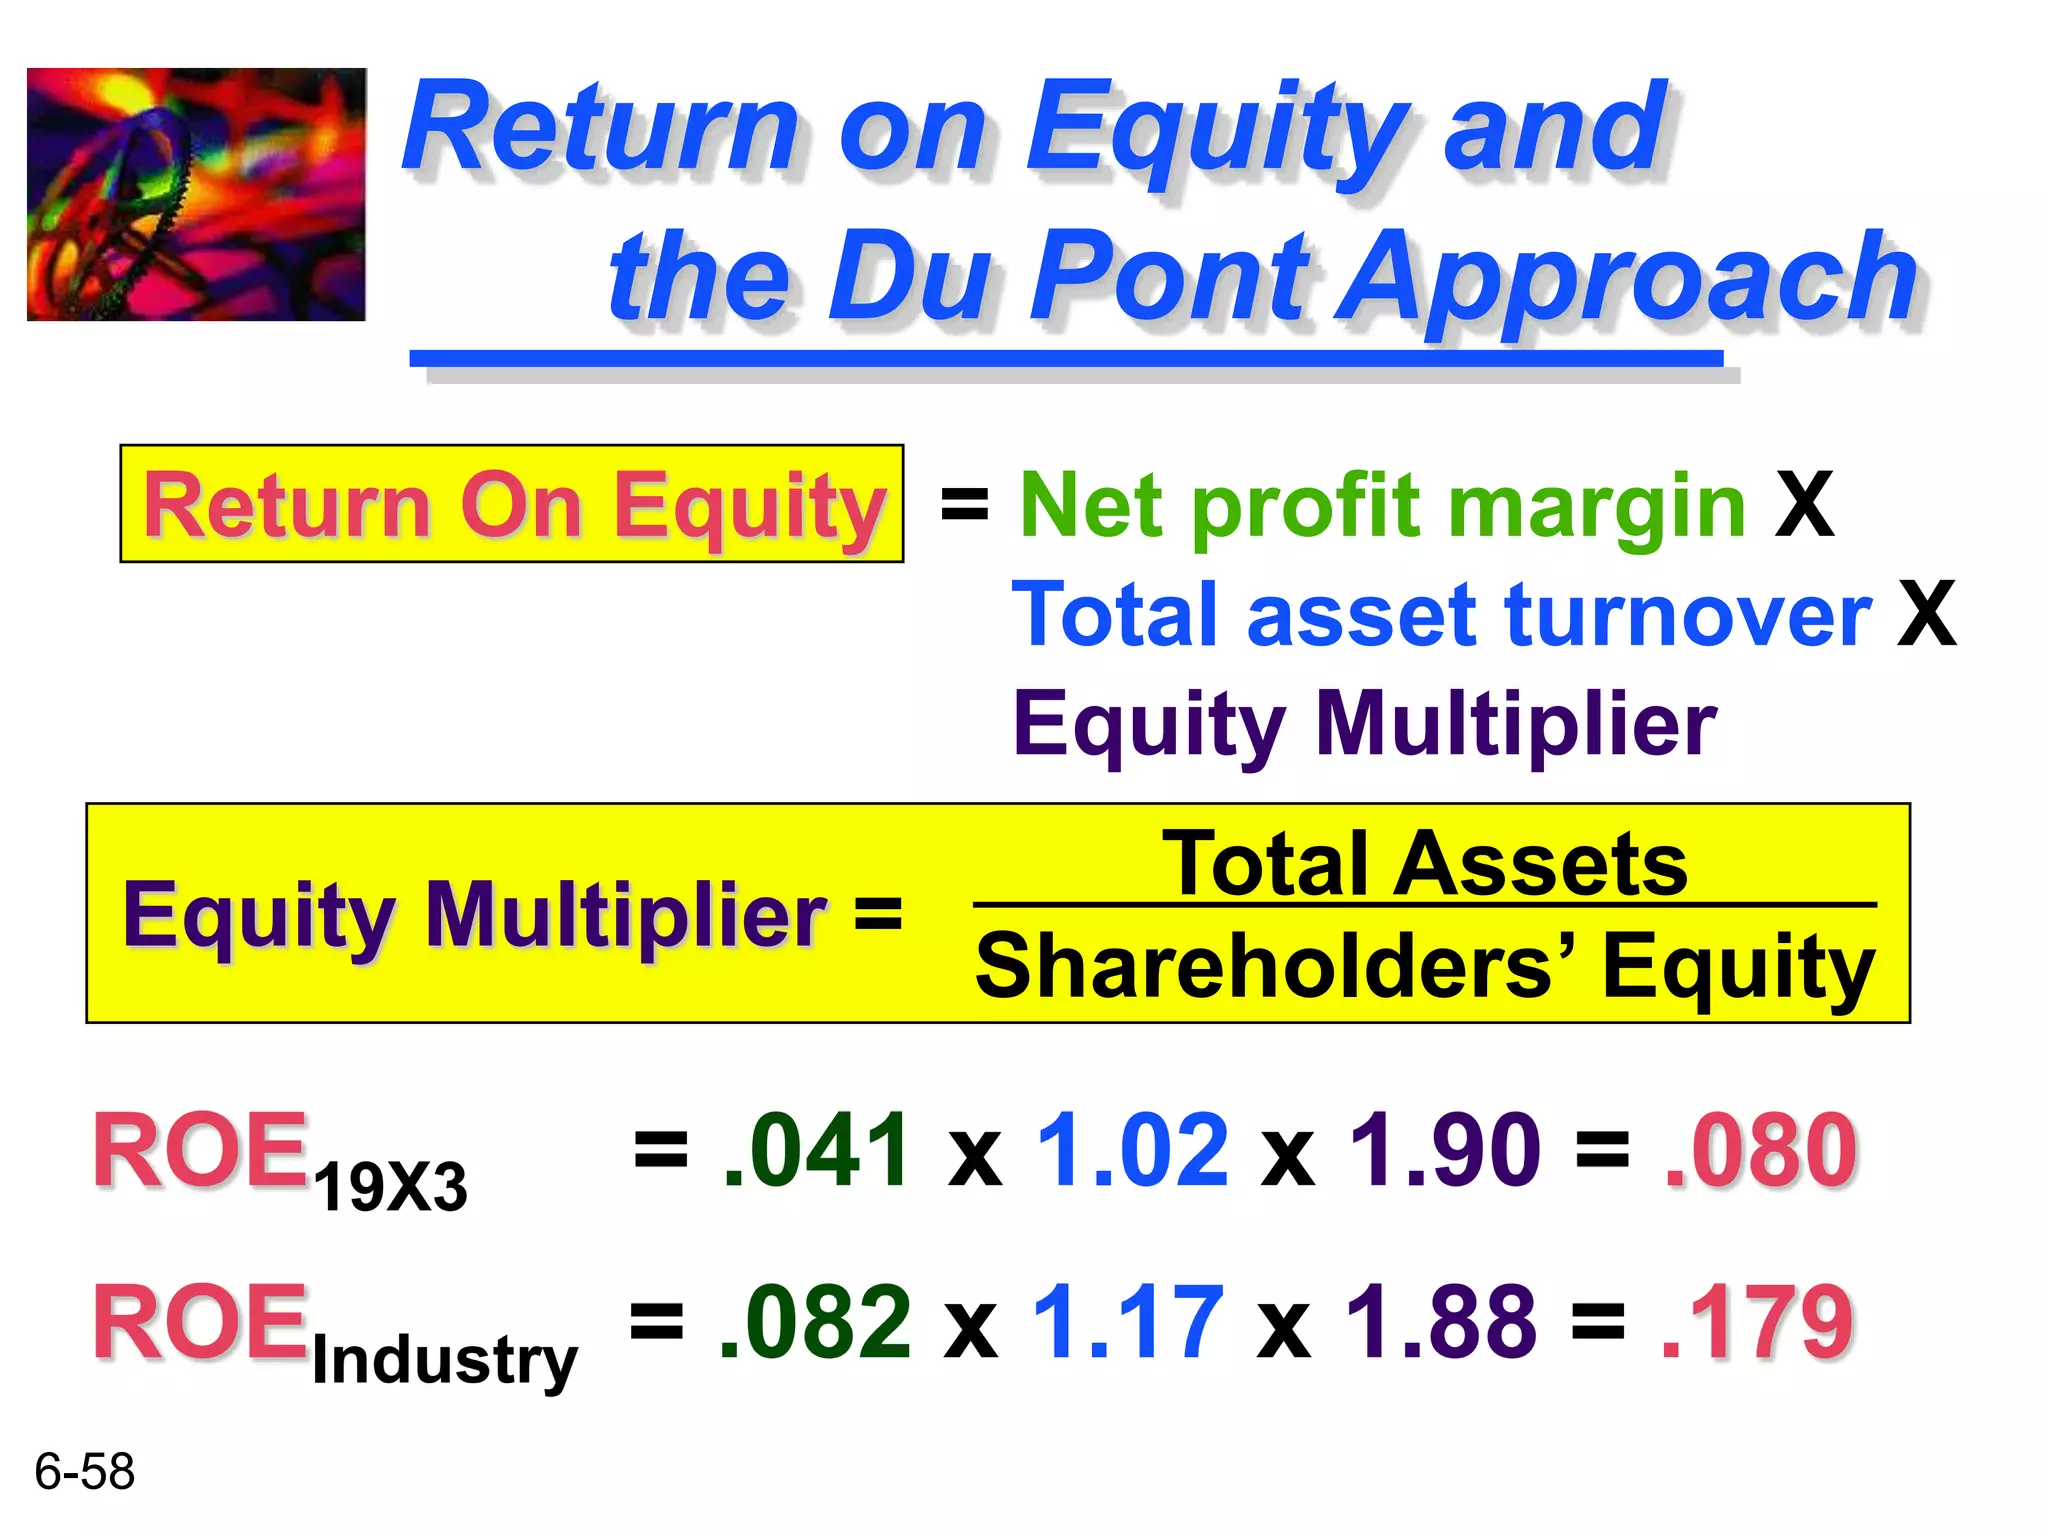
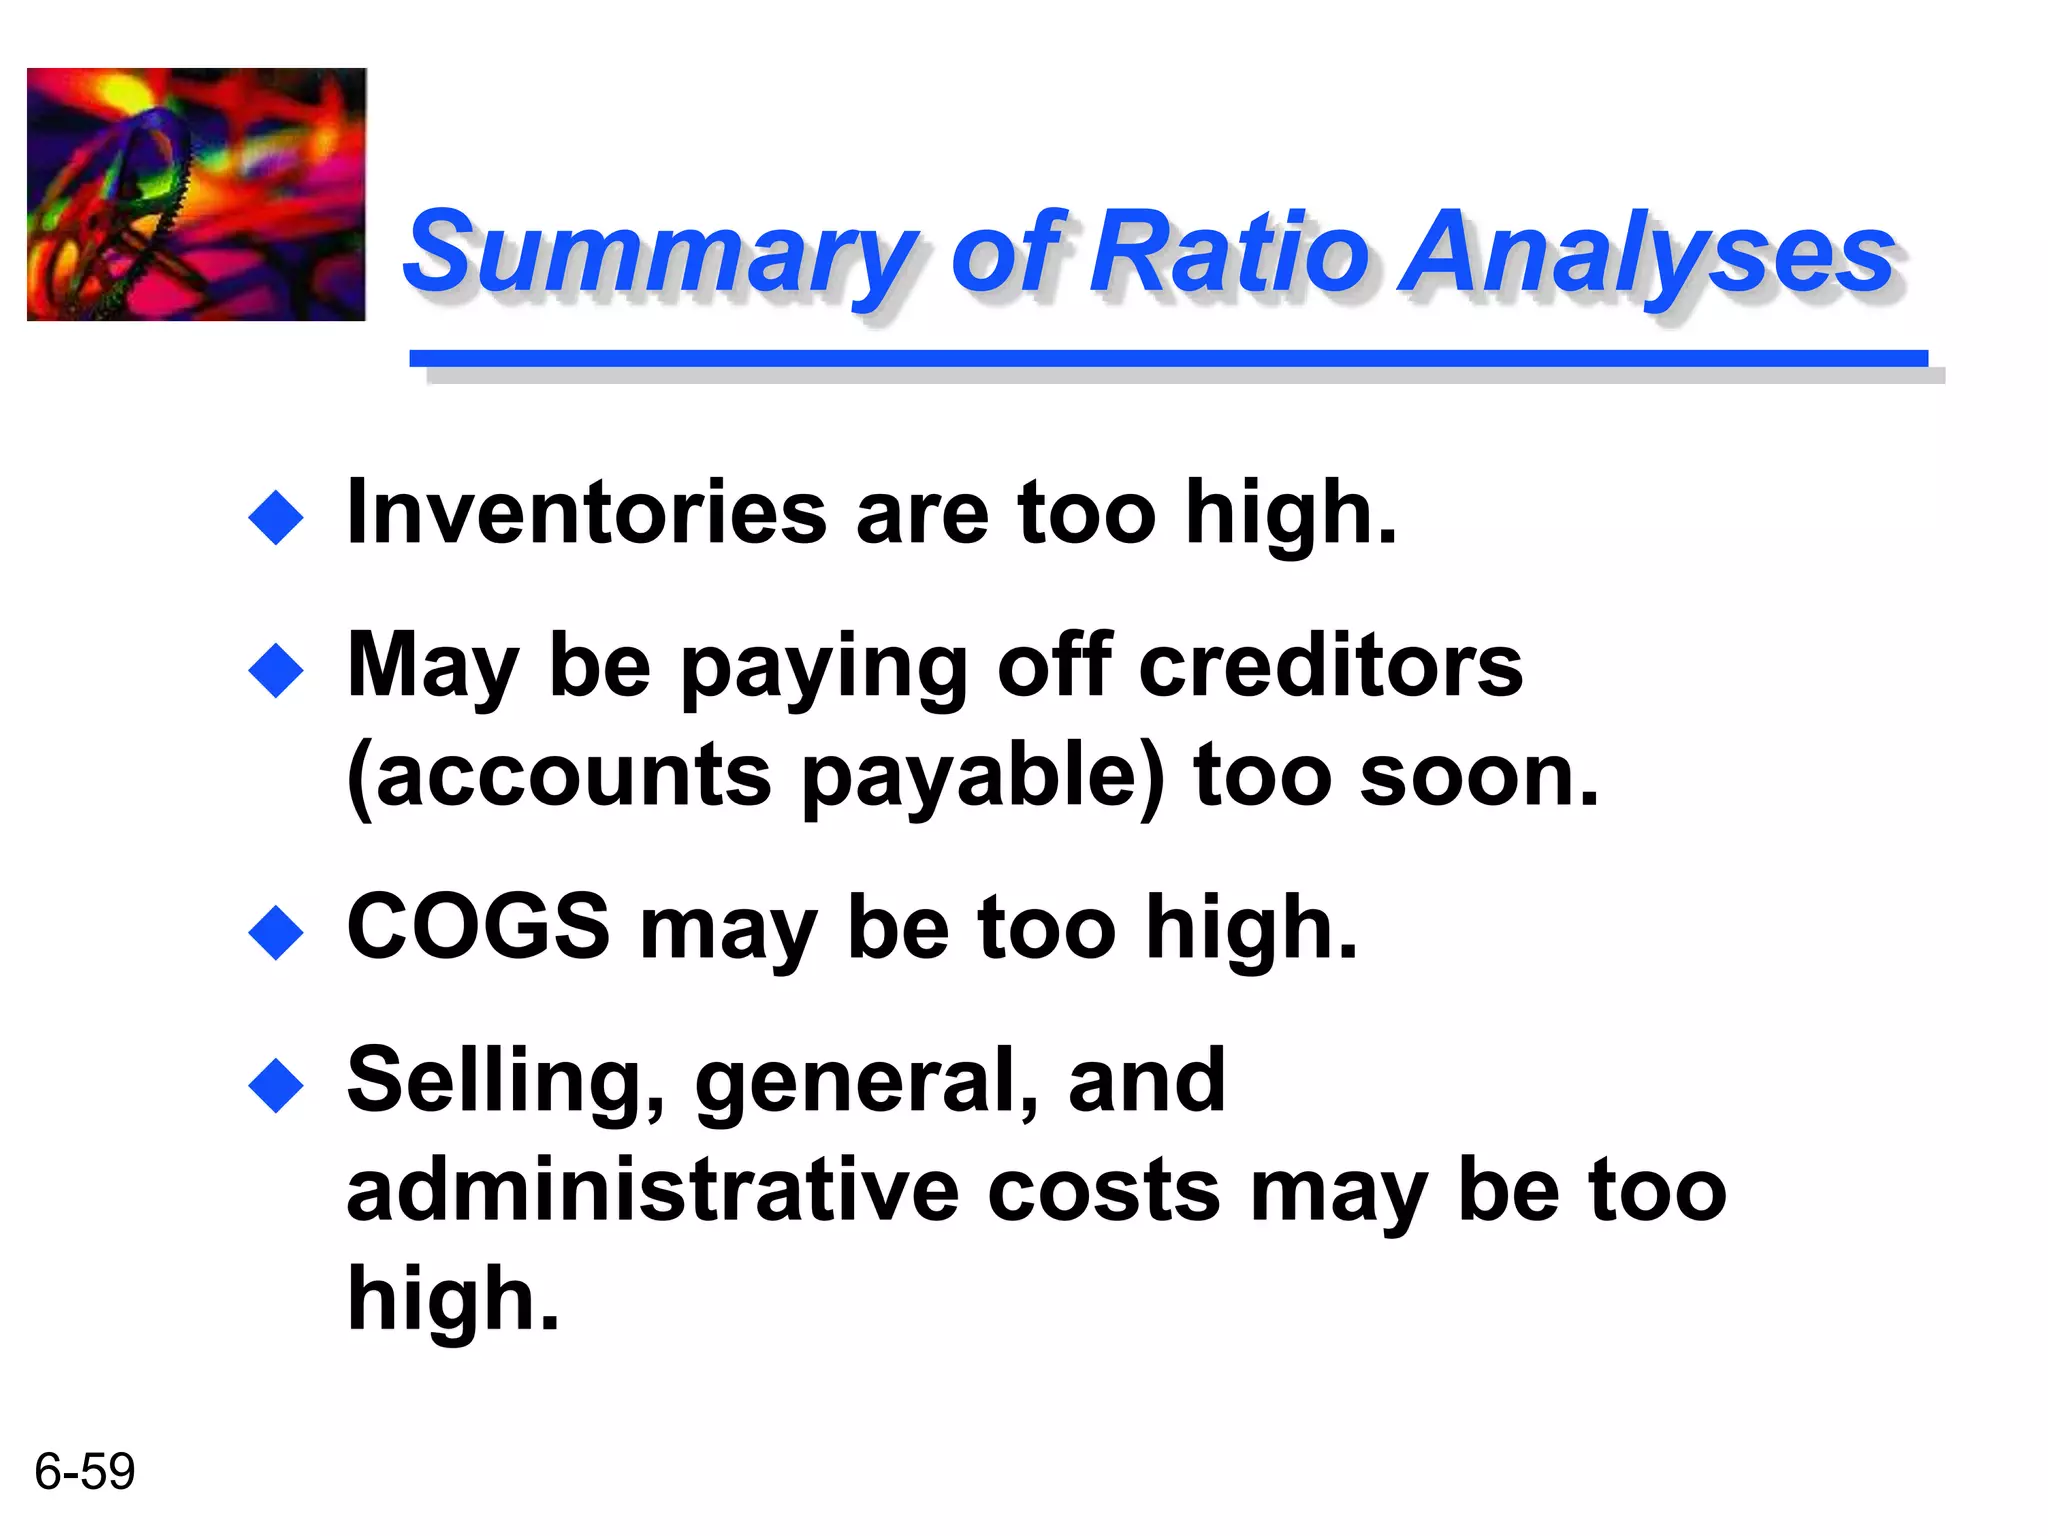
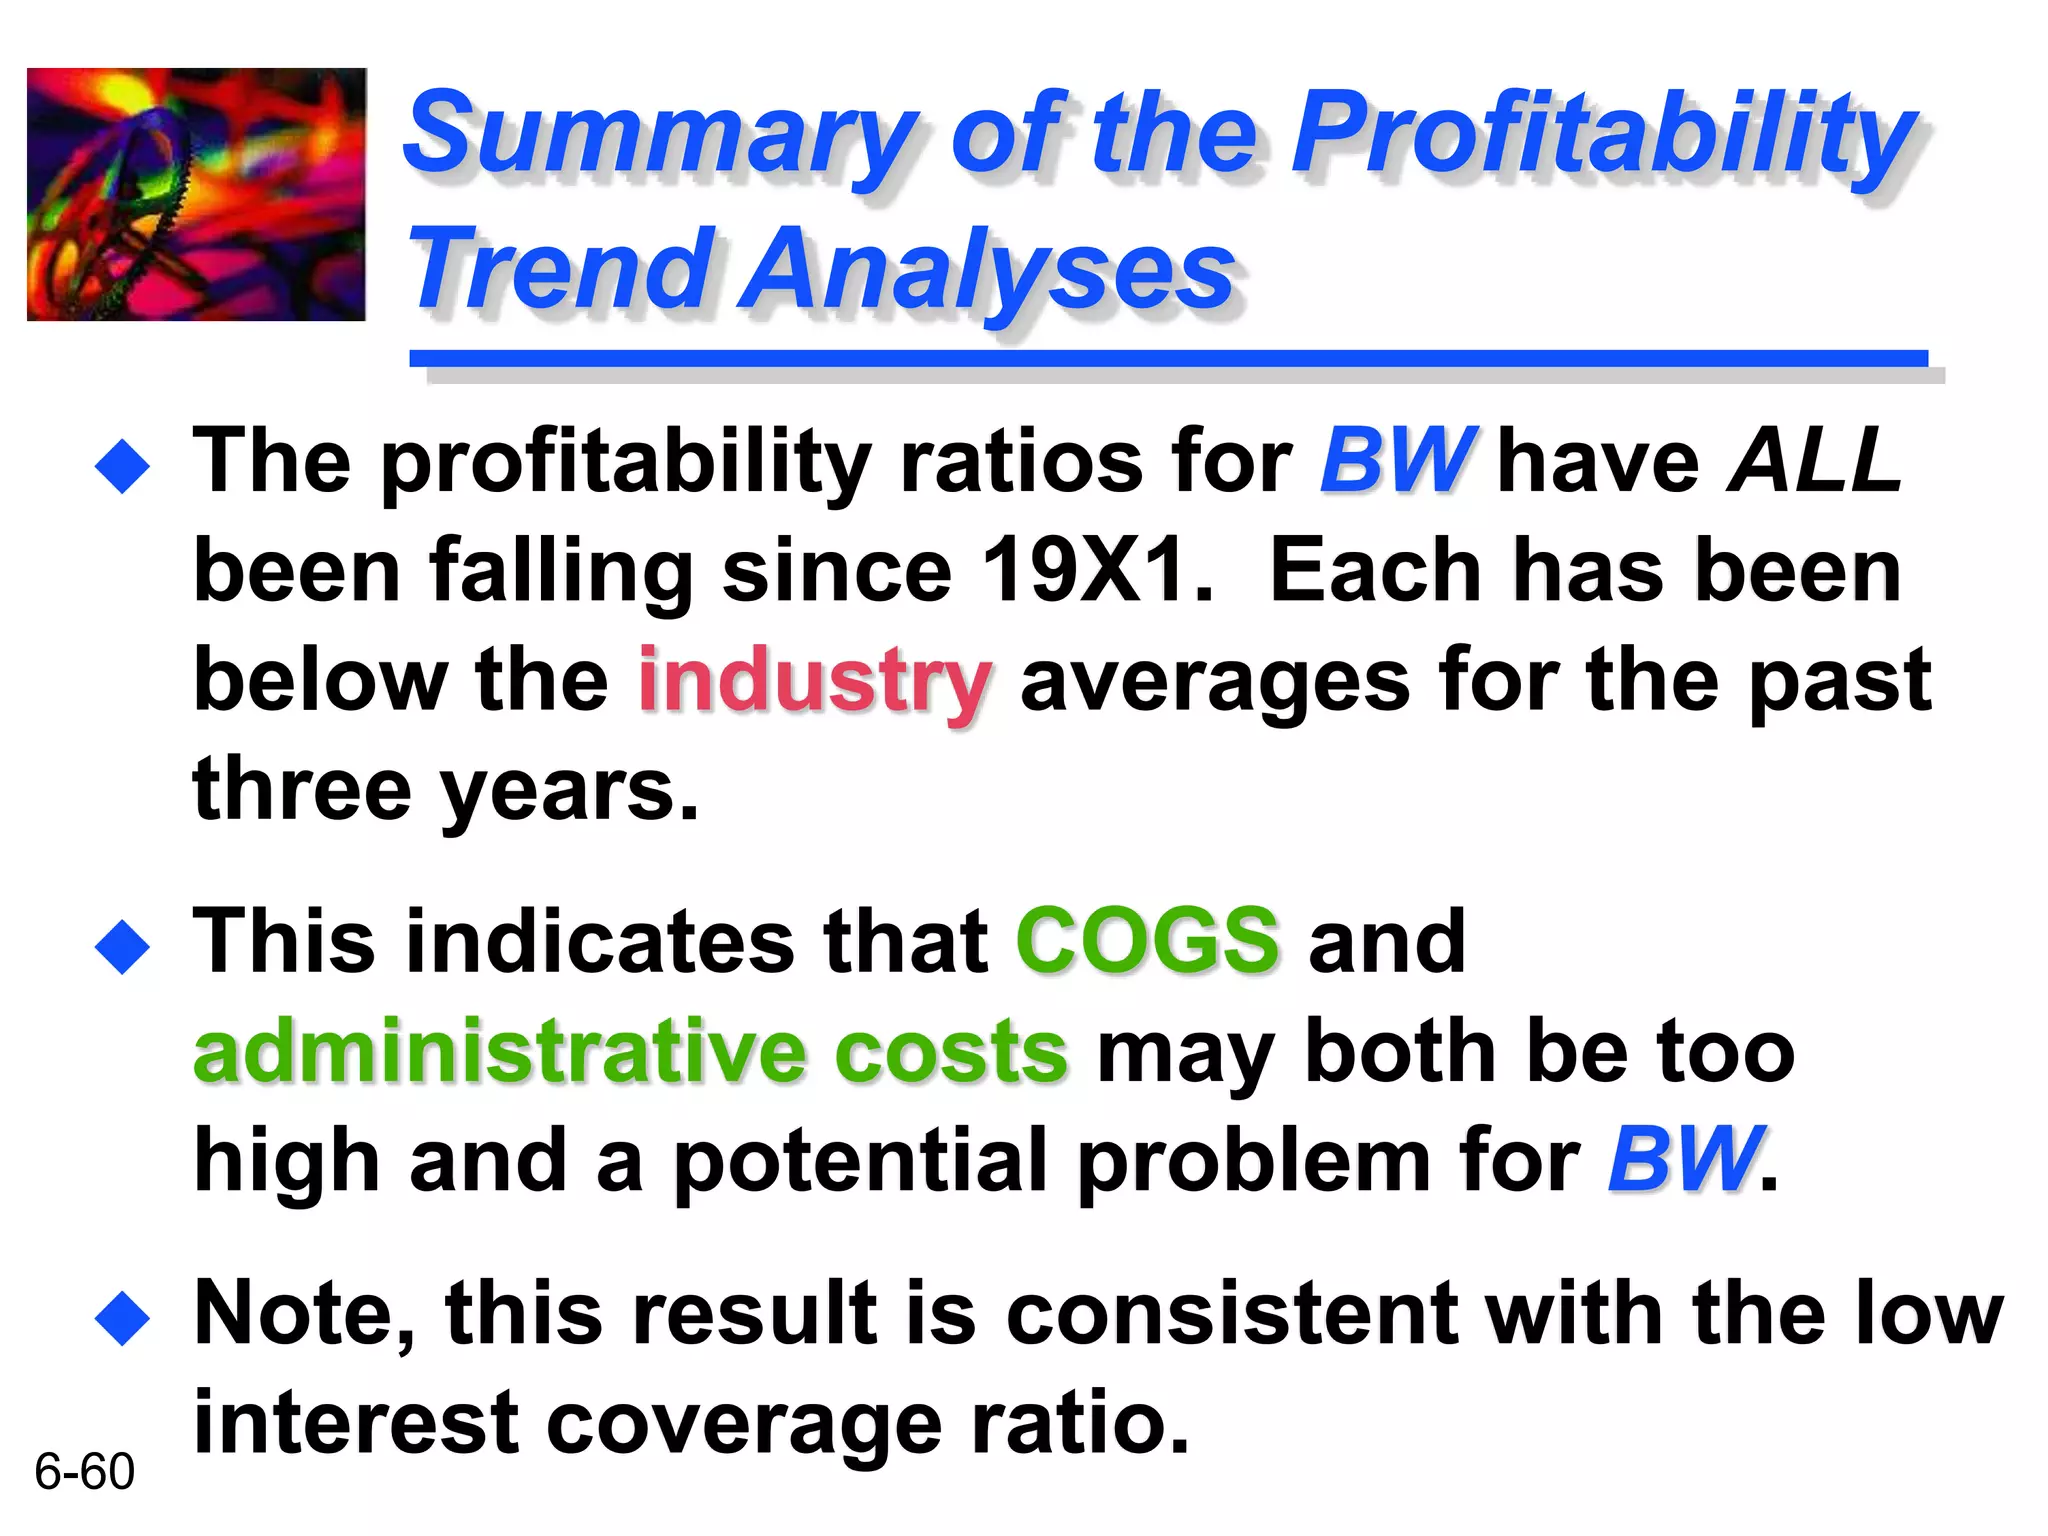
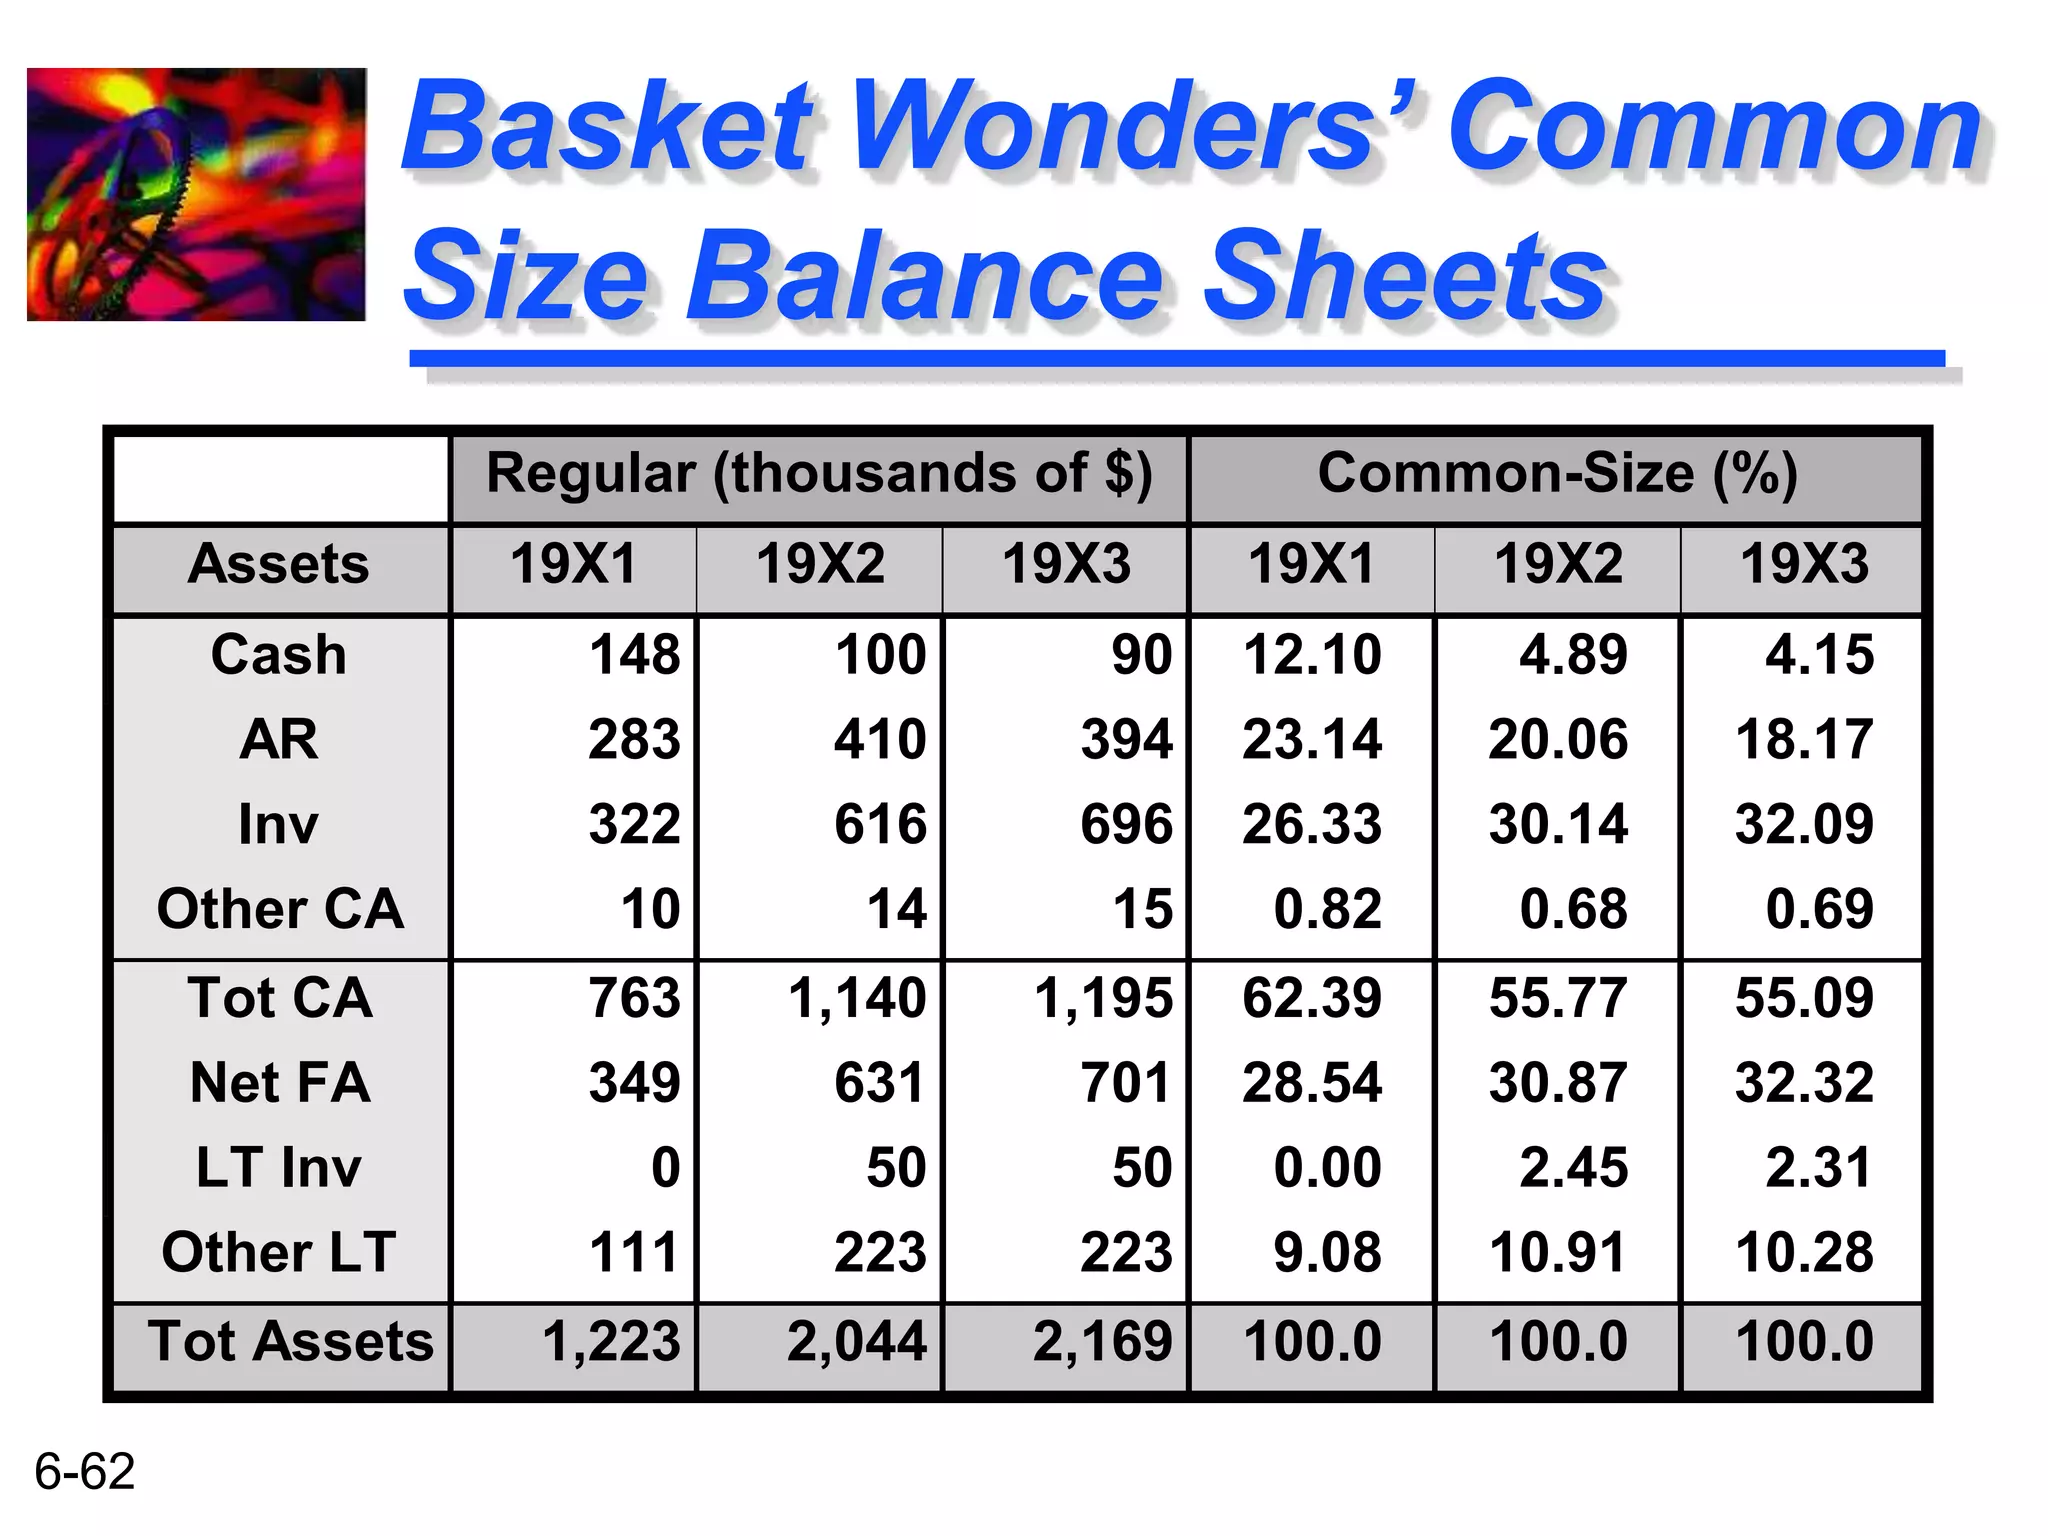
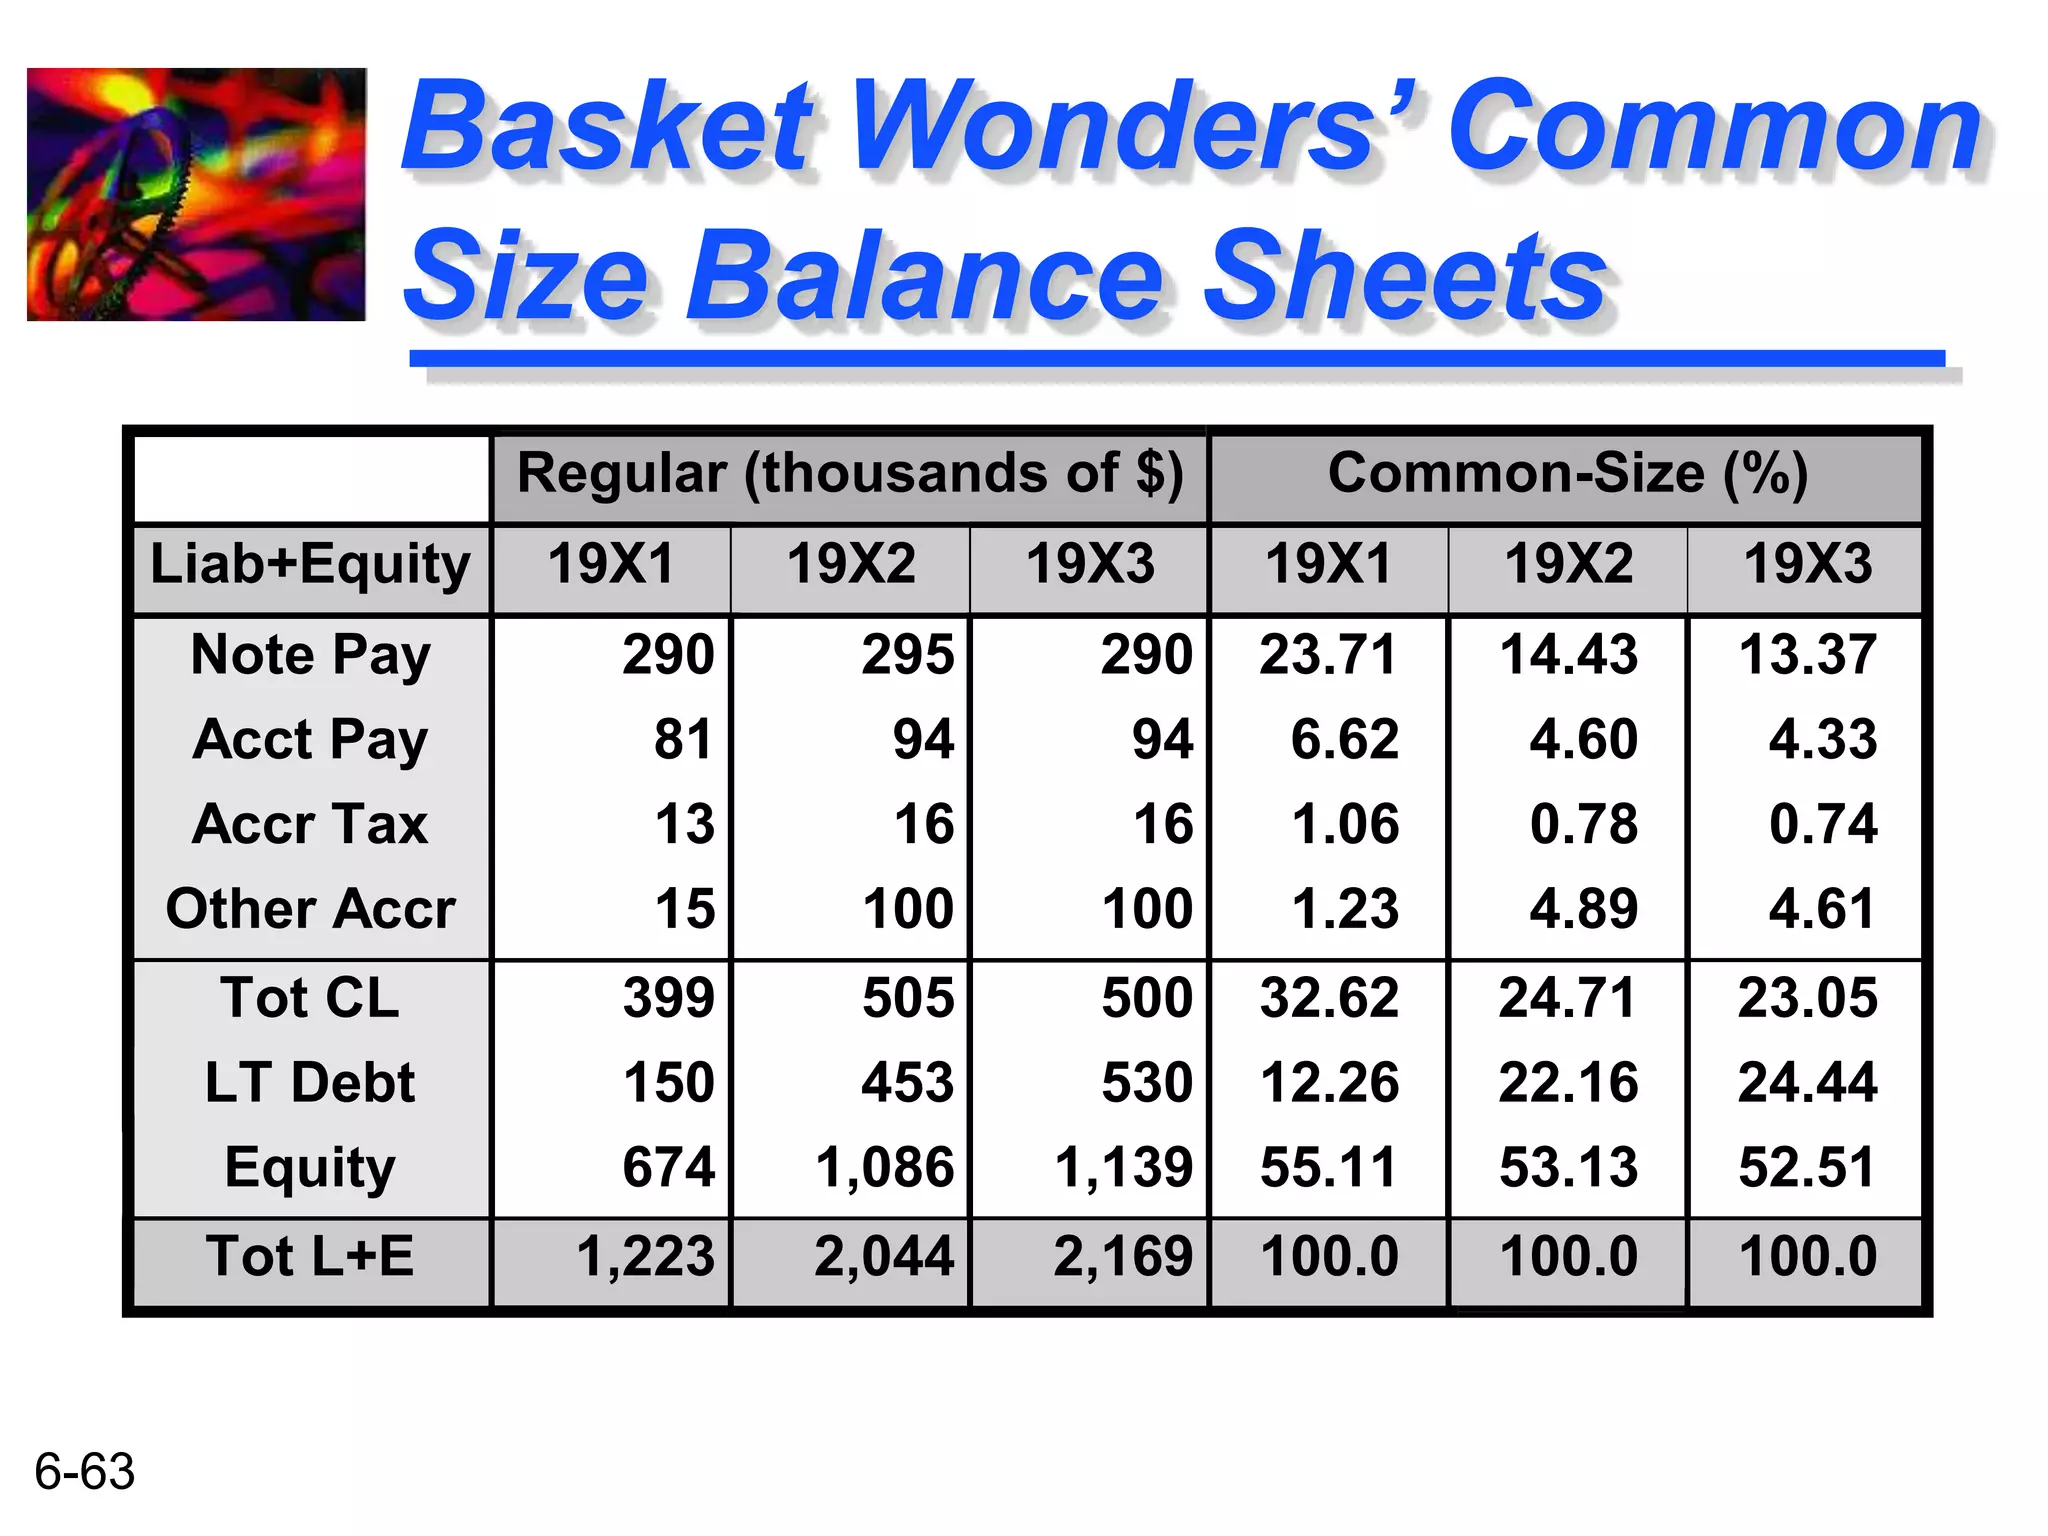
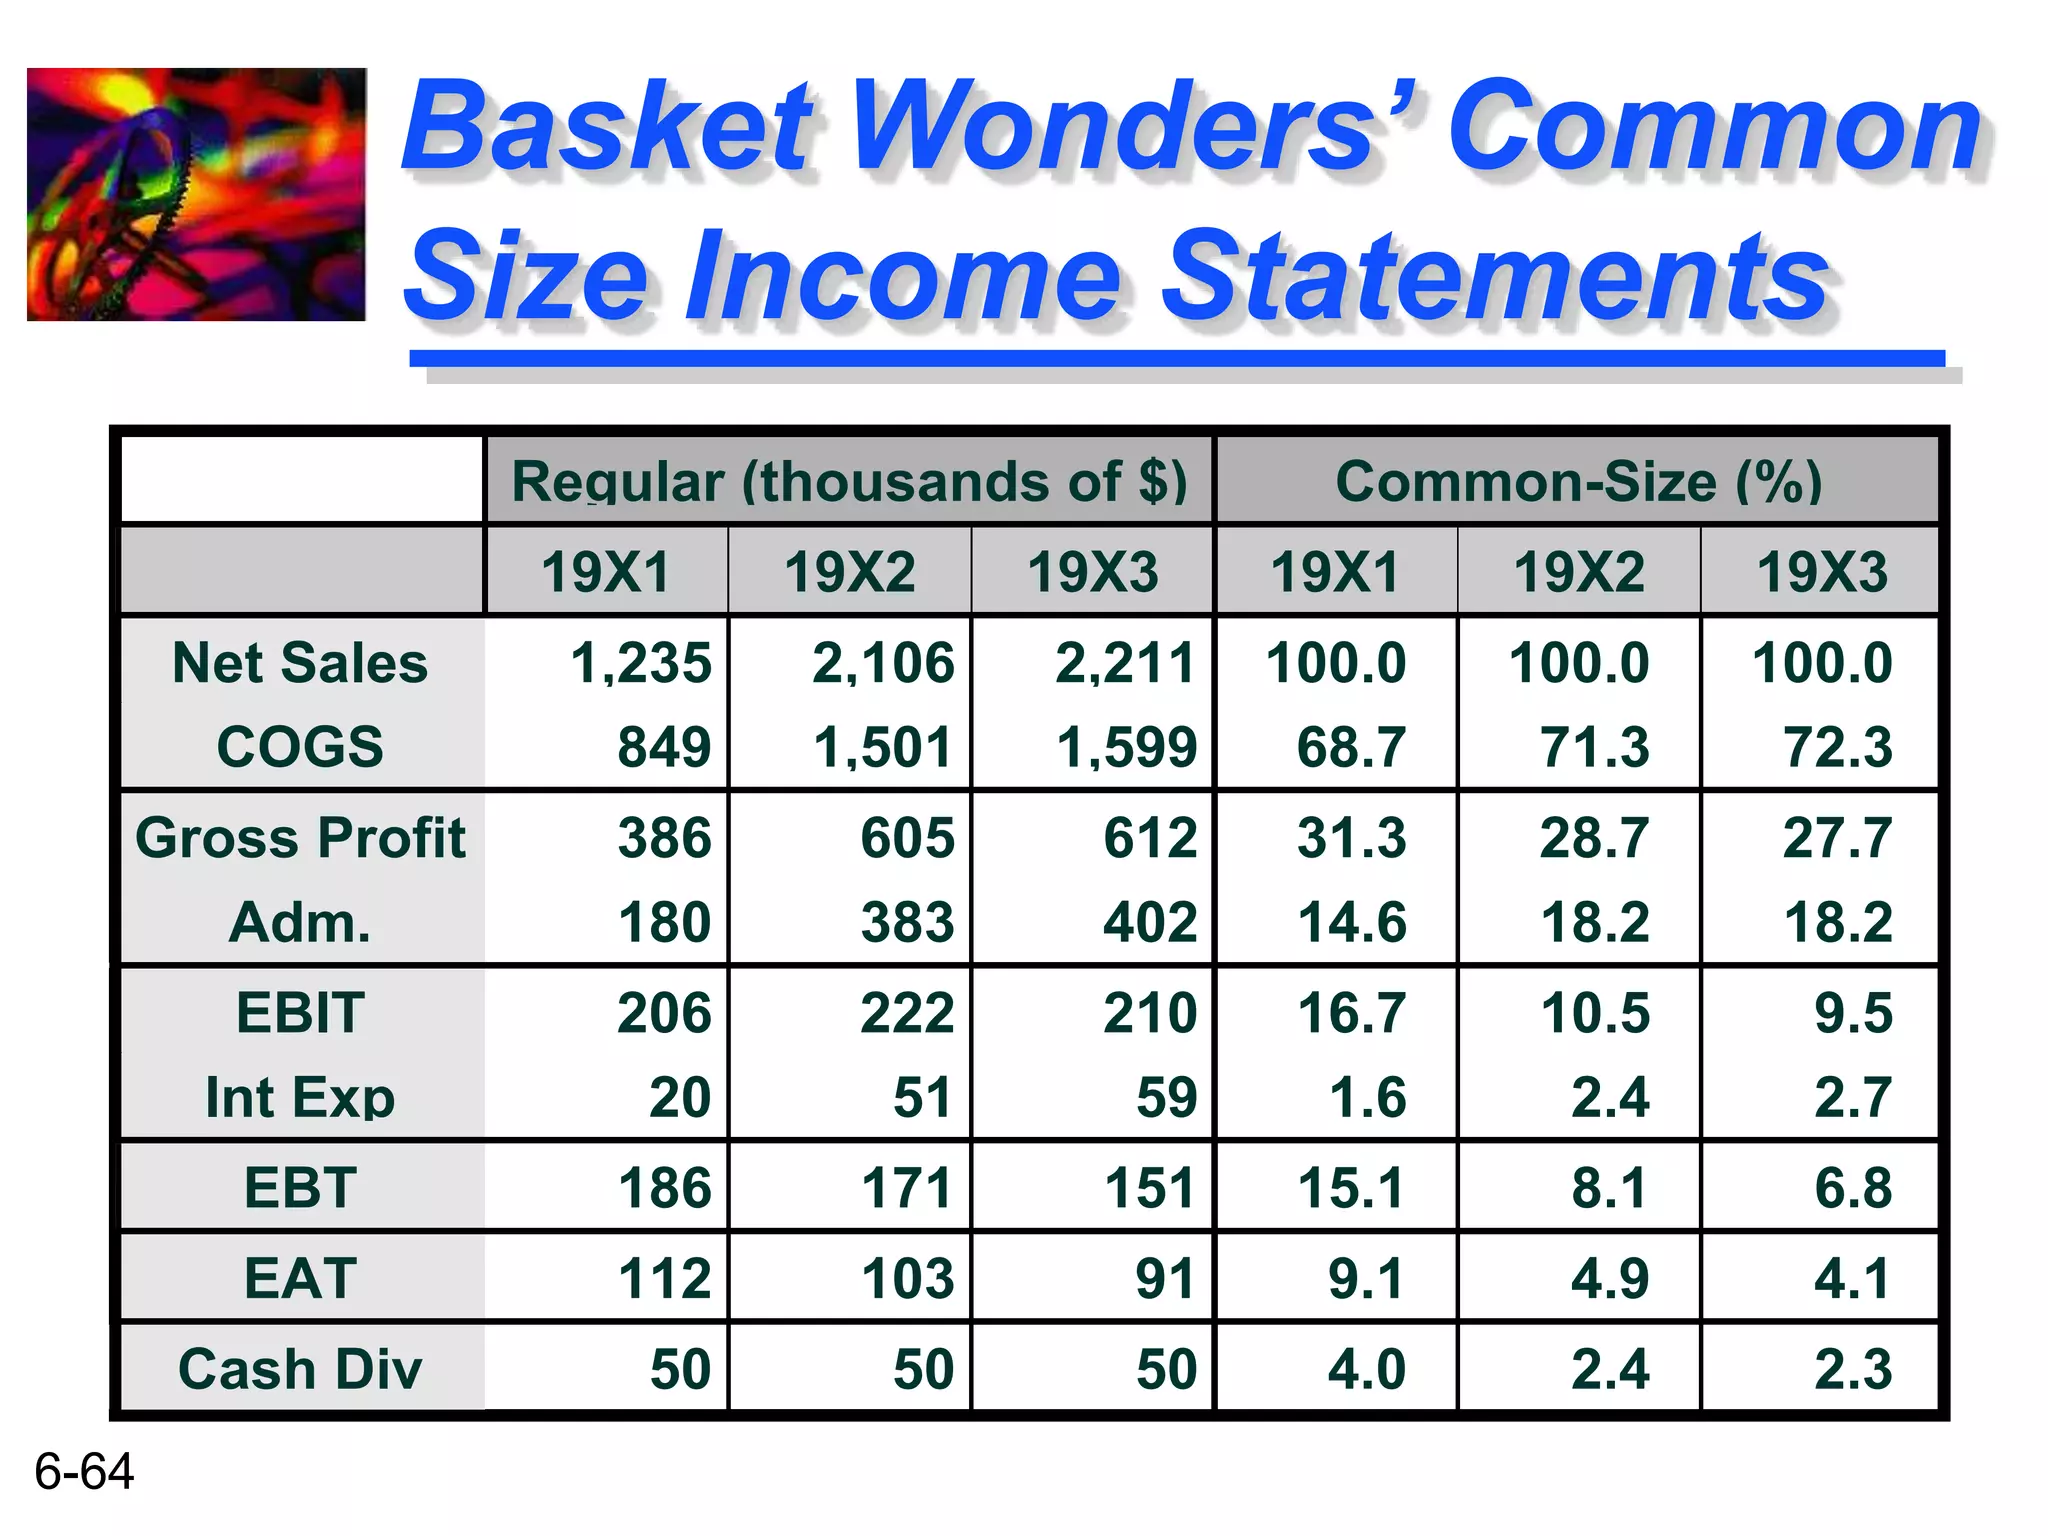
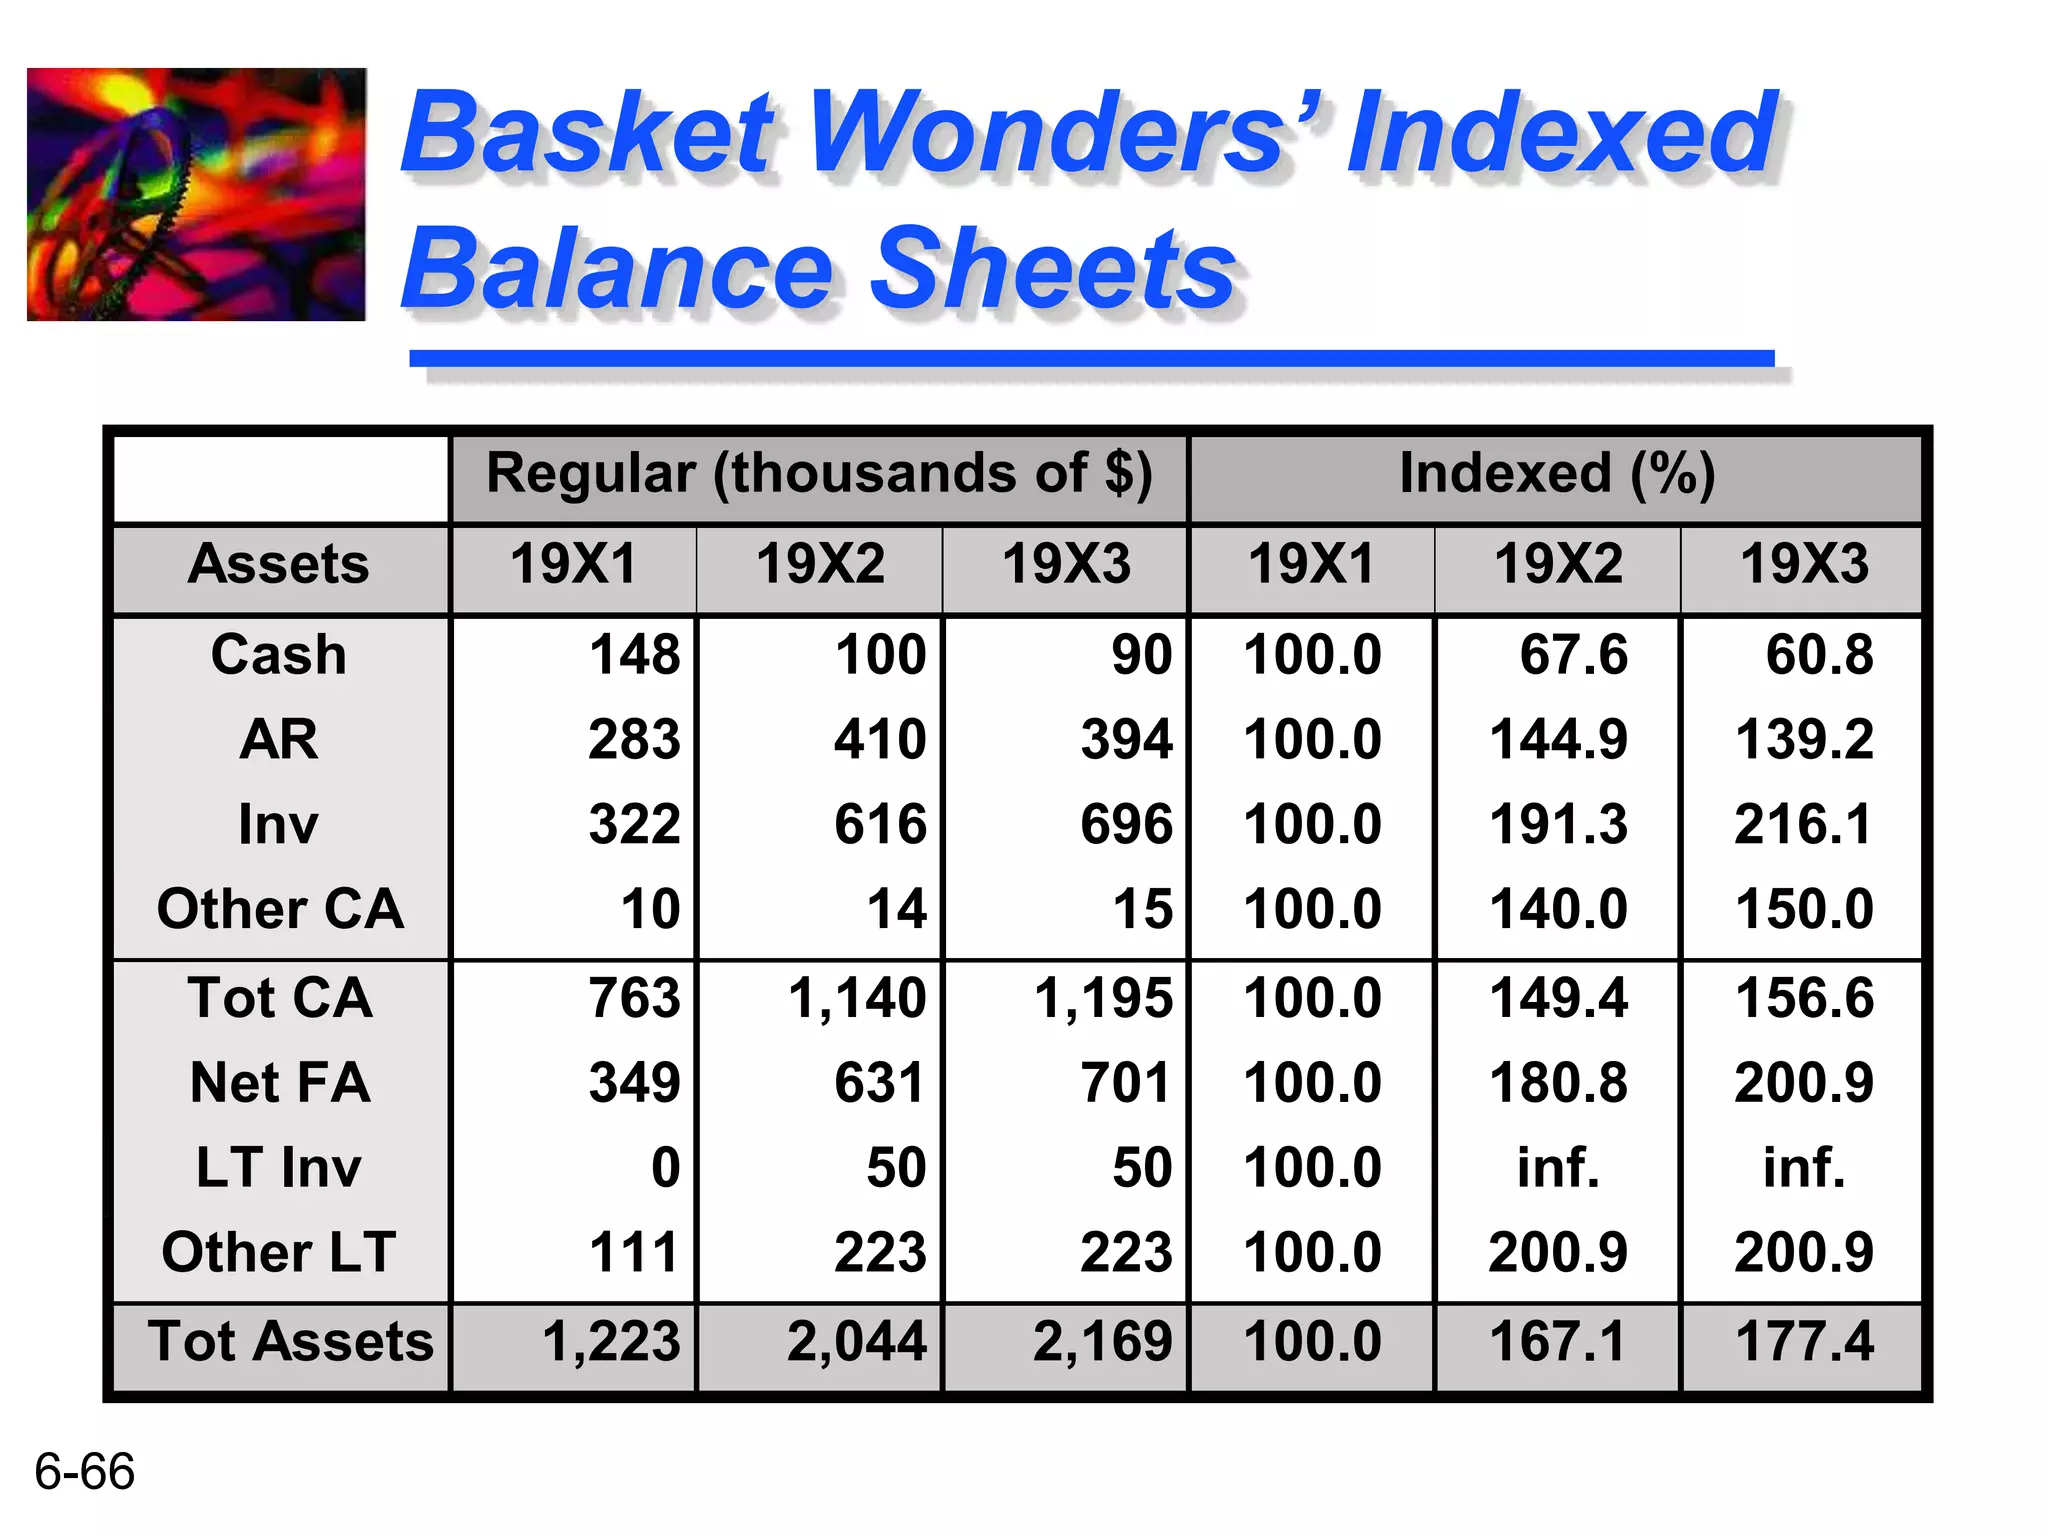
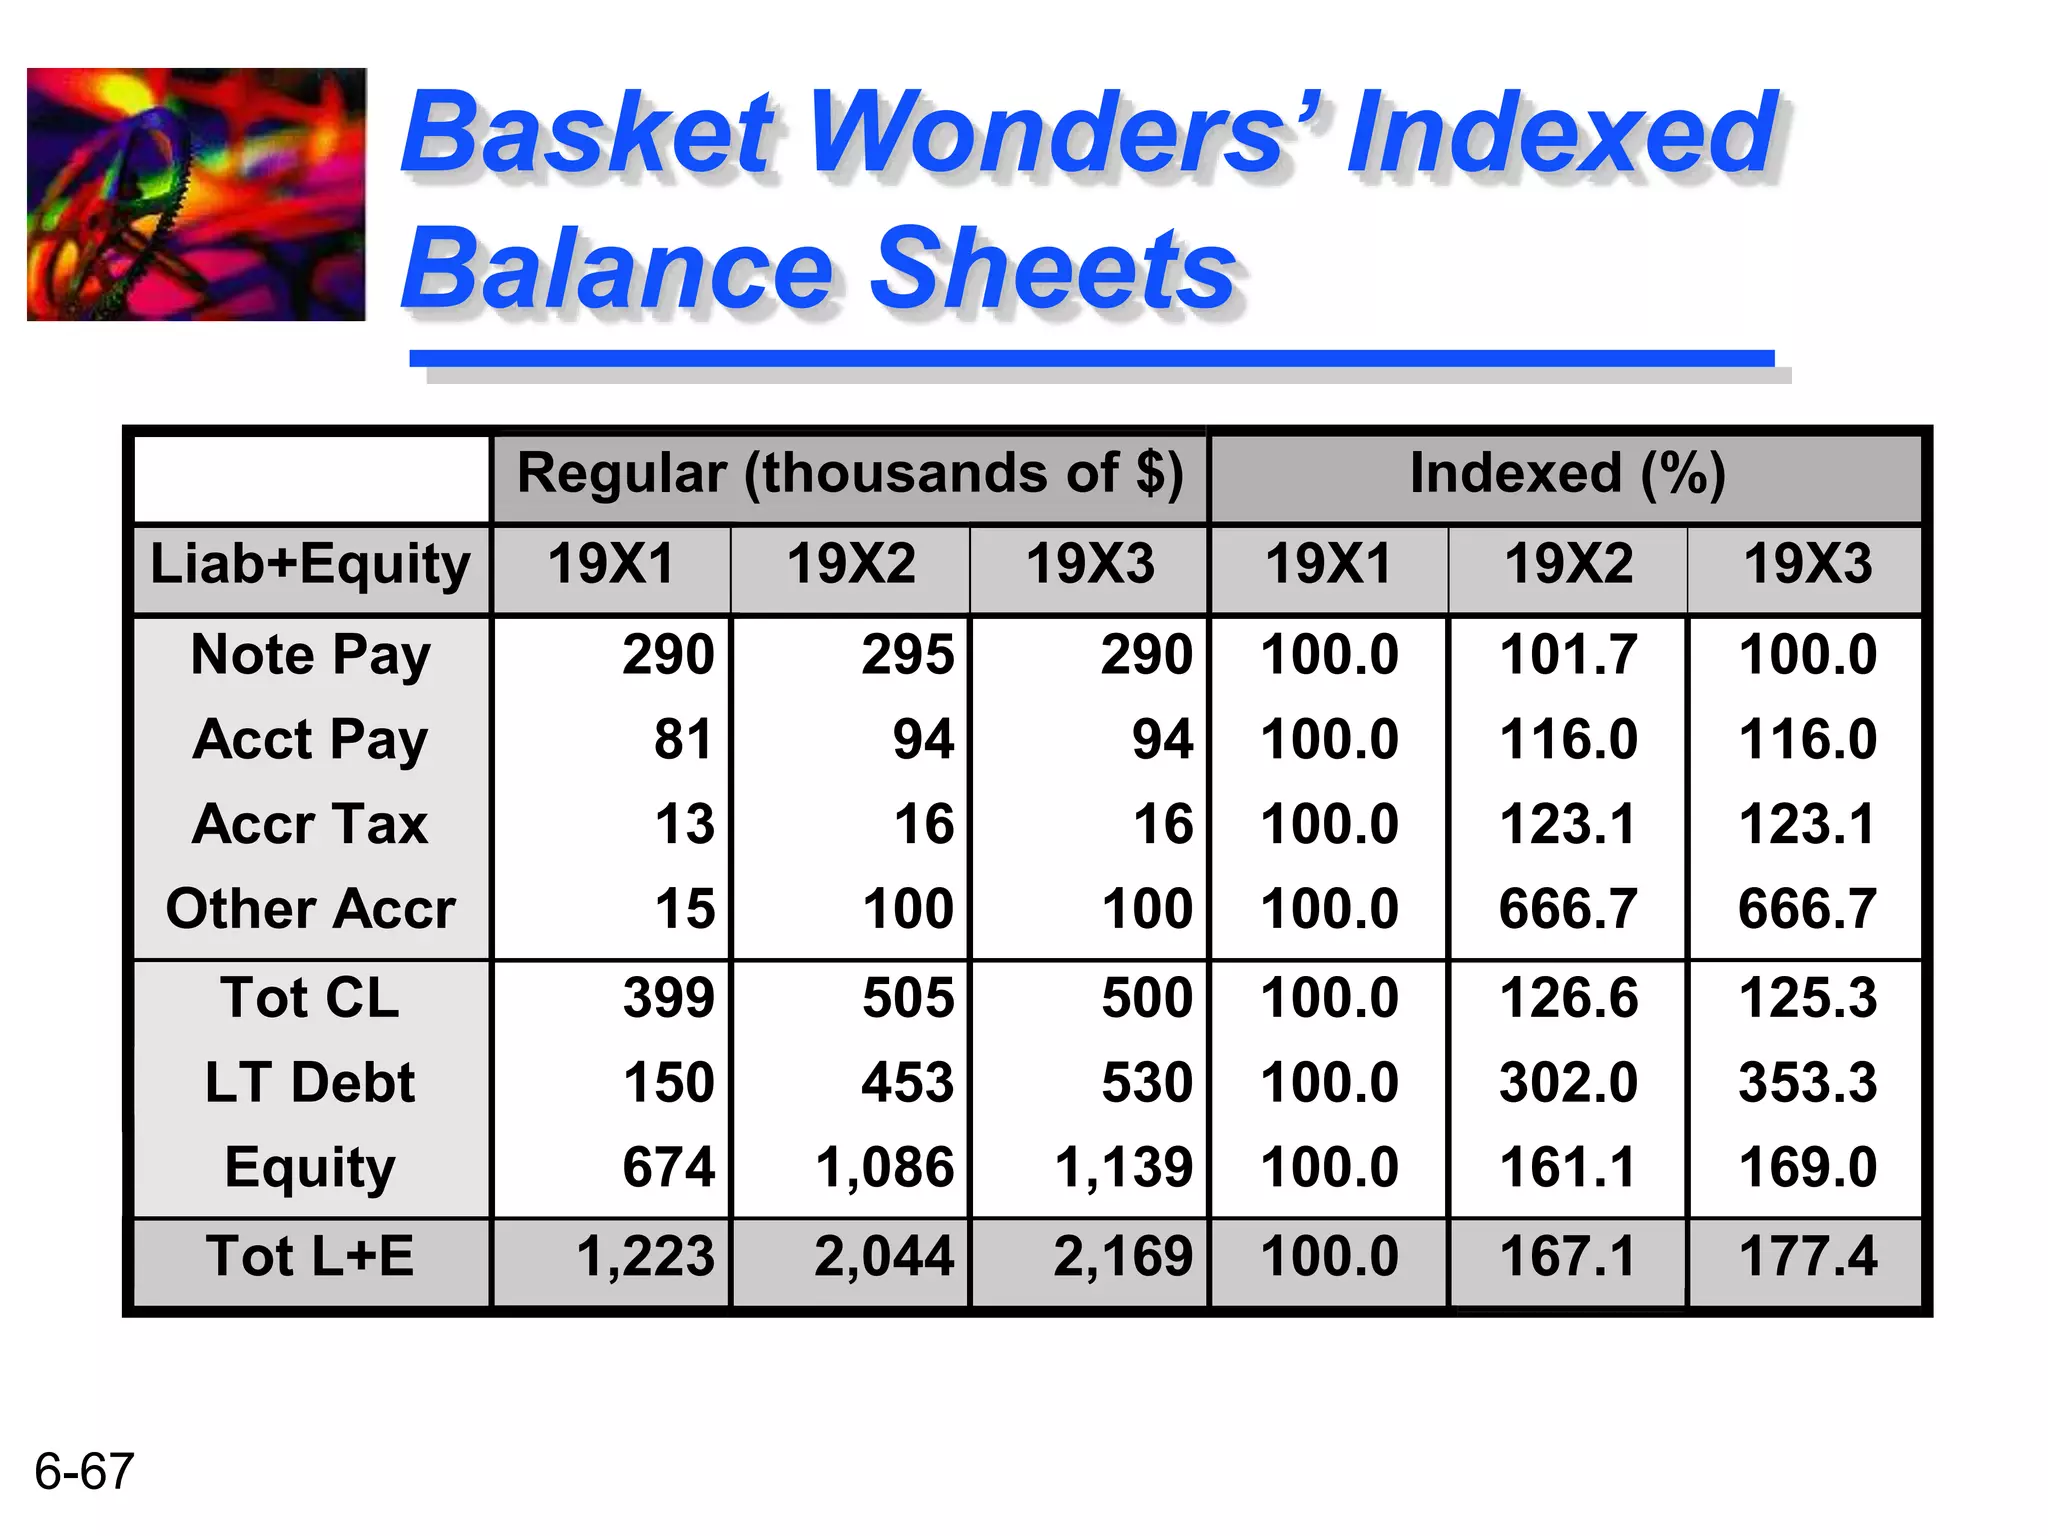
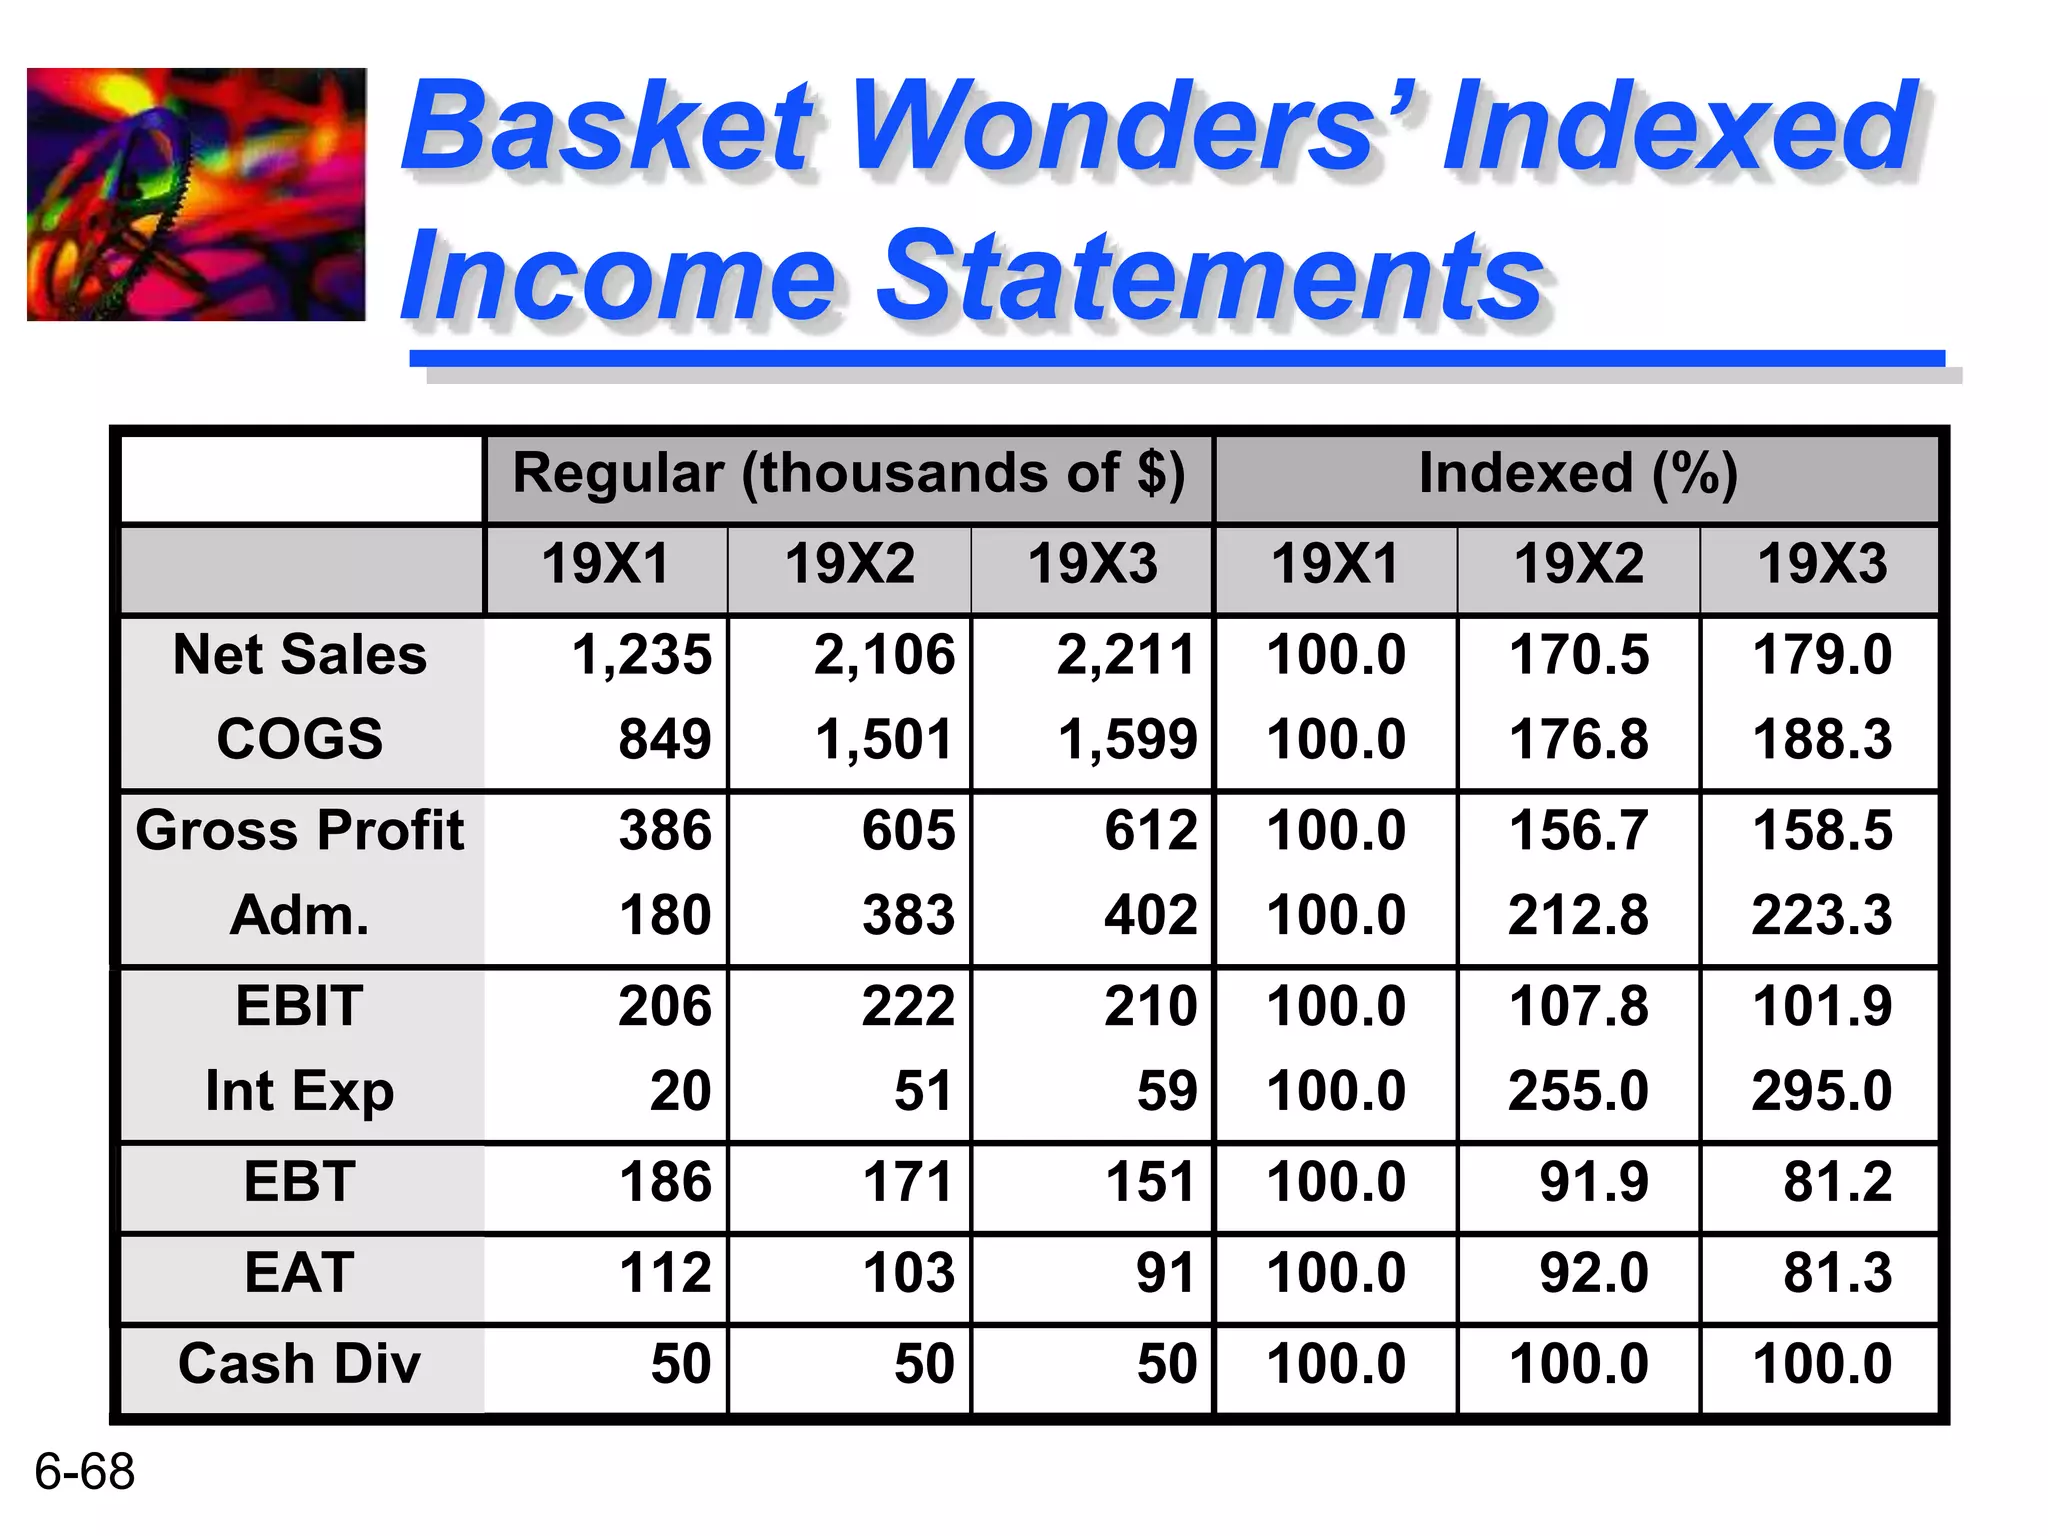
This document provides an overview of financial statement analysis for a company called Basket Wonders. It includes sample financial statements for Basket Wonders including a balance sheet and income statement. It then discusses various types of ratio analysis that can be used to analyze the financial statements including liquidity ratios, leverage ratios, coverage ratios, and activity/turnover ratios. It calculates these ratios for Basket Wonders and compares them to industry averages to identify areas of strength or weakness for the company. Key findings include potential issues with Basket Wonders' inventory levels and lower than average profitability.
How well am i doing? --- financial statement analysis, limitations of financial statement analysis, statements in comparative and common-size forms, dollar and percentage changes on statements, horizontal analysis, trend analysis, common-size statements, ratio analysis. different types of ratios with examples.
Partnerships generally are associated with the practice of law, medicine, public accounting and other professions, and also with small business enterprises
Final Accounts of Clubs and Societies
Introduction.
Receipts and payments account
Calculation of the result of extra activities of a club or
society
Subscription Account
Income and expenditure account
Accumulated fund
Statement of financial position of a club or society
Financial ratios are created with the use of numerical values taken from financial statements to gain meaningful information about a company. The numbers found on a company’s financial statements – balance sheet, income statement, and cash flow statement – are used to perform quantitative analysis and assess a company’s liquidity, leverage, growth, margins, profitability, rates of return, valuation, and more.
Modes of Expression of Ratios:
Ratios may be expressed in any one or more of the following ways:
(a) Proportion,
(b) Rate or times
(c) Percentage.
Advantages of Ratio Analysis:
The information shown in financial statements does not signify anything individually because the facts shown are inter-related. Hence it is necessary to establish relationships between various items to reveal significant details and throw light on all notable financial and operational aspects. Ratio analysis caters to the needs of various parties interested in financial statements. The basic objective of ratio analysis is to help management in interpretation of financial statements to enable it to perform the managerial functions efficiently.
Limitations of Ratio Analysis:
Ratios are precious tools in the hands of management but the utility lies in the proper utilisation of ratios. Mishandling or misuse of ratios and using them without proper context may lead the management to a wrong direction. The financial analyst should be well versed in computing ratios and proper utilization of ratios. Like all techniques of control, ratio analysis also suffers from several ‘ifs and buts’ and for proper computation and utilization of ratios the analyst should be aware of the limitations of ratio analysis.
Uses and Users of Financial Ratio Analysis
Analysis of financial ratios serves two main purposes:
1. Track company performance
Determining individual financial ratios per period and tracking the change in their values over time is done to spot trends that may be developing in a company. For example, an increasing debt-to-asset ratio may indicate that a company is overburdened with debt and may eventually be facing default risk.
2. Make comparative judgments regarding company performance
Comparing financial ratios with that of major competitors is done to identify whether a company is performing better or worse than the industry average. For example, comparing the return on assets between companies helps an analyst or investor to determine which company is making the most efficient use of its assets.
Users of financial ratios include parties external and internal to the company:
External users: Financial analysts, retail investors, creditors, competitors, tax authorities, regulatory authorities, and industry observers
Internal users: Management team, employees, and owners
Effective Devops - Velocity New York 2015 Jennifer Davis
DevOps is a professional and cultural movement designed to improve the processes involved with developing and running computer software and systems. It does this by focusing on communication and collaboration between software developers and operations engineers. DevOps has the potential to improve the products we create as an industry, and the health and well-being of the people creating them.
In this one-day introductory training, you will identify actionable strategies and tools that can be used to leverage DevOps to implement noticeable, long-lasting improvements to your culture and development processes in your environment, regardless of your level and role.
Analysis of Machining Characteristics of Cryogenically Treated Die Steels Usi...IJMER
International Journal of Modern Engineering Research (IJMER) is Peer reviewed, online Journal. It serves as an international archival forum of scholarly research related to engineering and science education.
International Journal of Modern Engineering Research (IJMER) covers all the fields of engineering and science: Electrical Engineering, Mechanical Engineering, Civil Engineering, Chemical Engineering, Computer Engineering, Agricultural Engineering, Aerospace Engineering, Thermodynamics, Structural Engineering, Control Engineering, Robotics, Mechatronics, Fluid Mechanics, Nanotechnology, Simulators, Web-based Learning, Remote Laboratories, Engineering Design Methods, Education Research, Students' Satisfaction and Motivation, Global Projects, and Assessment…. And many more.
International Journal of Modern Engineering Research (IJMER) is Peer reviewed, online Journal. It serves as an international archival forum of scholarly research related to engineering and science education.
Modeling Of a Bucket Air Cooler by Using Solar EnergyIJMER
In a conventional energy sources day to day decreasing in their energy levels. Going green
and conservation as much energy as possible has become the focal point in their eyes of the world.
There are many sources of energy available to us that will conserve our natural resources and decrease
on harmful emissions that are destroying our environment. Many energy sources available in world like
hydro electrical, thermal, mechanical, solar, tidal, bio gas, wave, wind, geothermal, ocean thermal
energy. Many incentives are now available to individuals and industries who implement the use of this
ecofriendly environment through in this direction we are selected solar energy is main sources.
Our design and construction of a bucket air cooler by using solar energy is new alternative to
conventional energy sources. We set out to create an air cooler that does not create any harmful
emissions in environment and provide no pollution in the surrounding. The solar power as the main
energy sources to help in the project work. It is providing to cooling the enclosed space and also
measured the temperature levels of before and after in absorbed enclosed space
Influence of Skidded Distance on the Initial Velocity of Vehicle in Chain Acc...IJMER
International Journal of Modern Engineering Research (IJMER) is Peer reviewed, online Journal. It serves as an international archival forum of scholarly research related to engineering and science education.
https://rb.gy/n89u77
Understand who uses financial ratios and how. Use ratios to analyze a firm’s
liquidity and activity. Discuss the relationship between debt and financial leverage and the ratios used to analyze a firm’s debt. Use ratios to analyze a firm’s profitability and its market
basic financial analysis, framework for ratio analysis, types of ratio analysis, liquidity ratios, debt ratios, equity ratios, activity ratios, profit ratio, index analysis, common size financial statements
Memorandum Of Association Constitution of Company.pptseri bangash
www.seribangash.com
A Memorandum of Association (MOA) is a legal document that outlines the fundamental principles and objectives upon which a company operates. It serves as the company's charter or constitution and defines the scope of its activities. Here's a detailed note on the MOA:
Contents of Memorandum of Association:
Name Clause: This clause states the name of the company, which should end with words like "Limited" or "Ltd." for a public limited company and "Private Limited" or "Pvt. Ltd." for a private limited company.
https://seribangash.com/article-of-association-is-legal-doc-of-company/
Registered Office Clause: It specifies the location where the company's registered office is situated. This office is where all official communications and notices are sent.
Objective Clause: This clause delineates the main objectives for which the company is formed. It's important to define these objectives clearly, as the company cannot undertake activities beyond those mentioned in this clause.
www.seribangash.com
Liability Clause: It outlines the extent of liability of the company's members. In the case of companies limited by shares, the liability of members is limited to the amount unpaid on their shares. For companies limited by guarantee, members' liability is limited to the amount they undertake to contribute if the company is wound up.
https://seribangash.com/promotors-is-person-conceived-formation-company/
Capital Clause: This clause specifies the authorized capital of the company, i.e., the maximum amount of share capital the company is authorized to issue. It also mentions the division of this capital into shares and their respective nominal value.
Association Clause: It simply states that the subscribers wish to form a company and agree to become members of it, in accordance with the terms of the MOA.
Importance of Memorandum of Association:
Legal Requirement: The MOA is a legal requirement for the formation of a company. It must be filed with the Registrar of Companies during the incorporation process.
Constitutional Document: It serves as the company's constitutional document, defining its scope, powers, and limitations.
Protection of Members: It protects the interests of the company's members by clearly defining the objectives and limiting their liability.
External Communication: It provides clarity to external parties, such as investors, creditors, and regulatory authorities, regarding the company's objectives and powers.
https://seribangash.com/difference-public-and-private-company-law/
Binding Authority: The company and its members are bound by the provisions of the MOA. Any action taken beyond its scope may be considered ultra vires (beyond the powers) of the company and therefore void.
Amendment of MOA:
While the MOA lays down the company's fundamental principles, it is not entirely immutable. It can be amended, but only under specific circumstances and in compliance with legal procedures. Amendments typically require shareholder
"𝑩𝑬𝑮𝑼𝑵 𝑾𝑰𝑻𝑯 𝑻𝑱 𝑰𝑺 𝑯𝑨𝑳𝑭 𝑫𝑶𝑵𝑬"
𝐓𝐉 𝐂𝐨𝐦𝐬 (𝐓𝐉 𝐂𝐨𝐦𝐦𝐮𝐧𝐢𝐜𝐚𝐭𝐢𝐨𝐧𝐬) is a professional event agency that includes experts in the event-organizing market in Vietnam, Korea, and ASEAN countries. We provide unlimited types of events from Music concerts, Fan meetings, and Culture festivals to Corporate events, Internal company events, Golf tournaments, MICE events, and Exhibitions.
𝐓𝐉 𝐂𝐨𝐦𝐬 provides unlimited package services including such as Event organizing, Event planning, Event production, Manpower, PR marketing, Design 2D/3D, VIP protocols, Interpreter agency, etc.
Sports events - Golf competitions/billiards competitions/company sports events: dynamic and challenging
⭐ 𝐅𝐞𝐚𝐭𝐮𝐫𝐞𝐝 𝐩𝐫𝐨𝐣𝐞𝐜𝐭𝐬:
➢ 2024 BAEKHYUN [Lonsdaleite] IN HO CHI MINH
➢ SUPER JUNIOR-L.S.S. THE SHOW : Th3ee Guys in HO CHI MINH
➢FreenBecky 1st Fan Meeting in Vietnam
➢CHILDREN ART EXHIBITION 2024: BEYOND BARRIERS
➢ WOW K-Music Festival 2023
➢ Winner [CROSS] Tour in HCM
➢ Super Show 9 in HCM with Super Junior
➢ HCMC - Gyeongsangbuk-do Culture and Tourism Festival
➢ Korean Vietnam Partnership - Fair with LG
➢ Korean President visits Samsung Electronics R&D Center
➢ Vietnam Food Expo with Lotte Wellfood
"𝐄𝐯𝐞𝐫𝐲 𝐞𝐯𝐞𝐧𝐭 𝐢𝐬 𝐚 𝐬𝐭𝐨𝐫𝐲, 𝐚 𝐬𝐩𝐞𝐜𝐢𝐚𝐥 𝐣𝐨𝐮𝐫𝐧𝐞𝐲. 𝐖𝐞 𝐚𝐥𝐰𝐚𝐲𝐬 𝐛𝐞𝐥𝐢𝐞𝐯𝐞 𝐭𝐡𝐚𝐭 𝐬𝐡𝐨𝐫𝐭𝐥𝐲 𝐲𝐨𝐮 𝐰𝐢𝐥𝐥 𝐛𝐞 𝐚 𝐩𝐚𝐫𝐭 𝐨𝐟 𝐨𝐮𝐫 𝐬𝐭𝐨𝐫𝐢𝐞𝐬."
Attending a job Interview for B1 and B2 Englsih learnersErika906060
It is a sample of an interview for a business english class for pre-intermediate and intermediate english students with emphasis on the speking ability.
Implicitly or explicitly all competing businesses employ a strategy to select a mix
of marketing resources. Formulating such competitive strategies fundamentally
involves recognizing relationships between elements of the marketing mix (e.g.,
price and product quality), as well as assessing competitive and market conditions
(i.e., industry structure in the language of economics).
Enterprise Excellence is Inclusive Excellence.pdfKaiNexus
Enterprise excellence and inclusive excellence are closely linked, and real-world challenges have shown that both are essential to the success of any organization. To achieve enterprise excellence, organizations must focus on improving their operations and processes while creating an inclusive environment that engages everyone. In this interactive session, the facilitator will highlight commonly established business practices and how they limit our ability to engage everyone every day. More importantly, though, participants will likely gain increased awareness of what we can do differently to maximize enterprise excellence through deliberate inclusion.
What is Enterprise Excellence?
Enterprise Excellence is a holistic approach that's aimed at achieving world-class performance across all aspects of the organization.
What might I learn?
A way to engage all in creating Inclusive Excellence. Lessons from the US military and their parallels to the story of Harry Potter. How belt systems and CI teams can destroy inclusive practices. How leadership language invites people to the party. There are three things leaders can do to engage everyone every day: maximizing psychological safety to create environments where folks learn, contribute, and challenge the status quo.
Who might benefit? Anyone and everyone leading folks from the shop floor to top floor.
Dr. William Harvey is a seasoned Operations Leader with extensive experience in chemical processing, manufacturing, and operations management. At Michelman, he currently oversees multiple sites, leading teams in strategic planning and coaching/practicing continuous improvement. William is set to start his eighth year of teaching at the University of Cincinnati where he teaches marketing, finance, and management. William holds various certifications in change management, quality, leadership, operational excellence, team building, and DiSC, among others.
Business Valuation Principles for EntrepreneursBen Wann
This insightful presentation is designed to equip entrepreneurs with the essential knowledge and tools needed to accurately value their businesses. Understanding business valuation is crucial for making informed decisions, whether you're seeking investment, planning to sell, or simply want to gauge your company's worth.
RMD24 | Retail media: hoe zet je dit in als je geen AH of Unilever bent? Heid...BBPMedia1
Grote partijen zijn al een tijdje onderweg met retail media. Ondertussen worden in dit domein ook de kansen zichtbaar voor andere spelers in de markt. Maar met die kansen ontstaan ook vragen: Zelf retail media worden of erop adverteren? In welke fase van de funnel past het en hoe integreer je het in een mediaplan? Wat is nu precies het verschil met marketplaces en Programmatic ads? In dit half uur beslechten we de dilemma's en krijg je antwoorden op wanneer het voor jou tijd is om de volgende stap te zetten.
[Note: This is a partial preview. To download this presentation, visit:
https://www.oeconsulting.com.sg/training-presentations]
Sustainability has become an increasingly critical topic as the world recognizes the need to protect our planet and its resources for future generations. Sustainability means meeting our current needs without compromising the ability of future generations to meet theirs. It involves long-term planning and consideration of the consequences of our actions. The goal is to create strategies that ensure the long-term viability of People, Planet, and Profit.
Leading companies such as Nike, Toyota, and Siemens are prioritizing sustainable innovation in their business models, setting an example for others to follow. In this Sustainability training presentation, you will learn key concepts, principles, and practices of sustainability applicable across industries. This training aims to create awareness and educate employees, senior executives, consultants, and other key stakeholders, including investors, policymakers, and supply chain partners, on the importance and implementation of sustainability.
LEARNING OBJECTIVES
1. Develop a comprehensive understanding of the fundamental principles and concepts that form the foundation of sustainability within corporate environments.
2. Explore the sustainability implementation model, focusing on effective measures and reporting strategies to track and communicate sustainability efforts.
3. Identify and define best practices and critical success factors essential for achieving sustainability goals within organizations.
CONTENTS
1. Introduction and Key Concepts of Sustainability
2. Principles and Practices of Sustainability
3. Measures and Reporting in Sustainability
4. Sustainability Implementation & Best Practices
To download the complete presentation, visit: https://www.oeconsulting.com.sg/training-presentations
The world of search engine optimization (SEO) is buzzing with discussions after Google confirmed that around 2,500 leaked internal documents related to its Search feature are indeed authentic. The revelation has sparked significant concerns within the SEO community. The leaked documents were initially reported by SEO experts Rand Fishkin and Mike King, igniting widespread analysis and discourse. For More Info:- https://news.arihantwebtech.com/search-disrupted-googles-leaked-documents-rock-the-seo-world/
Putting the SPARK into Virtual Training.pptxCynthia Clay
This 60-minute webinar, sponsored by Adobe, was delivered for the Training Mag Network. It explored the five elements of SPARK: Storytelling, Purpose, Action, Relationships, and Kudos. Knowing how to tell a well-structured story is key to building long-term memory. Stating a clear purpose that doesn't take away from the discovery learning process is critical. Ensuring that people move from theory to practical application is imperative. Creating strong social learning is the key to commitment and engagement. Validating and affirming participants' comments is the way to create a positive learning environment.
Buy Verified PayPal Account | Buy Google 5 Star Reviewsusawebmarket
Buy Verified PayPal Account
Looking to buy verified PayPal accounts? Discover 7 expert tips for safely purchasing a verified PayPal account in 2024. Ensure security and reliability for your transactions.
PayPal Services Features-
🟢 Email Access
🟢 Bank Added
🟢 Card Verified
🟢 Full SSN Provided
🟢 Phone Number Access
🟢 Driving License Copy
🟢 Fasted Delivery
Client Satisfaction is Our First priority. Our services is very appropriate to buy. We assume that the first-rate way to purchase our offerings is to order on the website. If you have any worry in our cooperation usually You can order us on Skype or Telegram.
24/7 Hours Reply/Please Contact
usawebmarketEmail: support@usawebmarket.com
Skype: usawebmarket
Telegram: @usawebmarket
WhatsApp: +1(218) 203-5951
USA WEB MARKET is the Best Verified PayPal, Payoneer, Cash App, Skrill, Neteller, Stripe Account and SEO, SMM Service provider.100%Satisfection granted.100% replacement Granted.
3.0 Project 2_ Developing My Brand Identity Kit.pptxtanyjahb
A personal brand exploration presentation summarizes an individual's unique qualities and goals, covering strengths, values, passions, and target audience. It helps individuals understand what makes them stand out, their desired image, and how they aim to achieve it.
2. 6-2
Financial
Statement Analysis
Financial Statements
A Possible Framework for Analysis
Ratio Analysis
Trend Analysis
Common-Size and Index Analysis
3. 6-3
Examples of External Uses
of Statement Analysis
Trade Creditors -- Focus on the
liquidity of the firm.
Bondholders -- Focus on the
long-term cash flow of the firm.
Shareholders -- Focus on the
profitability and long-term health of
the firm.
4. 6-4
Examples of Internal Uses
of Statement Analysis
Plan -- Focus on assessing the current
financial position and evaluating
potential firm opportunities.
Control -- Focus on return on investment
for various assets and asset efficiency.
Understand -- Focus on understanding
how suppliers of funds analyze the firm.
5. Balance Sheet
6-5
Primary Types of
Financial Statements
A summary of a firm’s financial position on
a given date that shows total assets = total
liabilities + owners’ equity.
Income Statement
A summary of a firm’s revenues and
expenses over a specified period, ending
with net income or loss for the period.
6. Basket Wonders Balance Sheet (thousands) Dec. 31, 19X3a
6-6
Basket Wonders’ Balance
Sheet (Asset Side)
a. How the firm stands on
a specific date.
b. What BW owned.
c. Amounts owed by
customers.
d. Future expense items
already paid.
e. Cash/likely convertible
to cash within 1 year.
f. Original amount paid.
g. Acc. deductions for
wear and tear.
Cash and C.E. $ 90
Acct. Rec.c 394
Inventories 696
Prepaid Exp d 5
Accum Tax Prepay 10
Current Assetse $1,195
Fixed Assets (@Cost)f 1030
Less: Acc. Depr. g (329)
Net Fix. Assets $ 701
Investment, LT 50
Other Assets, LT 223
Total Assets b $2,169
7. Basket Wonders Balance Sheet (thousands) Dec. 31, 19X3
6-7
Basket Wonders’ Balance
Sheet (Liability Side)
a. Note, Assets =
Liabilities + Equity.
b. What BW owed and
ownership position.
c. Owed to suppliers for
goods and services.
d. Unpaid wages,
salaries, etc.
e. Debts payable < 1 year.
f. Debts payable > 1 year.
g. Original investment.
h. Earnings reinvested.
Notes Payable $ 290
Acct. Payablec 94
Accrued Taxes d 16
Other Accrued Liab. d 100
Current Liab. e $ 500
Long-Term Debt f 530
Shareholders’ Equity
Com. Stock ($1 par) g 200
Add Pd in Capital g 729
Retained Earnings h 210
Total Equity $1,139
Total Liab/Equitya,b $2,169
8. 6-8
Basket Wonders’
Income Statement
Basket Wonders Statement of Earnings (in thousands)
for Year Ending December 31, 19X3a
a. Measures profitability
over a time period.
b. Received, or receivable,
from customers.
c. Sales comm., adv.,
officer’s salaries, etc.
d. Operating income.
e. Cost of borrowed funds.
f. Taxable income.
g. Amount earned for
shareholders.
Net Sales $ 2,211
Cost of Goods Sold b 1,599
Gross Profit $ 612
SG&A Expenses c 402
EBITd $ 210
Interest Expensee 59
EBT f $ 151
Income Taxes 60
EATg $ 91
Cash Dividends 38
Increase in RE $ 53
9. 6-9
Framework for
Financial Analysis
Analytical Tools Used
Sources and Uses Statement
Statement of Cash Flows
Cash Budgets
1. Analysis of the funds
needs of the firm.
Trend / Seasonal Component
How much funding will be
required in the future?
Is there a seasonal
component?
10. 6-10
Framework for
Financial Analysis
Health of a Firm
Financial Ratios
1. Individually
2. Over time
3. In combination
4. In comparison
1. Analysis of the funds
needs of the firm.
2. Analysis of the financial
condition and profitability
of the firm.
11. 6-11
Framework for
Financial Analysis
Examples:
Volatility in sales
Volatility in costs
Proximity to break-even
point
1. Analysis of the funds
needs of the firm.
2. Analysis of the financial
condition and profitability
of the firm.
3. Analysis of the business
risk of the firm.
Business risk relates to
the risk inherent in the
operations of the firm.
12. 6-12
Framework for
Financial Analysis
A Financial
Manager
must
consider all
three jointly
when
determining
the
financing
needs of the
firm.
Determining
the
financing
needs of
the firm.
1. Analysis of the funds
needs of the firm.
2. Analysis of the financial
condition and profitability
of the firm.
3. Analysis of the business
risk of the firm.
13. 6-13
Framework for
Financial Analysis
Negotiations
with
suppliers of
capital.
Determining
the
financing
needs of
the firm.
1. Analysis of the funds
needs of the firm.
2. Analysis of the financial
condition and profitability
of the firm.
3. Analysis of the business
risk of the firm.
14. 6-14
Use of Financial Ratios
Types of
Comparisons
Internal
Comparisons
External
Comparisons
A Financial Ratio is
an index that relates
two accounting
numbers and is
obtained by dividing
one number by the
other.
15. 6-15
External Comparisons and
Sources of Industry Ratios
Examples:
Robert Morris
Associates
Dun & Bradstreet
Almanac of
Business and
Industrial
Financial Ratios
This involves
comparing the ratios
of one firm with those
of similar firms or with
industry averages.
Similarity is important
as one should
compare “apples to
apples”.
16. Balance Sheet Ratios
6-16
Liquidity Ratios
Current
Current Assets
Current Liabilities
For Basket Wonders
December 31, 19X3
Liquidity Ratios
Shows a firm’s
ability to cover its
current liabilities
with its current
assets.
$1,195
$500
= 2.39
17. 6-17
Liquidity Ratio
Comparisons
BW Industry
2.39 2.15
2.26 2.09
1.91 2.01
Year
19X3
19X2
19X1
Current Ratio
Ratio is stronger than the industry average.
18. Balance Sheet Ratios
6-18
Liquidity Ratios
Acid-Test (Quick)
Current Assets - Inv
Current Liabilities
For Basket Wonders
December 31, 19X3
Liquidity Ratios
Shows a firm’s
ability to meet
current liabilities
with its most liquid
assets.
$1,195 - $696
$500
= 1.00
19. 6-19
Liquidity Ratio
Comparisons
BW Industry
1.00 1.25
1.04 1.23
1.11 1.25
Year
19X3
19X2
19X1
Acid-Test Ratio
Ratio is weaker than the industry average.
20. 6-20
Summary of the Liquidity
Ratio Comparisons
Ratio BW Industry
Current 2.39 2.15
Acid-Test1.00 1.25
Strong current ratio and weak acid-test
ratio indicates a potential problem in the
inventories account.
Note that this industry has a relatively
high level of inventories.
21. 6-21
Current Ratio -- Trend
Analysis Comparison
Trend Analysis of Current Ratio
2.5
2.3
2.1
1.9
1.7
1.5
19X1 19X2 19X3
Analysis Year
Ratio Value
BW
Industry
22. 6-22
Acid-Test Ratio -- Trend
Analysis Comparison
Trend Analysis of Acid-Test Ratio
1.5
1.3
1.0
0.8
0.5
19X1 19X2 19X3
Analysis Year
Ratio Value
BW
Industry
23. The current ratio for BW has been rising
6-23
Summary of the Liquidity
Trend Analyses
at the same time the acid-test ratio has
been declining.
The current ratio for the industry has
been rising slowly at the same time the
acid-test ratio has been relatively stable.
This indicates that inventories are a
significant problem for BW.
24. Balance Sheet Ratios
6-24
Financial Leverage Ratios
Debt-to-Equity
Total Debt
Shareholders’ Equity
For Basket Wonders
December 31, 19X3
Financial Leverage
Ratios
Show the extent to
which the firm is
financed by debt.
$1,030
$1,139
= .90
25. 6-25
Financial Leverage
Ratio Comparisons
Debt-to-Equity Ratio
BW Industry
.90 .90
.88 .90
.81 .89
Year
19X3
19X2
19X1
BW has average debt utilization
relative to the industry average.
26. Balance Sheet Ratios
6-26
Financial Leverage Ratios
Debt-to-Total-Assets
Total Debt
Total Assets
For Basket Wonders
Financial Leverage
Ratios
Show the percentage December 31, 19X3
of the firm’s assets
that are supported by
debt financing.
$1,030
$2,169
= .47
27. 6-27
Financial Leverage
Ratio Comparisons
Debt-to-Total-Asset Ratio
BW Industry
.47 .47
.47 .47
.45 .47
Year
19X3
19X2
19X1
BW has average debt utilization
relative to the industry average.
28. Balance Sheet Ratios
6-28
Financial Leverage Ratios
Total Capitalization
(i.e., LT-Debt + Equity)
Total Debt
Total Capitalization
For Basket Wonders
December 31, 19X3
Financial Leverage
Ratios
Show the relative
importance of long-term
debt to the long-term
financing of the firm.
$1,030
$1,669
= .62
29. 6-29
Financial Leverage
Ratio Comparisons
Total Capitalization Ratio
BW Industry
.62 .60
.62 .61
.67 .62
Year
19X3
19X2
19X1
BW has average long-term debt utilization
relative to the industry average.
30. 6-30
Coverage Ratios
Interest Coverage
EBIT
Interest Charges
For Basket Wonders
Income Statement
Ratios
Coverage Ratios
Indicates a firm’s December 31, 19X3
ability to cover
interest charges.
$210
$59
= 3.56
31. 6-31
Coverage
Ratio Comparisons
Interest Coverage Ratio
BW Industry
3.56 5.19
4.35 5.02
10.30 4.66
Year
19X3
19X2
19X1
BW has below average interest coverage
relative to the industry average.
32. 6-32
Coverage Ratio -- Trend
Analysis Comparison
Trend Analysis of Interest Coverage Ratio
11.0
9.0
7.0
5.0
3.0
19X1 19X2 19X3
Analysis Year
Ratio Value
BW
Industry
33. The interest coverage ratio for BW has
6-33
Summary of the Coverage
Trend Analysis
been falling since 19X1. It has been
below industry averages for the past
two years.
This indicates that low earnings (EBIT)
may be a potential problem for BW.
Note, we know that debt levels are in
line with the industry averages.
34. Income Statement /
6-34
Activity Ratios
Receivable Turnover
(Assume all sales are credit sales.)
Annual Net Credit Sales
Receivables
For Basket Wonders
Balance Sheet
Ratios
Activity Ratios
Indicates quality of December 31, 19X3
receivables and how
successful the firm is in
its collections.
$2,211
$394
= 5.61
35. Income Statement /
6-35
Activity Ratios
Avg Collection Period
Days in the Year
Receivable Turnover
For Basket Wonders
Balance Sheet
Ratios
Activity Ratios
Average number of days December 31, 19X3
that receivables are
outstanding.
(or RT in days)
365
5.61
= 65 days
36. 6-36
Activity
Ratio Comparisons
Average Collection Period
BW Industry
65.0 65.7
71.1 66.3
83.6 69.2
Year
19X3
19X2
19X1
BW has improved the average collection
period to that of the industry average.
37. Income Statement /
6-37
Activity Ratios
Payable Turnover (PT)
(Assume annual credit
purchases = $1,551.)
Annual Credit Purchases
Accounts Payable
For Basket Wonders
December 31, 19X3
Balance Sheet
Ratios
Activity Ratios
Indicates the
promptness of payment
to suppliers by the firm.
$1551
$94
= 16.5
38. Income Statement /
6-38
Activity Ratios
PT in Days
Days in the Year
Payable Turnover
For Basket Wonders
December 31, 19X3
Balance Sheet
Ratios
Activity Ratios
Average number of days
that payables are
outstanding.
365
16.5
= 22.1 days
39. 6-39
Activity Ratio Comparisons
Payable Turnover in Days
BW Industry
22.1 46.7
25.4 51.1
43.5 48.5
Year
19X3
19X2
19X1
BW has improved the PT in Days.
Is this good?
40. Income Statement /
6-40
Activity Ratios
Inventory Turnover
Cost of Goods Sold
Inventory
For Basket Wonders
December 31, 19X3
Balance Sheet
Ratios
Activity Ratios
Indicates the
effectiveness of the
inventory management
practices of the firm.
$1,599
$696
= 2.30
41. 6-41
Activity Ratio Comparisons
Inventory Turnover Ratio
BW Industry
2.30 3.45
2.44 3.76
2.64 3.69
Year
19X3
19X2
19X1
BW has a very poor inventory turnover ratio.
42. 6-42
Inventory Turnover Ratio --
Trend Analysis Comparison
Trend Analysis of Inventory Turnover Ratio
4.0
3.5
3.0
2.5
2.0
19X1 19X2 19X3
Analysis Year
Ratio Value
BW
Industry
43. Income Statement /
6-43
Activity Ratios
Total Asset Turnover
Net Sales
Total Assets
For Basket Wonders
December 31, 19X3
Balance Sheet
Ratios
Activity Ratios
Indicates the overall
effectiveness of the firm
in utilizing its assets to
generate sales.
$2,211
$2,169
= 1.02
44. 6-44
Activity Ratio Comparisons
Total Asset Turnover Ratio
BW Industry
1.02 1.17
1.03 1.14
1.01 1.13
Year
19X3
19X2
19X1
BW has a weak total asset turnover ratio.
Why is this ratio considered weak?
45. Income Statement /
Profitability Ratios
6-45
Profitability Ratios
Gross Profit Margin
Gross Profit
Net Sales
For Basket Wonders
December 31, 19X3
Balance Sheet
Ratios
Indicates the efficiency
of operations and firm
pricing policies.
$612
$2,211
= .277
46. 6-46
Profitability
Ratio Comparisons
Gross Profit Margin
BW Industry
27.7% 31.1%
28.7 30.8
31.3 27.6
Year
19X3
19X2
19X1
BW has a weak Gross Profit Margin.
47. 6-47
Gross Profit Margin --
Trend Analysis
Comparison
Trend Analysis of Gross Profit Margin
35.0
32.5
30.0
27.5
25.0
19X1 19X2 19X3
Analysis Year
Ratio Value (%)
BW
Industry
48. Income Statement /
Profitability Ratios
6-48
Profitability Ratios
Net Profit Margin
Net Profit after Taxes
Net Sales
For Basket Wonders
December 31, 19X3
Balance Sheet
Ratios
Indicates the firm’s
profitability after taking
account of all expenses
and income taxes.
$91
$2,211
= .041
49. 6-49
Profitability
Ratio Comparisons
BW Industry
4.1% 8.2%
4.9 8.1
9.0 7.6
Year
19X3
19X2
19X1
Net Profit Margin
BW has a poor Net Profit Margin.
50. 6-50
Net Profit Margin --
Trend Analysis
Comparison
Trend Analysis of Net Profit Margin
10
9
8
7
6
5
4
19X1 19X2 19X3
Analysis Year
Ratio Value (%)
BW
Industry
51. Income Statement /
Profitability Ratios
6-51
Profitability Ratios
Return on Investment
Net Profit after Taxes
Total Assets
For Basket Wonders
Balance Sheet
Ratios
Indicates the December 31, 19X3
profitability on the
assets of the firm (after
all expenses and taxes).
$91
$2,160
= .042
52. 6-52
Profitability
Ratio Comparisons
Return on Investment
BW Industry
4.2% 9.8%
5.0 9.1
9.1 10.8
Year
19X3
19X2
19X1
BW has a poor Return on Investment.
53. 6-53
Return on Investment --
Trend Analysis
Comparison
Trend Analysis of Return on Investment
12
10
8
6
4
19X1 19X2 19X3
Analysis Year
Ratio Value (%)
BW
Industry
54. Income Statement /
Profitability Ratios
6-54
Profitability Ratios
Return on Equity
Net Profit after Taxes
Shareholders’ Equity
For Basket Wonders
Balance Sheet
Ratios
Indicates the profitability December 31, 19X3
to the shareholders of
the firm (after all
expenses and taxes).
$91
$1,139
= .08
55. 6-55
Profitability
Ratio Comparisons
BW Industry
8.0% 17.9%
9.4 17.2
16.6 20.4
Year
19X3
19X2
19X1
Return on Equity
BW has a poor Return on Equity.
56. 6-56
Return on Equity --
Trend Analysis
Comparison
Trend Analysis of Return on Equity
21.0
17.5
14.0
10.5
7.0
19X1 19X2 19X3
Analysis Year
Ratio Value (%)
BW
Industry
57. 6-57
Return on Investment and
the Du Pont Approach
Earning Power = Sales profitability X
Asset efficiency
ROI = Net profit margin X
Total asset turnover
ROI19X3 = .041 x 1.02 = .042 or 4.2%
ROIIndustry = .082 x 1.17 = .098 or 9.8%
58. Equity Multiplier =
6-58
Return on Equity and
the Du Pont Approach
Return On Equity = Net profit margin X
Total asset turnover X
Equity Multiplier
Total Assets
Shareholders’ Equity
ROE19X3 = .041 x 1.02 x 1.90 = .080
ROEIndustry = .082 x 1.17 x 1.88 = .179
59. 6-59
Summary of Ratio Analyses
Inventories are too high.
May be paying off creditors
(accounts payable) too soon.
COGS may be too high.
Selling, general, and
administrative costs may be too
high.
60. 6-60
Summary of the Profitability
Trend Analyses
The profitability ratios for BW have ALL
been falling since 19X1. Each has been
below the industry averages for the past
three years.
This indicates that COGS and
administrative costs may both be too
high and a potential problem for BW.
Note, this result is consistent with the low
interest coverage ratio.
61. 6-61
Common-size Analysis
An analysis of percentage
financial statements where all
balance sheet items are divided
by total assets and all income
statement items are divided by
net sales or revenues.
62. 6-62
Basket Wonders’ Common
Size Balance Sheets
Regular (thousands of $) Common-Size (%)
Assets 19X1 19X2 19X3 19X1 19X2 19X3
Cash 148 100 90 12.10 4.89 4.15
AR 283 410 394 23.14 20.06 18.17
Inv 322 616 696 26.33 30.14 32.09
Other CA 10 14 15 0.82 0.68 0.69
Tot CA 763 1,140 1,195 62.39 55.77 55.09
Net FA 349 631 701 28.54 30.87 32.32
LT Inv 0 50 50 0.00 2.45 2.31
Other LT 111 223 223 9.08 10.91 10.28
Tot Assets 1,223 2,044 2,169 100.0 100.0 100.0
65. 6-65
Index Analyses
An analysis of percentage financial
statements where all balance sheet
or income statement figures for a
base year equal 100.0 (percent) and
subsequent financial statement
items are expressed as percentages
of their values in the base year.
66. 6-66
Basket Wonders’ Indexed
Balance Sheets
Regular (thousands of $) Indexed (%)
Assets 19X1 19X2 19X3 19X1 19X2 19X3
Cash 148 100 90 100.0 67.6 60.8
AR 283 410 394 100.0 144.9 139.2
Inv 322 616 696 100.0 191.3 216.1
Other CA 10 14 15 100.0 140.0 150.0
Tot CA 763 1,140 1,195 100.0 149.4 156.6
Net FA 349 631 701 100.0 180.8 200.9
LT Inv 0 50 50 100.0 inf. inf.
Other LT 111 223 223 100.0 200.9 200.9
Tot Assets 1,223 2,044 2,169 100.0 167.1 177.4