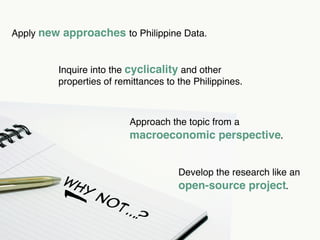
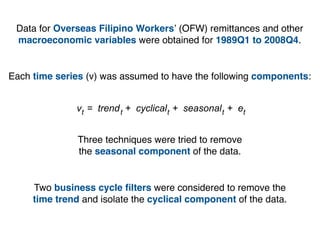
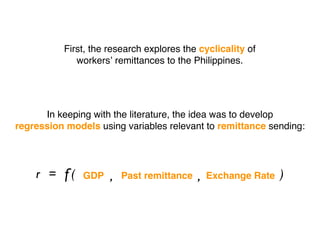
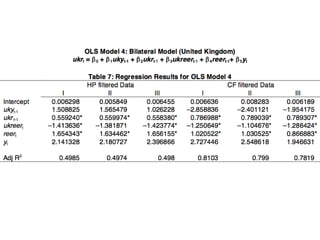
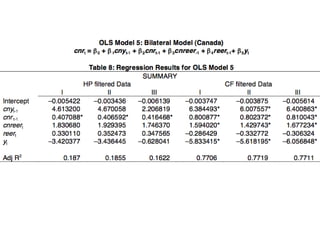
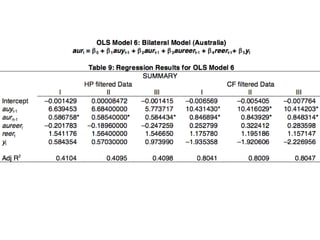
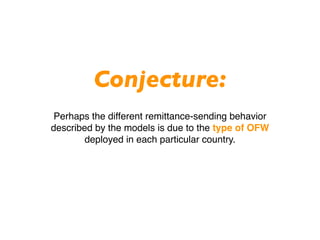
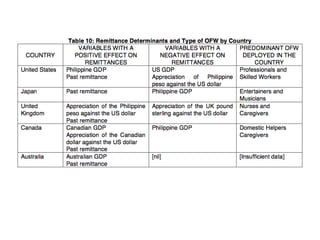
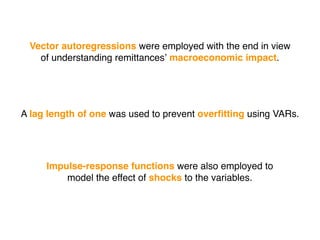
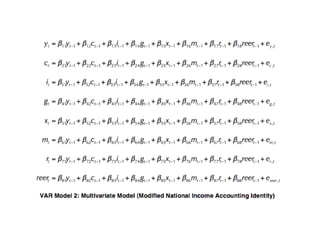
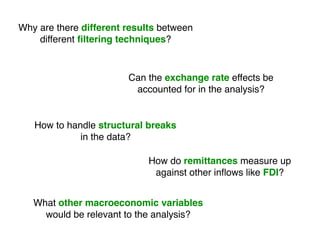
Properties
   of
      Philippine
Remittances
         (An Econometric Analysis)


     Dissertation Proposal
This
Presentation
        will touch upon:

    The Motivation for the research.


    A description of the data Treatment.


    Initial departures and preliminary Results.


    Issues and Directions to explore.
The
Motivation
      for the research.
Remittances
       are particularly significant
  for the   Philippines
              and for Filipinos .
The Filipino Diaspora and Workers’ Remittances
15


10


 5


 0
      2000      2001          2002             2003           2004           2005            2006           2007
             Overseas Filipinos                              Workers’ Remittances
             (in Millions of Filipinos)                         (in Nominal US$ Billions)

                                          Sources: International Labor Organisation (2009) and Bangko Sentral ng Pilipinas (2008)
The Seven Largest Remittance Recipient Countries
      India

    China

   Mexico

Philippines

   France

     Spain

 Germany

              0               15                     30                       45                       60

                        Remittances                               % of GDP
                  (in Nominal US$ Billions)                     (2008 GDP)
                                              Source: The World Bank Migration and Remittances Data (November 2009)
“Stylized facts”about remittances
                                                  SOME
                                                    tions
contrast with findings from individual
country cases.
                                           Ob  serva
                                                          e
                                                abo ut th
                                                           e
                                                lite ratur
                                                                S)
 Some approaches have yet to be applied                   TANCE
                                               (ON   REMIT
 to the Philippine case.


      Many studies have approached the topic
      from a development perspective.


                  Of the approximately 102,000 articles
                  on remittances available on Google Scholar,
                  not a single one was written by me!
Apply new approaches to Philippine Data.


         Inquire into the cyclicality and other
         properties of remittances to the Philippines.


                          Approach the topic from a


        -
                          macroeconomic perspective.


                                      Develop the research like an
          Wh                          open-source project.
               y
                   No
                       t..
                          .?
The
 Treatment
    applied to the data
Data for Overseas Filipino Workers’ (OFW) remittances and other
 macroeconomic variables were obtained for 1989Q1 to 2008Q4.


Each time series (v) was assumed to have the following components:


              vt = trend t + cyclical t + seasonal t + et


               Three techniques were tried to remove
               the seasonal component of the data.


     Two business cycle filters were considered to remove the
     time trend and isolate the cyclical component of the data.
ln(y) (Raw Data)                                        ln(r) (Raw Data)


                                                           5.0
    7.4


                                                           4.5
    7.2


                                                           4.0
    7.0
y


                                                       r

                                                           3.5
    6.8


                                                           3.0
    6.6


          1990      1995          2000          2005             1990      1995          2000          2005

                 Quarterly Frequency, 1989Q1-2004Q4
                                      1989Q1-2008Q4                     Quarterly Frequency, 1989Q1-2004Q4
                                                                                             1989Q1-2008Q4
HP Filtered y by Seasonal Adjustment Technique                                            CF Filtered y by Seasonal Adjustment Technique
                        0.04


                                                                                                                  0.02
                        0.02
Growth Rate (Percent)


                                                                                          Growth Rate (Percent)

                                                                                                                  0.00
                        0.00
                        -0.02


                                                                                                                  -0.02
                        -0.04


                                                                                                                  -0.04
                                                                     by LOESS                                                                                 by LOESS
                                                                     by Moving Averages                                                                       by Moving Averages
                                                                     by Dummy Variables                                                                       by Dummy Variables


                                1990         1995          2000          2005                                             1990        1995          2000          2005

                                        Quarterly Frequency: 1989Q1 to 2008Q4                                                    Quarterly Frequency: 1989Q1 to 2008Q4
                                           Percentages are Normalized to 1                                                          Percentages are Normalized to 1
HP-Filtered r by Seasonal Adjustment Technique                                          CF Filtered r by Seasonal Adjustment Technique


                                                                                                                0.4
                        0.6


                                                                                                                0.3
                        0.4


                                                                                                                0.2
Growth Rate (Percent)


                                                                                        Growth Rate (Percent)
                        0.2


                                                                                                                0.1
                                                                                                                0.0
                        0.0


                                                                                                                -0.1
                        -0.2


                                                                                                                -0.2
                                                                   by LOESS                                                                                by LOESS
                        -0.4


                                                                   by Moving Averages                                                                      by Moving Averages
                                                                   by Dummy Variables                                                                      by Dummy Variables
                                                                                                                -0.3


                               1990        1995          2000          2005                                            1990        1995          2000          2005

                                      Quarterly Frequency: 1989Q1 to 2008Q4                                                   Quarterly Frequency: 1989Q1 to 2008Q4
                                         Percentages are Normalized to 1                                                         Percentages are Normalized to 1
Preliminary
     Results thus far
  from work on the topic
First, the research explores the cyclicality of
             workers’ remittances to the Philippines.


      In keeping with the literature, the idea was to develop
regression models using variables relevant to remittance sending:


    r = f(     GDP   ,   Past remittance   ,   Exchange Rate   )
Conjecture:
 Perhaps the different remittance-sending behavior
described by the models is due to the type of OFW
        deployed in each particular country.
Vector autoregressions were employed with the end in view
   of understanding remittances’ macroeconomic impact.


A lag length of one was used to prevent overfitting using VARs.


     Impulse-response functions were also employed to
         model the effect of shocks to the variables.
IRFS USING HP-FILTERED DATA

                Orthogonal Impulse Response from hp.ya                            Orthogonal Impulse Response from hp.ra


                                                                      0.15
        0.02


                                                                      0.10
                                                              hp.ya
hp.ya

        0.00


                                                                      0.05
        -0.02


                                                                      0.15 0.00
                                    xy$x                                                              xy$x
        0.02


                                                                      0.10
                                                              hp.ra
hp.ra

        0.00


                                                                      0.05
        -0.02


                                                                      0.00


                0   1   2   3   4    5     6   7   8   9 10                       0   1   2   3   4    5     6   7   8   9 10
IRFS USING CF-FILTERED DATA
               Orthogonal Impulse Response from cf.ya                             Orthogonal Impulse Response from cf.ra


                                                                     0.06
        0.02


                                                                     0.04
        0.01
cf.ya


                                                             cf.ya

                                                                     0.02
                                                                     0.00
        0.00


                                                                     0.06 -0.02
        0.02


                                   xy$x                                                               xy$x
                                                                     0.04
        0.01
cf.ra


                                                             cf.ra

                                                                     0.02
                                                                     0.00
        0.00


                                                                     -0.02


               0   1   2   3   4    5     6   7   8   9 10                        0   1   2   3   4    5     6   7   8   9 10
Issuesand
   Directions
          to explore
Why are there different results between
    different filtering techniques?


                        Can the exchange rate effects be
                         accounted for in the analysis?


   How to handle structural breaks
             in the data?

                             How do remittances measure up
                              against other inflows like FDI?


   What other macroeconomic variables
     would be relevant to the analysis?
END OF PRESENTATION
T   H   A   N    K         Y    O     U


            Brian L. Belen
                bbelen@gmail.com
                brianbelen.blogspot.com
                @brianbelen

My Dissertation Proposal

  • 1.
    Properties of Philippine Remittances (An Econometric Analysis) Dissertation Proposal
  • 2.
    This Presentation will touch upon: The Motivation for the research. A description of the data Treatment. Initial departures and preliminary Results. Issues and Directions to explore.
  • 3.
    The Motivation for the research.
  • 4.
    Remittances are particularly significant for the Philippines and for Filipinos .
  • 5.
    The Filipino Diasporaand Workers’ Remittances 15 10 5 0 2000 2001 2002 2003 2004 2005 2006 2007 Overseas Filipinos Workers’ Remittances (in Millions of Filipinos) (in Nominal US$ Billions) Sources: International Labor Organisation (2009) and Bangko Sentral ng Pilipinas (2008)
  • 6.
    The Seven LargestRemittance Recipient Countries India China Mexico Philippines France Spain Germany 0 15 30 45 60 Remittances % of GDP (in Nominal US$ Billions) (2008 GDP) Source: The World Bank Migration and Remittances Data (November 2009)
  • 7.
    “Stylized facts”about remittances SOME tions contrast with findings from individual country cases. Ob serva e abo ut th e lite ratur S) Some approaches have yet to be applied TANCE (ON REMIT to the Philippine case. Many studies have approached the topic from a development perspective. Of the approximately 102,000 articles on remittances available on Google Scholar, not a single one was written by me!
  • 8.
    Apply new approachesto Philippine Data. Inquire into the cyclicality and other properties of remittances to the Philippines. Approach the topic from a - macroeconomic perspective. Develop the research like an Wh open-source project. y No t.. .?
  • 9.
    The Treatment applied to the data
  • 10.
    Data for OverseasFilipino Workers’ (OFW) remittances and other macroeconomic variables were obtained for 1989Q1 to 2008Q4. Each time series (v) was assumed to have the following components: vt = trend t + cyclical t + seasonal t + et Three techniques were tried to remove the seasonal component of the data. Two business cycle filters were considered to remove the time trend and isolate the cyclical component of the data.
  • 11.
    ln(y) (Raw Data) ln(r) (Raw Data) 5.0 7.4 4.5 7.2 4.0 7.0 y r 3.5 6.8 3.0 6.6 1990 1995 2000 2005 1990 1995 2000 2005 Quarterly Frequency, 1989Q1-2004Q4 1989Q1-2008Q4 Quarterly Frequency, 1989Q1-2004Q4 1989Q1-2008Q4
  • 12.
    HP Filtered yby Seasonal Adjustment Technique CF Filtered y by Seasonal Adjustment Technique 0.04 0.02 0.02 Growth Rate (Percent) Growth Rate (Percent) 0.00 0.00 -0.02 -0.02 -0.04 -0.04 by LOESS by LOESS by Moving Averages by Moving Averages by Dummy Variables by Dummy Variables 1990 1995 2000 2005 1990 1995 2000 2005 Quarterly Frequency: 1989Q1 to 2008Q4 Quarterly Frequency: 1989Q1 to 2008Q4 Percentages are Normalized to 1 Percentages are Normalized to 1
  • 13.
    HP-Filtered r bySeasonal Adjustment Technique CF Filtered r by Seasonal Adjustment Technique 0.4 0.6 0.3 0.4 0.2 Growth Rate (Percent) Growth Rate (Percent) 0.2 0.1 0.0 0.0 -0.1 -0.2 -0.2 by LOESS by LOESS -0.4 by Moving Averages by Moving Averages by Dummy Variables by Dummy Variables -0.3 1990 1995 2000 2005 1990 1995 2000 2005 Quarterly Frequency: 1989Q1 to 2008Q4 Quarterly Frequency: 1989Q1 to 2008Q4 Percentages are Normalized to 1 Percentages are Normalized to 1
  • 14.
    Preliminary Results thus far from work on the topic
  • 15.
    First, the researchexplores the cyclicality of workers’ remittances to the Philippines. In keeping with the literature, the idea was to develop regression models using variables relevant to remittance sending: r = f( GDP , Past remittance , Exchange Rate )
  • 22.
    Conjecture: Perhaps thedifferent remittance-sending behavior described by the models is due to the type of OFW deployed in each particular country.
  • 24.
    Vector autoregressions wereemployed with the end in view of understanding remittances’ macroeconomic impact. A lag length of one was used to prevent overfitting using VARs. Impulse-response functions were also employed to model the effect of shocks to the variables.
  • 25.
    IRFS USING HP-FILTEREDDATA Orthogonal Impulse Response from hp.ya Orthogonal Impulse Response from hp.ra 0.15 0.02 0.10 hp.ya hp.ya 0.00 0.05 -0.02 0.15 0.00 xy$x xy$x 0.02 0.10 hp.ra hp.ra 0.00 0.05 -0.02 0.00 0 1 2 3 4 5 6 7 8 9 10 0 1 2 3 4 5 6 7 8 9 10
  • 26.
    IRFS USING CF-FILTEREDDATA Orthogonal Impulse Response from cf.ya Orthogonal Impulse Response from cf.ra 0.06 0.02 0.04 0.01 cf.ya cf.ya 0.02 0.00 0.00 0.06 -0.02 0.02 xy$x xy$x 0.04 0.01 cf.ra cf.ra 0.02 0.00 0.00 -0.02 0 1 2 3 4 5 6 7 8 9 10 0 1 2 3 4 5 6 7 8 9 10
  • 28.
    Issuesand Directions to explore
  • 29.
    Why are theredifferent results between different filtering techniques? Can the exchange rate effects be accounted for in the analysis? How to handle structural breaks in the data? How do remittances measure up against other inflows like FDI? What other macroeconomic variables would be relevant to the analysis?
  • 30.
    END OF PRESENTATION T H A N K Y O U Brian L. Belen bbelen@gmail.com brianbelen.blogspot.com @brianbelen