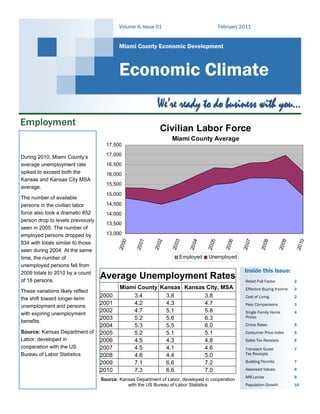
1. Volume 4, Issue 01 February 2011
Miami County Economic Development
Economic Climate
Employment
Civilian Labor Force
Miami County Average
17,500
During 2010, Miami County’s 17,000
average unemployment rate 16,500
spiked to exceed both the 16,000
Kansas and Kansas City MSA
15,500
average.
15,000
The number of available
persons in the civilian labor 14,500
force also took a dramatic 852 14,000
person drop to levels previously
13,500
seen in 2005. The number of
employed persons dropped by 13,000
0
1
2
3
4
5
6
7
8
9
0
834 with totals similar to those
20 0
20 0
20 0
20 0
20 0
20 0
20 0
20 0
20 0
20 0
20 1
seen during 2004. At the same
time, the number of Employed Unemployed
unemployed persons fell from
2009 totals to 2010 by a count Inside this Issue:
of 18 persons.
Average Unemployment Rates Retail Pull Factor 2
Miami County Kansas Kansas City, MSA Effective Buying Income 2
These variations likely reflect
the shift toward longer-term
2000 3.4 3.8 3.8 Cost of Living 2
2001 4.2 4.3 4.7 Peer Comparisons 3
unemployment and persons
2002 4.7 5.1 5.8 Single Family Home 4
with expiring unemployment
2003 5.2 5.6 6.3 Prices
benefits.
2004 5.3 5.5 6.0 Crime Rates 5
Source: Kansas Department of 2005 5.2 5.1 5.1 Consumer Price Index 5
Labor, developed in 2006 4.5 4.3 4.8 Sales Tax Receipts 6
cooperation with the US 2007 4.5 4.1 4.6 Transient Guest 7
Bureau of Labor Statistics 2008 4.8 4.4 5.0 Tax Receipts
2009 7.1 6.6 7.2 Building Permits 7
2010 7.3 6.6 7.0 Assessed Values 8
Mill Levies 9
Source: Kansas Department of Labor, developed in cooperation
with the US Bureau of Labor Statistics Population Growth 10
2. Economic Climate
Cost of Living
Data from almost 100 Miami County by The Council For Community and Data for smaller markets is gathered in
businesses was compiled to create Economic Research (C2ER) to create January, May and September and
the ACCRA Cost of Living Index. At consistency among participants. Prices released by C2ER. A composite score
least three businesses provided prices for utilities, health care, fuel, grocery is provided along with the weighted
for more than 60 items. The items and housing were among those categories.
participating businesses represented surveyed. Comparisons of their national data can
each community in the county Of the 315 regions studied, the Kansas be obtained at www.coli.org.
providing comparative services. City metro area ranked slightly higher
Standards for the items were provided than mid-pack.
Third Quarter 2010
Composite Grocery Housing Utilities Transport. Health Misc.
(100%) (12.49%) (29.84%) (9.94%) (10.73%) (4.07%) (32.93%)
St. Louis MO-IL Metro 90.9 103.0 74.8 95.3 99.1 100.3 94.9
Topeka KS Metro 93.6 94.9 85.8 85.5 98.6 96.3 100.4
Miami County KS 91.3 107.3 72.0 94.1 93.3 95.6 100.0
Lawrence KS Metro 95.5 86.6 97.9 91.8 96.8 98.9 97.1
Kansas City MO-KS
98.8 97.6 90.0 102.8 101.0 98.7 105.3
Metro
Denver CO 103.9 104.1 111.3 98.5 95.6 108.1 101.4
Effective Pull Factors
Buying Income Retail Pull Factors Measuring Regional Sales and Market Captured
Effective Buying Income is also County 2005 2006 2007 2008 2009 2010
commonly known as disposable Butler 0.67 0.69 0.69 0.71 0.73 0.71
personal income. It represents Douglas 0.99 0.97 0.87 0.85 0.85 0.86
personal income, such as wages,
Finney 1.01 1.01 1.05 1.13 1.15 1.09
salaries, interest, dividends,
profits, rental income, and Franklin 0.75 0.75 0.7 0.71 0.70 0.70
pension income, minus federal, Harvey 0.79 0.77 0.78 0.79 0.79 0.78
state, and local taxes and non-tax Johnson 1.43 1.38 1.35 1.34 1.30 1.28
payments, such as personal Leavenworth 0.61 0.6 0.57 0.54 0.55 0.57
contributions for social security
insurance. Lyon 0.86 0.85 0.85 0.83 0.82 0.88
McPherson 0.92 0.92 0.94 0.92 0.99 1.05
Source: Nielsen Claritas, 2009 Miami County 0.79 0.79 0.67 0.65 0.63 0.66
Riley 0.75 0.79 0.86 0.77 0.78 0.83
Average
Saline 1.31 1.31 1.32 1.28 1.33 1.34
EBI
Sumner 0.46 0.47 0.47 0.5 0.53 0.54
Miami County $ 57,359
The Pull Factor is one measure of a county’s retail trade. A factor of 1 depicts a
Kansas City MSA $ 56,334 perfect balance of trade where the purchases of county residents who shop
Kansas $ 50,865 elsewhere are offset by the purchases of out-of-county customers. Values greater
than 1 indicate that trade is pulled in from beyond their home county. Values less
US $ 55,886 than 1 indicate that more trade is lost than pulled into the county.
Page 2 Source: Kansas Department of Revenue, state fiscal year
3. Volume 4, Issue 01
Peer Comparisons
Peer Comparisons
2010 Median
2010 Median Home Household Income
Home Value Ranking Income Ranking
Spring Hill $149,030 3 $70,274 1
Each city selected peer
Basehor $158,779 1 $69,951 2
communities based on size
De Soto $157,068 2 $63,500 3
and proximity to highways
Louisburg $125,758 4 $63,487 4
and major metro markets.
Tonganoxie $112,576 5 $61,364 5
This list of peers includes
Paola $106,045 6 $52,170 6
only those that are common
Edwardsville $41,843 14 $34,805 7
to Spring Hill, Louisburg,
Osawatomie $53,425 12 $42,351 8
Paola and Osawatomie.
Iola $63,626 11 $40,383 9
Source: ESRI, based on 3- Bonner Springs $41,843 13 $34,805 10
mile radius Concordia $70,954 10 $40,842 11
Baxter Springs $76,687 9 $33,276 12
Ottawa $87,394 8 $48,993 13
Abilene $98,946 7 $45,984 14
Average Tax Burden
2010 Tax Payment on
2009 Average Rate $1,000,000
(Per $1,000 of Assessed Value) Commercial Property $250,000 Home
Johnson County, KS $114.533 $28,633 $3,247
Wamego $117.502 $29,376 $3,332
Fontana $119.514 $29,879 $3,390
Miami County, KS $121.547 $30,387 $3,448
Hesston $123.567 $30,892 $3,507
Olathe $125.343 $31,336 $3,558
Abilene $126.793 $31,698 $3,599
De Soto $136.520 $34,130 $3,879
Baldwin City $136.899 $34,225 $3,890
Louisburg $141.427 $35,357 $4,020
Paola $141.819 $35,455 $4,031
Bonner Springs $146.969 $36,742 $4,179
Spring Hill $148.433 $37,108 $4,221
Osawatomie $152.030 $38,008 $4,325
Ottawa $163.744 $40,936 $4,662
Edwardsville $165.375 $41,344 $4,709
Iola $169.520 $42,380 $4,828
Garnett $184.374 $46,094 $5,255
Source: Kansas Department of Revenue and Kansas League of Municipalities Page 3
4. Economic Climate
Single F amily H omes
Single Family Homes
Average Single Family Home Sale Price
2006 2007 2008 2009
Price Per Price Per Price Per Price Per
Sales Price Sales Price Sales Price Sales Price
Sq Ft Sq Ft Sq Ft Sq Ft
Paola $ 151,733 $ 98 $ 151,420 $ 98 $ 165,205 $ 94 $ 113,825 $ 88
Louisburg $ 176,091 $ 100 $ 175,595 $ 105 $ 169,744 $ 101 $ 169,679 $ 107
Spring Hill $ 183,763 $ 100 $ 186,541 $ 101 $ 180,410 $ 101 $ 175,597 $ 110
Osawatomie $ 86,898 $ 66 $ 92,347 $ 72 $ 102,942 $ 74 $ 78,440 $ 65
Unincorporated $ 254,883 $ 115 $ 251,928 $ 121 $ 227,208 $ 112 $ 231,948 $ 123
Miami County
$ 177,481 $ 99 $ 184,594 $ 104 $ 182,901 $ 100 $ 170,982 $ 105
Combined
Source: Miami County Appraiser's Office
Historical records regarding sale prices for property the Home Builders of Greater Kansas City. Numbers
will differ slightly between the Miami County tracked by the Appraiser’s Office includes sales that
Appraiser’s Office and other sources such as the did not involve a real estate agent.
Kansas City Regional Association of REALTORS and
Average Sale Price Resale Single Family Homes
Miami Johnson Leavenworth Wyandotte Cass Clay/Ray Jackson Platte
2005 $154,724 $225,635 $127,280 $84,886 $136,361 $143,073 $132,382 $172,418
2006 $209,322 $346,942 $236,886 $192,802 $136,441 $176,396 $123,269 $171,647
2007 $153,510 $237,848 $122,696 $75,182 $138,989 $149,928 $105,795 $187,068
2008 $171,772 $229,860 $138,178 $70,836 $136,062 $138,077 $113,016 $170,252
2009 $148,687 $222,145 $142,219 $69,039 $134,288 $132,572 $113,919 $169,267
2010 $145,738 $231,866 $148,373 $74,709 $140,735 $134,477 $111,048 $176,935
Average Sale Price New Single Family Homes
Miami Johnson Leavenworth Wyandotte Cass Clay/Ray Jackson Platte
2005 $187,053 $324,459 $ 225,295 $ 188,402 $214,479 $225,679 $254,910 $253,949
2006 $209,322 $346,942 $ 236,886 $ 192,802 $262,250 $259,151 $239,565 $312,665
2007 $159,058 $425,100 $ 259,070 $ 207,652 $300,891 $251,424 $267,502 $274,275
2008 $221,805 $388,028 $ 243,806 $ 208,067 $263,896 $248,715 $279,787 $314,719
2009 $195,125 $363,620 $ 242,413 $ 204,792 $242,176 $242,011 $286,710 $299,401
2010 $208,580 $376,319 $ 234,257 $ 189,441 $245,202 $263,942 $276,575 $312,269
Average Sale Price New and Resale Single Family Homes
Miami Johnson Leavenworth Wyandotte Cass Clay/Ray Jackson Platte
2006 $189,406 $258,746 $171,478 $107,266 $165,603 $173,137 $146,219 $207,964
2007 $176,760 $261,010 $169,705 $101,572 $182,170 $171,458 $138,913 $208,317
2008 $178,153 $254,038 $149,903 $85,999 $157,923 $157,377 $123,292 $198,489
2009 $150,834 $239,138 $160,914 $80,164 $147,398 $148,203 $122,049 $190,517
2010 $146,960 $247,736 $161,360 $82,806 $149,642 $153,605 $116,455 $195,050
Page 4
5. Volume 4, Issue 01
Crime Rates
Total Crime Index Offenses
60.0
50.0
40.0
30.0
20.0
10.0
0.0
2002 2003 2004 2005 2006 2007 2008 2009
County Average Miami County Sheriff Paola Police Louisburg Police Osawatomie Police Spring Hill
Note: Includes violent crime and property crime per 1,000 Source: Kansas Bureau of Investigation
Consumer Price Index
The Consumer Price Index (CPI) measures the average change over employed, the poor, the unemployed and
time in the prices paid by urban consumers for a market basket of retired persons as well as urban wage
consumer goods and services. earners.
It reflects spending patterns for all urban consumers and urban wage Excluded from the CPI are the spending
earners. It is based on the expenditures of almost all residents of urban patterns of persons living in rural non-
or metropolitan statistical areas, including professionals, the self- metropolitan areas, farm families, persons
in the Armed Forces, and those in
institutions, such as prisons and mental
hospitals.
Consumer Price Index The energy index increased in December.
250 The gasoline index rose sharply
accounting for about 80 percent of all items
seasonally adjusted increase. The
200 household energy index, which had
declined in November, also increased. The
food index increased slightly in December
150 led by the fruits and vegetables index.
100 The index for all items less food and
energy also rose in December. An increase
in the shelter index accounted for about 60
50 percent of the rise. These increases more
than offset declines for communication,
recreation, and household furnishings.
0
8
9
0
1
2
3
4
5
6
7
8
9
0
19 9
19 9
20 0
20 0
20 0
20 0
20 0
20 0
20 0
20 0
20 0
20 0
20 1
Source: US Bureau of Labor Statistics
Kansas City, MSA Not Seasonally Adjusted Page 5
6. Economic Climate
Sales Tax
Sales Tax Receipts
Thousands
$2,500
$2,000
$1,500
$1,000
$500
$-
2004 2005 2006 2007 2008 2009 2010
Fontana Louisburg Osawatomie Paola Spring Hill Miami County Special R & B
Note: Spring Hill includes all but disbursements under the new rate Louisburg increased its sales tax rate
Johnson County special collections. All were made in January of 2008. from 1% to 1.25% in July of 2010. The
others include all local and county first disbursements under the new rate
Spring Hill increased its sales tax rate
shared taxes. Osawatomie increased will be made in September of 2010.
from 1% to 1.5% in April of 2009. The
its local tax rate from 0.5% to 1% in
first disbursements under the new rate Source: Kansas Department of
2007. Paola increased that same year
were made in June of 2009. Revenue
from 1% to 1.25%. The first
Sales Tax Receipts Per Capita
2010
2009
2008
2007
2006
$- $50 $100 $150 $200 $250 $300 $350 $400 $450
Fontana Louisburg Osawatomie Paola Spring Hill Miami County
Page 6
7. Volume 4, Issue 01
Transient Guest Taxes
Osawatomie Transient Guest Tax
Kansas allows cities to impose a
transient guest tax, in addition to $20,000
the sales tax, on the rental of
$15,000
rooms, lodging, or other sleeping
accommodations. The guest tax $10,000
applies when there are more
than two bedrooms furnished for $5,000
the accommodations of guests
and when the room is rented for $-
2005 2006 2007 2008 2009 2010 2011
28 consecutive days or less.
The City of Osawatomie January April July October
assesses a 6% tax while the City
of Paola collects 5%. None is Paola Transient Guest Tax
collected within the
unincorporated areas. $35,000
$30,000
The local use of the dollars
$25,000
collected is governed by each
$20,000
city. In both Paola and
$15,000
Osawatomie, a local board of
$10,000
volunteers have been appointed
$5,000
to oversee the expenditures.
$-
Source: Kansas Department of 2005 2006 2007 2008 2009 2010 2011
Revenue
January April July October
Building Permits
New Single Family Home Permits
45
40
35
30
25
Source: Cities and 20
county through
15
September
10
5
*Spring Hill reflects 0
Miami County only
2008 2009 2010
Louisburg Paola Spring Hill Osawatomie Miami County
Page 7
8. Economic Climate
Assessed Valuation Assessed valuations
include the combined
Total Assessed Valuation value of personal
property, real property
Millions
and the value of things
$400 such as utility
infrastructure and mineral
$350 rights. Personal property
includes vehicles while
real property includes
$300 land. While reliance on
Total Combined Value
real property versus
$250 personal property varies
by community, overall
almost 30% of the
$200 county’s assessed
valuation was generated
$150 by commercial uses.
The State of Kansas
$100 determines how values
are assessed. For
example, commercial
$50 structures pay property
taxes on 25% of their
appraised value while a
$-
home pays property taxes
2001 2002 2003 2004 2005 2006 2007 2008 2009 2010 on 11.5% of the home’s
appraised value.
Commerical Noncommerical Source: Miami County
Clerk
Community Assessed Valuations
60
Millions
50
40 Fontana
Louisburg
30 Osawatomie
Paola
20 Spring Hill*
Source: Miami
10 County Clerk
0 *Miami County
Portion Only
2001 2002 2003 2004 2005 2006 2007 2008 2009 2010
Page 8
9. Volume 4, Issue 01
Mill Levies
Mill Levy Comparisons
Source: Miami County Clerk
160
150
140
Total Levy
130
120
110
100
2001 2002 2003 2004 2005 2006 2007 2008 2009 2010
Fontana Louisburg Paola Osawatomie Spring Hill
Miami County Mill Levy by Fund
45
40
35
Mill Levy
30
Special Bridge
25 Road and Bridge
20 County Wide Reappraisal
15 Bond and Interest
General
10
5
0
Source: Miami County Clerk
20 01
20 02
20 03
20 04
20 05
20 06
20 07
20 08
20 09
20 10
Page 9
10. Miami County Economic Development
Population Growth
From 2008 to 2009: Population % Growth
Miami County lost 20
residents, -0.1%, to
30,969. It is the second 2009
consecutive year
recording a loss.
2008
Fontana increased by a
person, 0.5%, to 218
residents. 2007
Louisburg decreased
34 people, -0.9%, to 2006
3,906 residents. It is the
first year Louisburg has
2005
recorded a population
decrease in more than a
decade. 2004
Reversing previous
trends, Osawatomie 2003
gained 53 residents,
1.2%, to 4,541 residents.
2002
For the second year,
Paola lost in population
5 people, -0.1%, to 5,346 2001
residents.
Spring Hill* increased 2000
54 people, 1.0%, to
5,281 residents. 1990
*The Spring Hill reflects
both Johnson and Miami -30% -20% -10% 0% 10% 20% 30%
counties.
Source: Kansas Budget
Office Miami County Fontana Louisburg Osawatomie Paola Spring Hill
Miami County Economic Development
201 S. Pearl, Suite 202, Paola, KS 66071
Phone: 913-294-4045 Fax: 913-294-9163
E-mail: jmcrae@miamicountyks.org www.thinkmiamicounty.com
miami county
KANSAS