Download to read offline

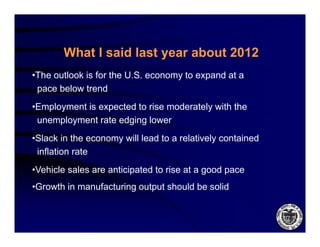
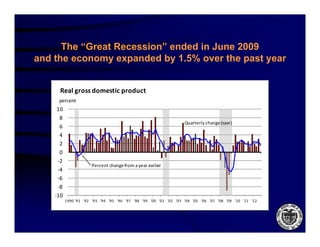
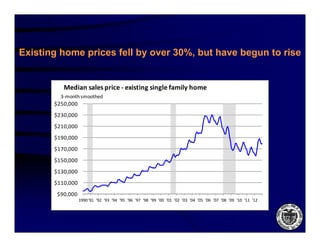
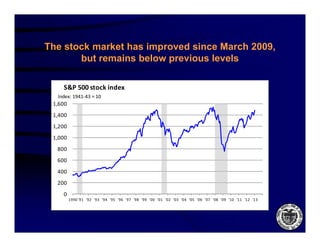
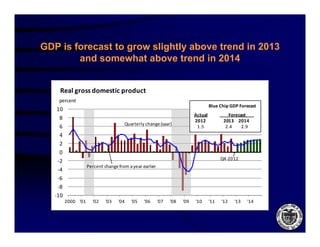
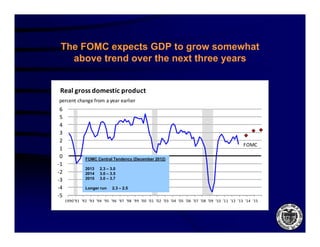
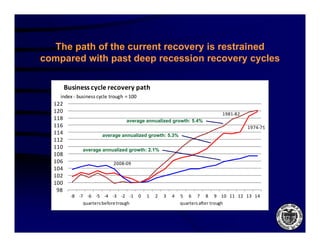
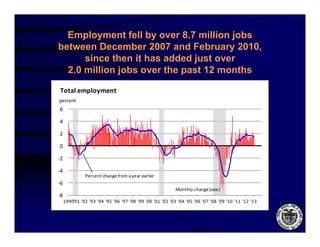
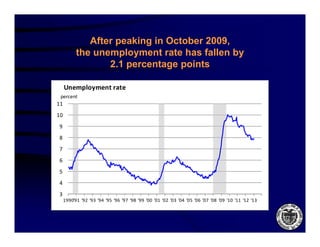
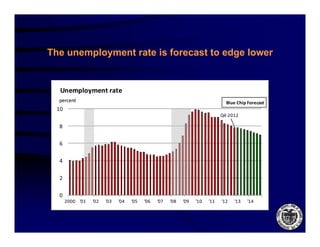
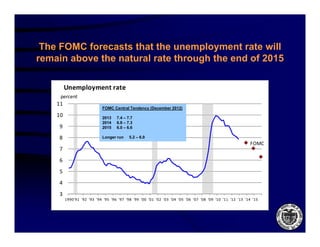
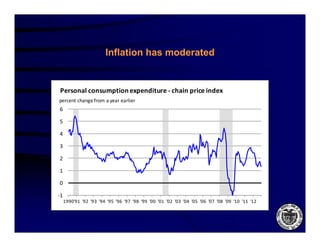
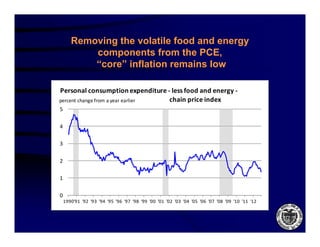
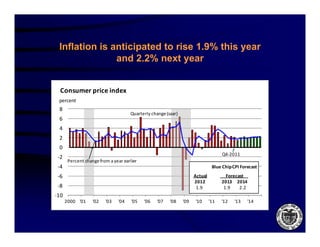
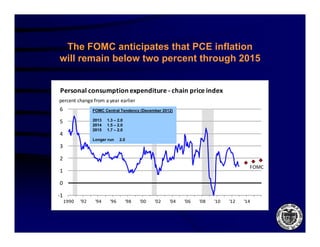
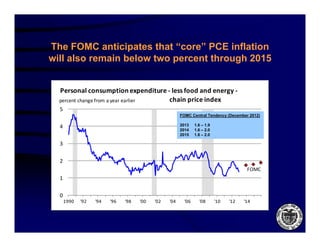
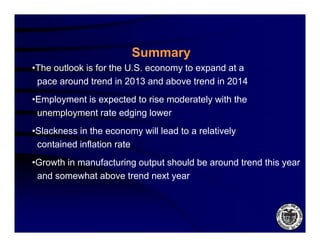


The economic outlook document provides the following key points: 1) The US economy is expected to expand in 2013 at a pace below trend, with moderate employment growth and a gradually lower unemployment rate. Inflation is expected to remain contained. 2) Several economic indicators, such as GDP, home prices, and stock markets, have improved since the recession but remain below pre-recession levels. 3) Forecasts anticipate GDP and employment growth will continue in 2013 and 2014, with inflation rising moderately but remaining below the Fed's 2% target through 2015.


