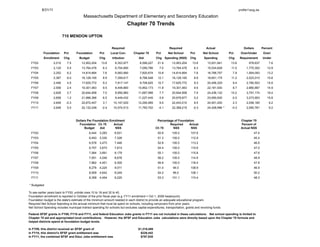
8/31/11                                                                                                                                              profile11aug.xls

                                         Massachusetts Department of Elementary and Secondary Education
                                                                           Chapter 70 Trends

                            710 MENDON UPTON

                                                               Required                                    Required                    Actual                      Dollars        Percent
           Foundation       Pct     Foundation        Pct     Local Con-        Chapter 70       Pct      Net School       Pct       Net School        Pct      Over/Under         Over/
           Enrollment       Chg       Budget          Chg      tribution            Aid          Chg Spending (NSS)        Chg       Spending          Chg     Requirement        Under
  FY02              2,010     7.5       12,953,204     13.8       6,353,977         6,599,227     21.9       12,953,204      13.8       13,931,841      13.6           978,637        7.6
  FY03              2,120     5.5       13,764,476      6.3       6,704,690         7,059,786      7.0       13,764,476       6.3       15,534,828      11.5         1,770,352       12.9
  FY04              2,252     6.2       14,814,664      7.6       6,993,990         7,820,674     10.8       14,814,664       7.6       16,768,757       7.9         1,954,093       13.2
  FY05              2,387     6.0       16,128,165      8.9       7,359,617         8,768,548     12.1       16,128,165       8.9       18,651,175      11.2         2,523,010       15.6
  FY06              2,495     4.5       17,625,772      9.3       7,917,147         9,708,625     10.7       17,625,772       9.3       20,406,325       9.4         2,780,553       15.8
  FY07              2,556     2.4       19,301,063      9.5       8,448,890        10,852,173     11.8       19,301,063       9.5       22,181,930       8.7         2,880,867       14.9
  FY08              2,626     2.7       20,644,958      7.0       8,956,960        11,687,998      7.7       20,644,958       7.0       24,436,132      10.2         3,791,174       18.4
  FY09              2,658     1.2       21,996,366      6.5       9,449,432        11,227,445      -3.9      20,676,877       0.2       23,950,830      -2.0         3,273,953       15.8
  FY10              2,649    -0.3       22,672,457      3.1     10,147,020         12,295,995      9.5       22,443,015       8.5       24,501,200       2.3         2,058,185        9.2
  FY11              2,648     0.0       22,132,248     -2.4     10,574,513         11,793,702      -4.1      22,368,215      -0.3       24,428,996 *    -0.3         2,060,781        9.2


                                    Dollars Per Foundation Enrollment                            Percentage of Foundation                                       Chapter 70
                                      Foundation Ch 70        Actual                                     Required     Actual                                    Percent of
                                          Budget    Aid        NSS                              Ch 70      NSS         NSS                                      Actual NSS
  FY02                                        6,444   3,283      6,931                            50.9       100.0         107.6                                          47.4
  FY03                                        6,493   3,330      7,328                            51.3       100.0         112.9                                          45.4
  FY04                                        6,578   3,473      7,446                            52.8       100.0         113.2                                          46.6
  FY05                                        6,757   3,673      7,814                            54.4       100.0         115.6                                          47.0
  FY06                                        7,064   3,891      8,179                            55.1       100.0         115.8                                          47.6
  FY07                                        7,551   4,246      8,678                            56.2       100.0         114.9                                          48.9
  FY08                                        7,862   4,451      9,305                            56.6       100.0         118.4                                          47.8
  FY09                                        8,276   4,224      9,011                            51.0        94.0         108.9                                          46.9
  FY10                                        8,559   4,642      9,249                            54.2        99.0         108.1                                          50.2
  FY11                                        8,358   4,454      9,225                            53.3       101.1         110.4                                          48.3

* Budgeted

To see earlier years back to FY93, unhide rows 10 to 18 and 32 to 40.
Foundation enrollment is reported in October of the prior fiscal year (e.g. FY11 enrollment = Oct 1, 2009 headcount).
Foundation budget is the state's estimate of the minimum amount needed in each district to provide an adequate educational program.
Required Net School Spending is the annual minimum that must be spent on schools, including carryovers from prior years.
Net School Spending includes municipal indirect spending for schools but excludes capital expenditures, transportation, grants and revolving funds.

Federal SFSF grants in FY09, FY10 and FY11, and federal Education Jobs grants in FY11 are not included in these calculations. Net school spending is limited to
Chapter 70 aid and appropriated local contributions. However, the SFSF and Education Jobs calculations were directly based upon the Chapter 70 formula and
helped districts spend at foundation budget levels.

In FY09, this district received an SFSF grant of                                   $1,319,489
In FY10, this district's SFSF grant entitlement was                                 $229,442
In FY11, the combined SFSF and Educ Jobs entitlement was                            $797,935

MURSD Chapter 70 Trend, FY02-11

  • 1.
    8/31/11 profile11aug.xls Massachusetts Department of Elementary and Secondary Education Chapter 70 Trends 710 MENDON UPTON Required Required Actual Dollars Percent Foundation Pct Foundation Pct Local Con- Chapter 70 Pct Net School Pct Net School Pct Over/Under Over/ Enrollment Chg Budget Chg tribution Aid Chg Spending (NSS) Chg Spending Chg Requirement Under FY02 2,010 7.5 12,953,204 13.8 6,353,977 6,599,227 21.9 12,953,204 13.8 13,931,841 13.6 978,637 7.6 FY03 2,120 5.5 13,764,476 6.3 6,704,690 7,059,786 7.0 13,764,476 6.3 15,534,828 11.5 1,770,352 12.9 FY04 2,252 6.2 14,814,664 7.6 6,993,990 7,820,674 10.8 14,814,664 7.6 16,768,757 7.9 1,954,093 13.2 FY05 2,387 6.0 16,128,165 8.9 7,359,617 8,768,548 12.1 16,128,165 8.9 18,651,175 11.2 2,523,010 15.6 FY06 2,495 4.5 17,625,772 9.3 7,917,147 9,708,625 10.7 17,625,772 9.3 20,406,325 9.4 2,780,553 15.8 FY07 2,556 2.4 19,301,063 9.5 8,448,890 10,852,173 11.8 19,301,063 9.5 22,181,930 8.7 2,880,867 14.9 FY08 2,626 2.7 20,644,958 7.0 8,956,960 11,687,998 7.7 20,644,958 7.0 24,436,132 10.2 3,791,174 18.4 FY09 2,658 1.2 21,996,366 6.5 9,449,432 11,227,445 -3.9 20,676,877 0.2 23,950,830 -2.0 3,273,953 15.8 FY10 2,649 -0.3 22,672,457 3.1 10,147,020 12,295,995 9.5 22,443,015 8.5 24,501,200 2.3 2,058,185 9.2 FY11 2,648 0.0 22,132,248 -2.4 10,574,513 11,793,702 -4.1 22,368,215 -0.3 24,428,996 * -0.3 2,060,781 9.2 Dollars Per Foundation Enrollment Percentage of Foundation Chapter 70 Foundation Ch 70 Actual Required Actual Percent of Budget Aid NSS Ch 70 NSS NSS Actual NSS FY02 6,444 3,283 6,931 50.9 100.0 107.6 47.4 FY03 6,493 3,330 7,328 51.3 100.0 112.9 45.4 FY04 6,578 3,473 7,446 52.8 100.0 113.2 46.6 FY05 6,757 3,673 7,814 54.4 100.0 115.6 47.0 FY06 7,064 3,891 8,179 55.1 100.0 115.8 47.6 FY07 7,551 4,246 8,678 56.2 100.0 114.9 48.9 FY08 7,862 4,451 9,305 56.6 100.0 118.4 47.8 FY09 8,276 4,224 9,011 51.0 94.0 108.9 46.9 FY10 8,559 4,642 9,249 54.2 99.0 108.1 50.2 FY11 8,358 4,454 9,225 53.3 101.1 110.4 48.3 * Budgeted To see earlier years back to FY93, unhide rows 10 to 18 and 32 to 40. Foundation enrollment is reported in October of the prior fiscal year (e.g. FY11 enrollment = Oct 1, 2009 headcount). Foundation budget is the state's estimate of the minimum amount needed in each district to provide an adequate educational program. Required Net School Spending is the annual minimum that must be spent on schools, including carryovers from prior years. Net School Spending includes municipal indirect spending for schools but excludes capital expenditures, transportation, grants and revolving funds. Federal SFSF grants in FY09, FY10 and FY11, and federal Education Jobs grants in FY11 are not included in these calculations. Net school spending is limited to Chapter 70 aid and appropriated local contributions. However, the SFSF and Education Jobs calculations were directly based upon the Chapter 70 formula and helped districts spend at foundation budget levels. In FY09, this district received an SFSF grant of $1,319,489 In FY10, this district's SFSF grant entitlement was $229,442 In FY11, the combined SFSF and Educ Jobs entitlement was $797,935