Download to read offline
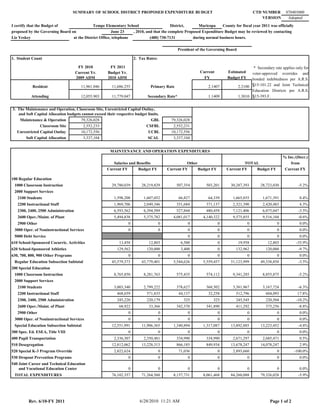
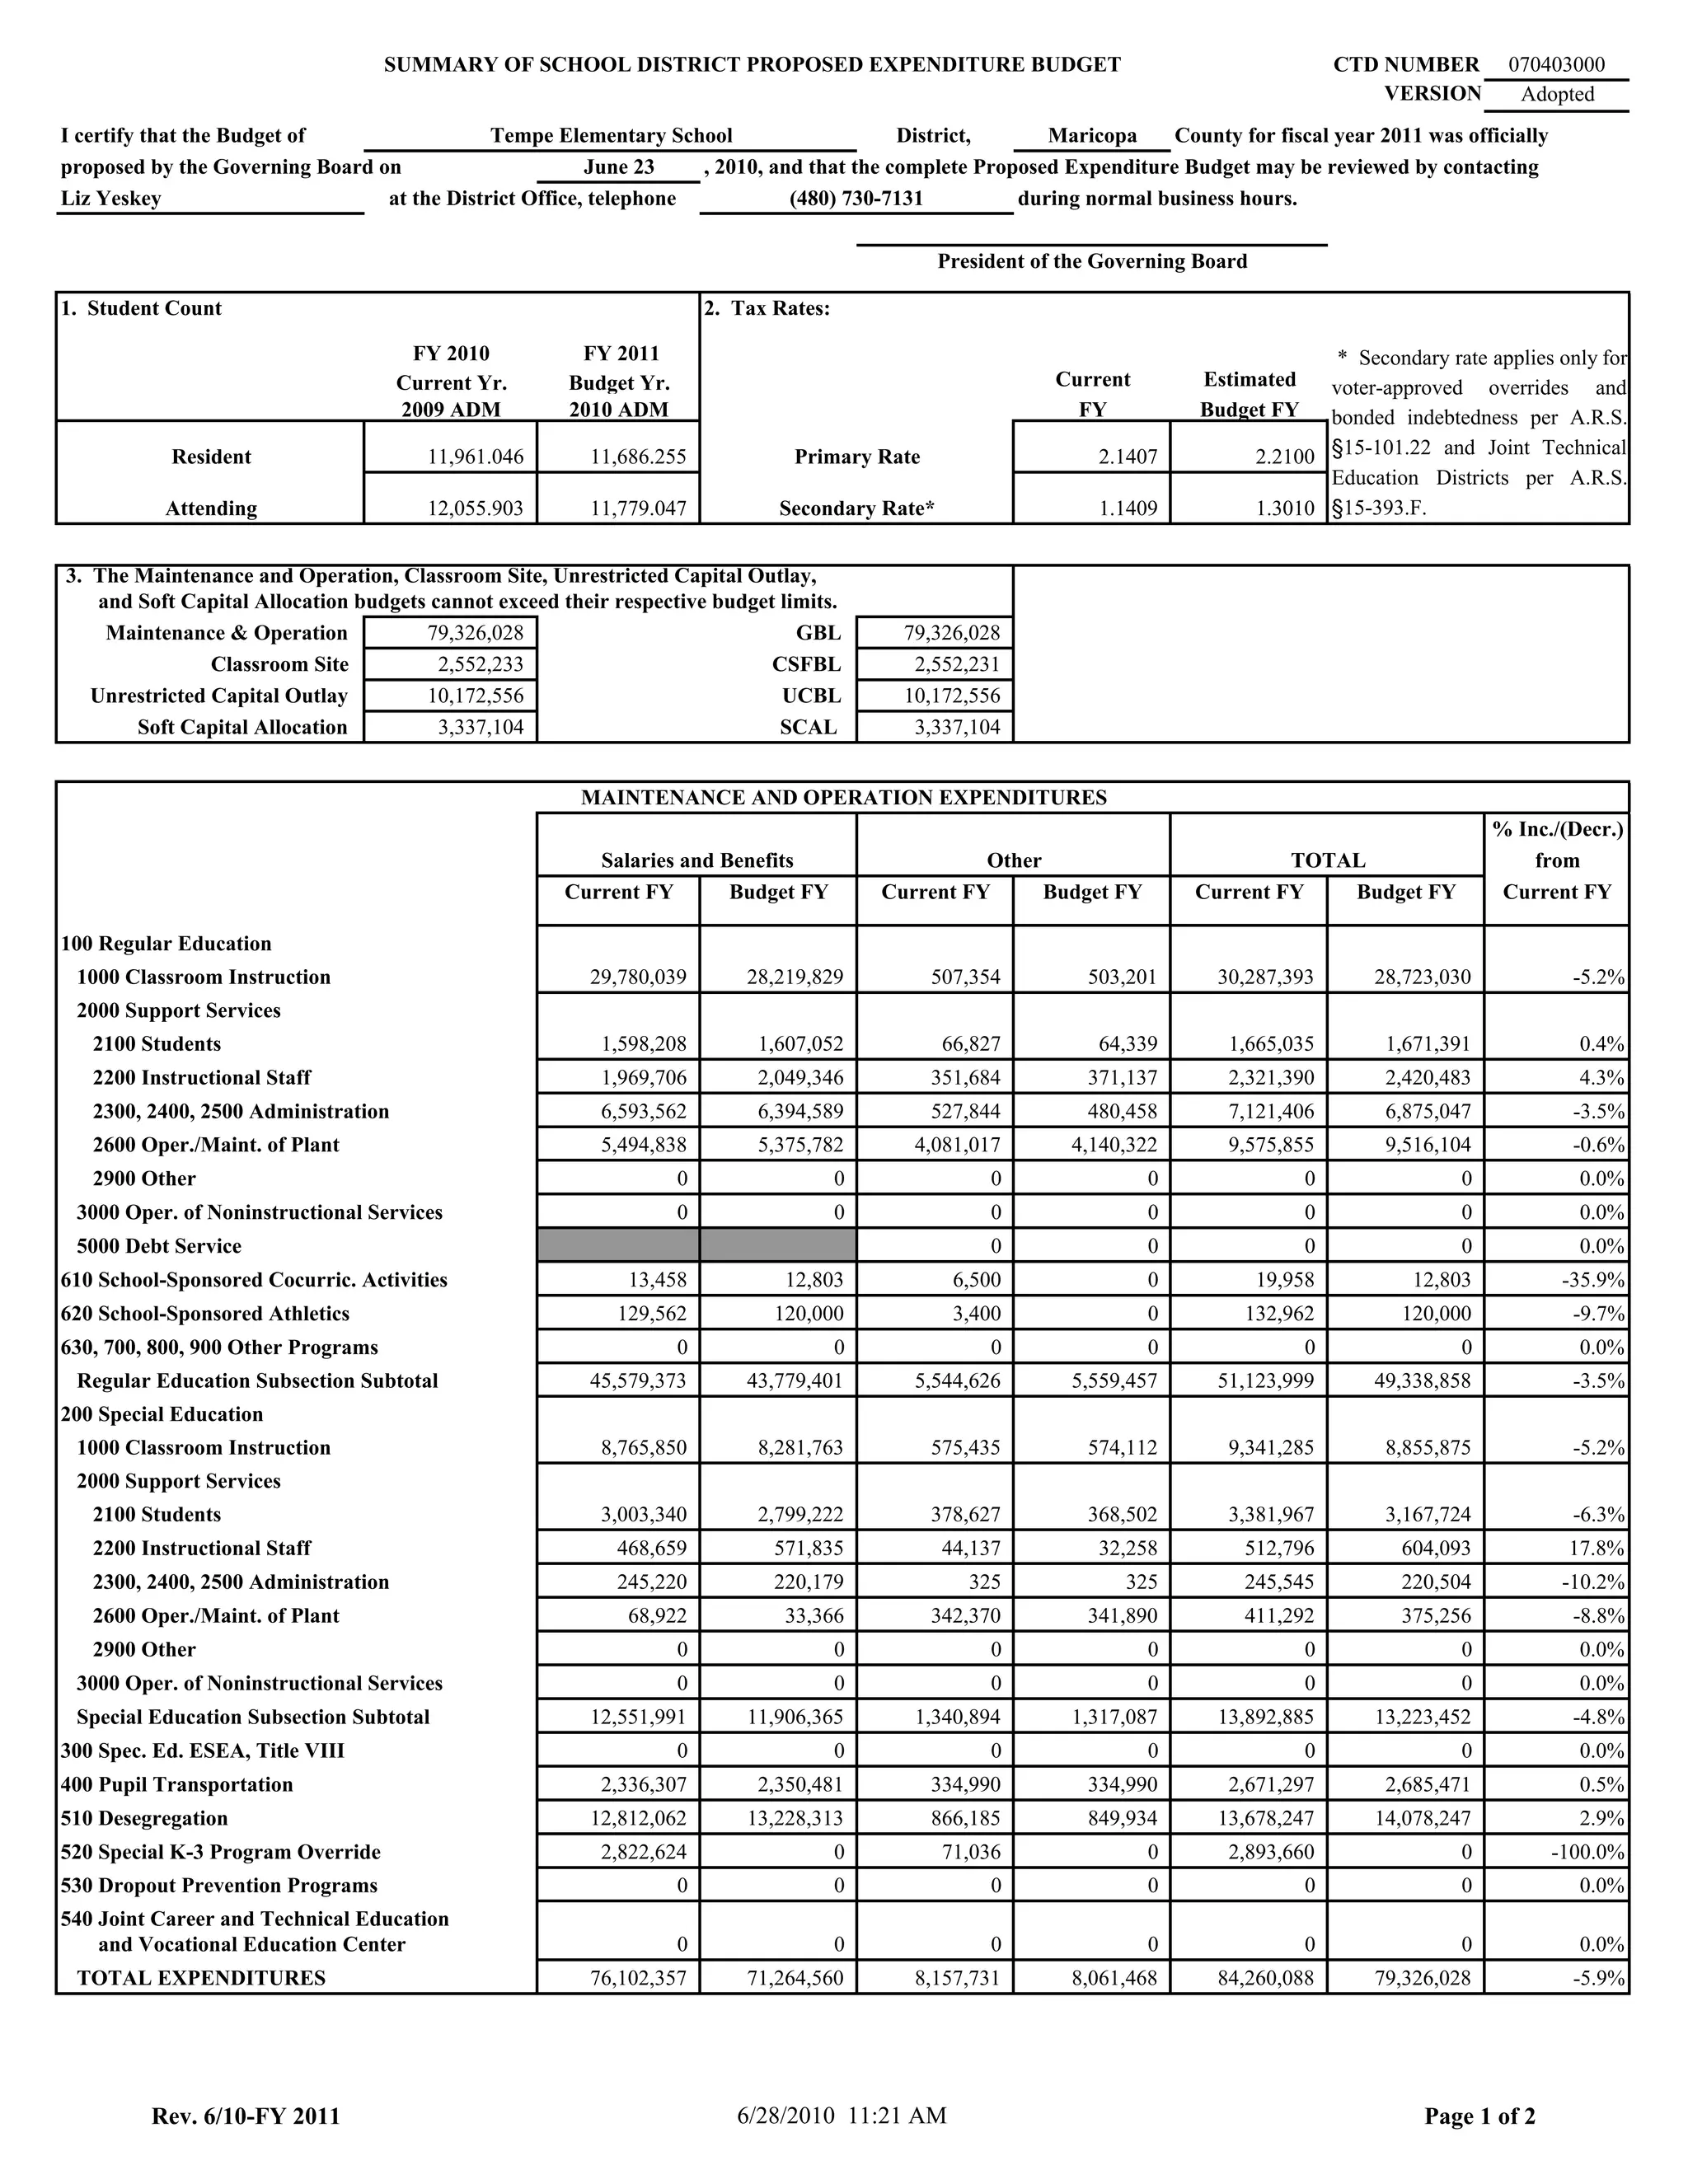

The document summarizes the proposed expenditure budget for the Tempe Elementary School District for the 2011 fiscal year. It was proposed by the Governing Board on June 23, 2010. The budget totals $79,326,028 for maintenance and operation expenditures, a 5.9% decrease from the current year. It allocates funding across various student programs, capital projects, and debt services. The staffing summary includes 1,945 total employees with a ratio of 1 staff to 6.1 students.


