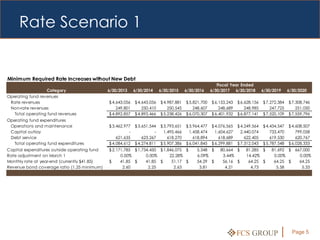
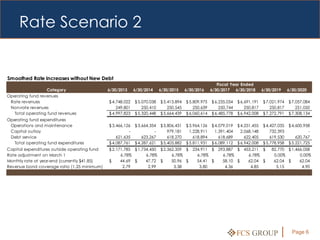
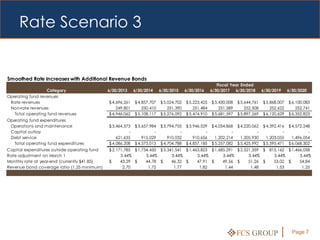
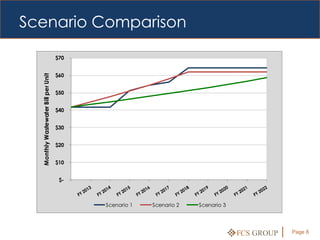
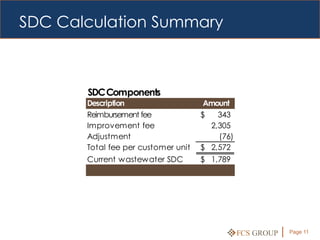
City of The Dalles,
                       Wastewater Plan:
Oregon
                       Financial Element

                       City Council Meeting

                       John Ghilarducci
November 26, 2012

                           FCS GROUP
                      4380 SW Macadam Avenue, Suite 220, Portland, OR 97239  503-841-6543
Presentation Outline

1. Rate Findings
   Background
   Key Assumptions
   Rate Scenarios
2. SDC Findings
   Background
   SDC Calculation Summary
   Comparable SDCs


                              FCS GROUP   Page 2
What Should Rates Do?

 Generate sufficient revenues to sustain
  the utility system
 Charge for services provided
 Recover costs equitably
 Achieve City objectives
     Revenue stability
     Maintain minimum fund balances
      and meet other fiscal policies


                                       FCS GROUP   Page 3
Key Assumptions

 Annual cost escalation
     5.1% for personal services (historical rate)
     3.2% for materials and services (CPI)
     3.1% for capital outlay (ENR CCI)
 Operating fund maintains 45-90 days of
  expenditures
 Minimum revenue bond coverage ratio
  of 1.25
 New debt modeled at 4.0% for 20 years

                                             FCS GROUP   Page 4
Rate Scenario 1


Minimum Required Rate Increases without New Debt
                                                                                                         Fiscal Year Ended
                  Category                    6/30/2013     6/30/2014     6/30/2015     6/30/2016     6/30/2017 6/30/2018         6/30/2019     6/30/2020
Operating fund revenues
 Rate revenues                                $ 4,643,056   $ 4,643,056   $ 4,987,881   $ 5,821,700   $ 6,153,243   $ 6,628,156   $ 7,272,384   $ 7,308,746
 Non-rate revenues                                249,801       250,410       250,545       248,607       248,689       248,985       247,725       251,050
   Total operating fund revenues              $ 4,892,857   $ 4,893,466   $ 5,238,426   $ 6,070,307   $ 6,401,932   $ 6,877,141   $ 7,520,109   $ 7,559,796
Operating fund expenditures
 Operations and maintenance                   $ 3,462,977   $ 3,651,544   $ 3,793,651   $ 3,964,477   $ 4,076,565   $ 4,249,564   $ 4,434,547   $ 4,608,507
 Capital outlay                                         -             -     1,495,466     1,458,474     1,604,627     2,440,074       733,470       799,058
 Debt service                                     621,635       623,267       618,270       618,894       618,689       622,405       619,530       620,767
   Total operating fund expenditures          $ 4,084,612   $ 4,274,811   $ 5,907,386   $ 6,041,845   $ 6,299,881   $ 7,312,043   $ 5,787,548   $ 6,028,333
Capital expenditures outside operating fund   $ 2,171,785 $ 1,734,450 $ 1,846,075 $          5,348 $      80,664 $      81,285 $      81,692 $ 667,000
Rate adjustment on March 1                          0.00%       0.00%      22.28%            6.09%         3.44%        14.42%         0.00%     0.00%
Monthly rate at year-end (currently $41.85)   $     41.85 $     41.85 $     51.17 $          54.29 $       56.16 $       64.25 $       64.25 $   64.25
Revenue bond coverage ratio (1.25 minimum)           2.60        2.25        2.63             3.81          4.21          4.73          5.58      5.33


                                                                                                                    FCS GROUP                     Page 5
Rate Scenario 2


Smoothed Rate Increases without New Debt
                                                                                                         Fiscal Year Ended
                  Category                    6/30/2013     6/30/2014     6/30/2015     6/30/2016     6/30/2017 6/30/2018         6/30/2019     6/30/2020
Operating fund revenues
 Rate revenues                                $ 4,748,022   $ 5,070,038   $ 5,413,894   $ 5,809,975   $ 6,235,034   $ 6,691,191   $ 7,021,974   $ 7,057,084
 Non-rate revenues                                249,801       250,410       250,545       250,639       250,744       250,817       250,817       251,050
   Total operating fund revenues              $ 4,997,823   $ 5,320,448   $ 5,664,439   $ 6,060,614   $ 6,485,778   $ 6,942,008   $ 7,272,791   $ 7,308,134
Operating fund expenditures
 Operations and maintenance                   $ 3,466,126   $ 3,664,354   $ 3,806,431   $ 3,964,126   $ 4,079,019   $ 4,251,455   $ 4,427,035   $ 4,600,958
 Capital outlay                                         -             -       979,181     1,228,911     1,391,404     2,068,148       732,393             -
 Debt service                                     621,635       623,267       618,270       618,894       618,689       622,405       619,530       620,767
   Total operating fund expenditures          $ 4,087,761   $ 4,287,621   $ 5,403,882   $ 5,811,931   $ 6,089,112   $ 6,942,008   $ 5,778,958   $ 5,221,725
Capital expenditures outside operating fund   $ 2,171,785 $ 1,734,450 $ 2,362,359 $ 234,911 $ 293,887 $ 453,211 $                     82,770 $ 1,466,058
Rate adjustment on March 1                          6.78%       6.78%       6.78%     6.78%     6.78%     6.78%                        0.00%       0.00%
Monthly rate at year-end (currently $41.85)   $     44.69 $     47.72 $     50.96 $   54.41 $   58.10 $   62.04 $                      62.04 $     62.04
Revenue bond coverage ratio (1.25 minimum)           2.79        2.99        3.38      3.80      4.36      4.85                         5.15        4.90


                                                                                                                    FCS GROUP                     Page 6
Rate Scenario 3


Smoothed Rate Increases with Additional Revenue Bonds
                                                                                                         Fiscal Year Ended
                  Category                    6/30/2013     6/30/2014     6/30/2015     6/30/2016     6/30/2017 6/30/2018         6/30/2019     6/30/2020
Operating fund revenues
 Rate revenues                                $ 4,696,261   $ 4,857,707   $ 5,024,702   $ 5,223,425   $ 5,430,008   $ 5,644,761   $ 5,868,007   $ 6,100,083
 Non-rate revenues                                249,801       250,410       251,390       251,484       251,589       252,508       252,622       252,741
   Total operating fund revenues              $ 4,946,062   $ 5,108,117   $ 5,276,092   $ 5,474,910   $ 5,681,597   $ 5,897,269   $ 6,120,629   $ 6,352,823
Operating fund expenditures
 Operations and maintenance                   $ 3,464,573   $ 3,657,984   $ 3,794,755   $ 3,946,529   $ 4,054,868   $ 4,220,062   $ 4,392,416   $ 4,572,248
 Capital outlay                                         -             -             -             -             -             -             -             -
 Debt service                                     621,635       915,029       910,032       910,656     1,202,214     1,205,930     1,203,055     1,496,054
   Total operating fund expenditures          $ 4,086,208   $ 4,573,013   $ 4,704,788   $ 4,857,185   $ 5,257,082   $ 5,425,992   $ 5,595,471   $ 6,068,302
Capital expenditures outside operating fund   $ 2,171,785 $ 1,734,450 $ 3,341,541 $ 1,463,823 $ 1,685,291 $ 2,521,359 $ 815,162 $ 1,466,058
Rate adjustment on March 1                          3.44%       3.44%       3.44%       3.44%       3.44%       3.44%     3.44%       3.44%
Monthly rate at year-end (currently $41.85)   $     43.29 $     44.78 $     46.32 $     47.91 $     49.56 $     51.26 $   53.02 $     54.84
Revenue bond coverage ratio (1.25 minimum)           2.70        1.72        1.77        1.82        1.44        1.48      1.53        1.25


                                                                                                                    FCS GROUP                     Page 7
Scenario Comparison

                                     $70


                                     $60
  Monthly Wastewater Bill per Unit


                                     $50


                                     $40


                                     $30


                                     $20


                                     $10


                                      $-


                                           Scenario 1   Scenario 2   Scenario 3


                                                                                  FCS GROUP   Page 8
SDC Background

                                    Key Characteristics
                                 1. SDCs are one-time
                                    charges, not ongoing rates.
                                 2. SDCs are for capital only, in
                                    both their calculation and in
    ORS 223.297 - 314, defines
                                    their use.
    “a uniform framework for
        the imposition of”       3. Properties which are
        SDCs, “to provide           already developed do not
      equitable funding for         pay SDCs unless they
       orderly growth and           “redevelop”.
    development in Oregon’s      4. SDCs include both future
          communities”              and existing cost
                                    components.
                                 5. SDCs are for general
                                    facilities, not “local”
                                    facilities.

                                                 FCS GROUP     Page 9
SDC Methodology


  Reimbursement       Improvement
                                        System Development
        Fee                Fee
                                              Charge

  Eligible cost or   Eligible cost of
 value of unused         planned
      capacity           capacity
     in existing        increasing
      facilities          facilities


     Growth in                              per unit of
                         Growth in
 system capacity                            capacity
                     system capacity
     demand              demand


                                         FCS GROUP        Page 10
SDC Calculation Summary


       SDC Components
       Description                    Amount
       Reimbursement fee             $   343
       Improvement fee                 2,305
       Adjustment                        (76)
       Total fee per customer unit   $ 2,572
       Current wastewater SDC        $ 1,789


                                                FCS GROUP   Page 11
Comparable SDCs


SDCs per Single-Family Residence
City                    Water     Wastewater   Stormwater      Transportation        Parks       Total
Estacada                $ 3,730   $    3,206   $      853      $        2,025       $ 2,104   $ 11,918
Madras                  $ 771     $    4,634   $      193      $        3,240       $ 1,639   $ 10,477
Hood River              $ 3,883   $    1,508   $      650      $          705       $ 1,733   $ 8,479
The Dalles, potential   $ 2,317   $    2,572   $      342      $        1,500       $ 1,552   $ 8,283
The Dalles, existing    $ 2,317   $    1,789   $      342      $        1,500       $ 1,552   $ 7,500
Sandy                   $ 1,525   $    1,834                   $        1,943       $ 2,000   $ 7,302
                                         Source: League of Oregon Cities (2010), City websites and staff


                                                                             FCS GROUP           Page 12

112612 fcs council presentation

  • 1.
    City of TheDalles, Wastewater Plan: Oregon Financial Element City Council Meeting John Ghilarducci November 26, 2012 FCS GROUP 4380 SW Macadam Avenue, Suite 220, Portland, OR 97239  503-841-6543
  • 2.
    Presentation Outline 1. RateFindings  Background  Key Assumptions  Rate Scenarios 2. SDC Findings  Background  SDC Calculation Summary  Comparable SDCs FCS GROUP Page 2
  • 3.
    What Should RatesDo?  Generate sufficient revenues to sustain the utility system  Charge for services provided  Recover costs equitably  Achieve City objectives  Revenue stability  Maintain minimum fund balances and meet other fiscal policies FCS GROUP Page 3
  • 4.
    Key Assumptions  Annualcost escalation  5.1% for personal services (historical rate)  3.2% for materials and services (CPI)  3.1% for capital outlay (ENR CCI)  Operating fund maintains 45-90 days of expenditures  Minimum revenue bond coverage ratio of 1.25  New debt modeled at 4.0% for 20 years FCS GROUP Page 4
  • 5.
    Rate Scenario 1 MinimumRequired Rate Increases without New Debt Fiscal Year Ended Category 6/30/2013 6/30/2014 6/30/2015 6/30/2016 6/30/2017 6/30/2018 6/30/2019 6/30/2020 Operating fund revenues Rate revenues $ 4,643,056 $ 4,643,056 $ 4,987,881 $ 5,821,700 $ 6,153,243 $ 6,628,156 $ 7,272,384 $ 7,308,746 Non-rate revenues 249,801 250,410 250,545 248,607 248,689 248,985 247,725 251,050 Total operating fund revenues $ 4,892,857 $ 4,893,466 $ 5,238,426 $ 6,070,307 $ 6,401,932 $ 6,877,141 $ 7,520,109 $ 7,559,796 Operating fund expenditures Operations and maintenance $ 3,462,977 $ 3,651,544 $ 3,793,651 $ 3,964,477 $ 4,076,565 $ 4,249,564 $ 4,434,547 $ 4,608,507 Capital outlay - - 1,495,466 1,458,474 1,604,627 2,440,074 733,470 799,058 Debt service 621,635 623,267 618,270 618,894 618,689 622,405 619,530 620,767 Total operating fund expenditures $ 4,084,612 $ 4,274,811 $ 5,907,386 $ 6,041,845 $ 6,299,881 $ 7,312,043 $ 5,787,548 $ 6,028,333 Capital expenditures outside operating fund $ 2,171,785 $ 1,734,450 $ 1,846,075 $ 5,348 $ 80,664 $ 81,285 $ 81,692 $ 667,000 Rate adjustment on March 1 0.00% 0.00% 22.28% 6.09% 3.44% 14.42% 0.00% 0.00% Monthly rate at year-end (currently $41.85) $ 41.85 $ 41.85 $ 51.17 $ 54.29 $ 56.16 $ 64.25 $ 64.25 $ 64.25 Revenue bond coverage ratio (1.25 minimum) 2.60 2.25 2.63 3.81 4.21 4.73 5.58 5.33 FCS GROUP Page 5
  • 6.
    Rate Scenario 2 SmoothedRate Increases without New Debt Fiscal Year Ended Category 6/30/2013 6/30/2014 6/30/2015 6/30/2016 6/30/2017 6/30/2018 6/30/2019 6/30/2020 Operating fund revenues Rate revenues $ 4,748,022 $ 5,070,038 $ 5,413,894 $ 5,809,975 $ 6,235,034 $ 6,691,191 $ 7,021,974 $ 7,057,084 Non-rate revenues 249,801 250,410 250,545 250,639 250,744 250,817 250,817 251,050 Total operating fund revenues $ 4,997,823 $ 5,320,448 $ 5,664,439 $ 6,060,614 $ 6,485,778 $ 6,942,008 $ 7,272,791 $ 7,308,134 Operating fund expenditures Operations and maintenance $ 3,466,126 $ 3,664,354 $ 3,806,431 $ 3,964,126 $ 4,079,019 $ 4,251,455 $ 4,427,035 $ 4,600,958 Capital outlay - - 979,181 1,228,911 1,391,404 2,068,148 732,393 - Debt service 621,635 623,267 618,270 618,894 618,689 622,405 619,530 620,767 Total operating fund expenditures $ 4,087,761 $ 4,287,621 $ 5,403,882 $ 5,811,931 $ 6,089,112 $ 6,942,008 $ 5,778,958 $ 5,221,725 Capital expenditures outside operating fund $ 2,171,785 $ 1,734,450 $ 2,362,359 $ 234,911 $ 293,887 $ 453,211 $ 82,770 $ 1,466,058 Rate adjustment on March 1 6.78% 6.78% 6.78% 6.78% 6.78% 6.78% 0.00% 0.00% Monthly rate at year-end (currently $41.85) $ 44.69 $ 47.72 $ 50.96 $ 54.41 $ 58.10 $ 62.04 $ 62.04 $ 62.04 Revenue bond coverage ratio (1.25 minimum) 2.79 2.99 3.38 3.80 4.36 4.85 5.15 4.90 FCS GROUP Page 6
  • 7.
    Rate Scenario 3 SmoothedRate Increases with Additional Revenue Bonds Fiscal Year Ended Category 6/30/2013 6/30/2014 6/30/2015 6/30/2016 6/30/2017 6/30/2018 6/30/2019 6/30/2020 Operating fund revenues Rate revenues $ 4,696,261 $ 4,857,707 $ 5,024,702 $ 5,223,425 $ 5,430,008 $ 5,644,761 $ 5,868,007 $ 6,100,083 Non-rate revenues 249,801 250,410 251,390 251,484 251,589 252,508 252,622 252,741 Total operating fund revenues $ 4,946,062 $ 5,108,117 $ 5,276,092 $ 5,474,910 $ 5,681,597 $ 5,897,269 $ 6,120,629 $ 6,352,823 Operating fund expenditures Operations and maintenance $ 3,464,573 $ 3,657,984 $ 3,794,755 $ 3,946,529 $ 4,054,868 $ 4,220,062 $ 4,392,416 $ 4,572,248 Capital outlay - - - - - - - - Debt service 621,635 915,029 910,032 910,656 1,202,214 1,205,930 1,203,055 1,496,054 Total operating fund expenditures $ 4,086,208 $ 4,573,013 $ 4,704,788 $ 4,857,185 $ 5,257,082 $ 5,425,992 $ 5,595,471 $ 6,068,302 Capital expenditures outside operating fund $ 2,171,785 $ 1,734,450 $ 3,341,541 $ 1,463,823 $ 1,685,291 $ 2,521,359 $ 815,162 $ 1,466,058 Rate adjustment on March 1 3.44% 3.44% 3.44% 3.44% 3.44% 3.44% 3.44% 3.44% Monthly rate at year-end (currently $41.85) $ 43.29 $ 44.78 $ 46.32 $ 47.91 $ 49.56 $ 51.26 $ 53.02 $ 54.84 Revenue bond coverage ratio (1.25 minimum) 2.70 1.72 1.77 1.82 1.44 1.48 1.53 1.25 FCS GROUP Page 7
  • 8.
    Scenario Comparison $70 $60 Monthly Wastewater Bill per Unit $50 $40 $30 $20 $10 $- Scenario 1 Scenario 2 Scenario 3 FCS GROUP Page 8
  • 9.
    SDC Background Key Characteristics 1. SDCs are one-time charges, not ongoing rates. 2. SDCs are for capital only, in both their calculation and in ORS 223.297 - 314, defines their use. “a uniform framework for the imposition of” 3. Properties which are SDCs, “to provide already developed do not equitable funding for pay SDCs unless they orderly growth and “redevelop”. development in Oregon’s 4. SDCs include both future communities” and existing cost components. 5. SDCs are for general facilities, not “local” facilities. FCS GROUP Page 9
  • 10.
    SDC Methodology Reimbursement Improvement System Development Fee Fee Charge Eligible cost or Eligible cost of value of unused planned capacity capacity in existing increasing facilities facilities Growth in per unit of Growth in system capacity capacity system capacity demand demand FCS GROUP Page 10
  • 11.
    SDC Calculation Summary SDC Components Description Amount Reimbursement fee $ 343 Improvement fee 2,305 Adjustment (76) Total fee per customer unit $ 2,572 Current wastewater SDC $ 1,789 FCS GROUP Page 11
  • 12.
    Comparable SDCs SDCs perSingle-Family Residence City Water Wastewater Stormwater Transportation Parks Total Estacada $ 3,730 $ 3,206 $ 853 $ 2,025 $ 2,104 $ 11,918 Madras $ 771 $ 4,634 $ 193 $ 3,240 $ 1,639 $ 10,477 Hood River $ 3,883 $ 1,508 $ 650 $ 705 $ 1,733 $ 8,479 The Dalles, potential $ 2,317 $ 2,572 $ 342 $ 1,500 $ 1,552 $ 8,283 The Dalles, existing $ 2,317 $ 1,789 $ 342 $ 1,500 $ 1,552 $ 7,500 Sandy $ 1,525 $ 1,834 $ 1,943 $ 2,000 $ 7,302 Source: League of Oregon Cities (2010), City websites and staff FCS GROUP Page 12

Editor's Notes

  • #5 There is purposefully no mention of growth assumptions.