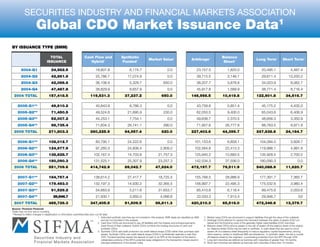
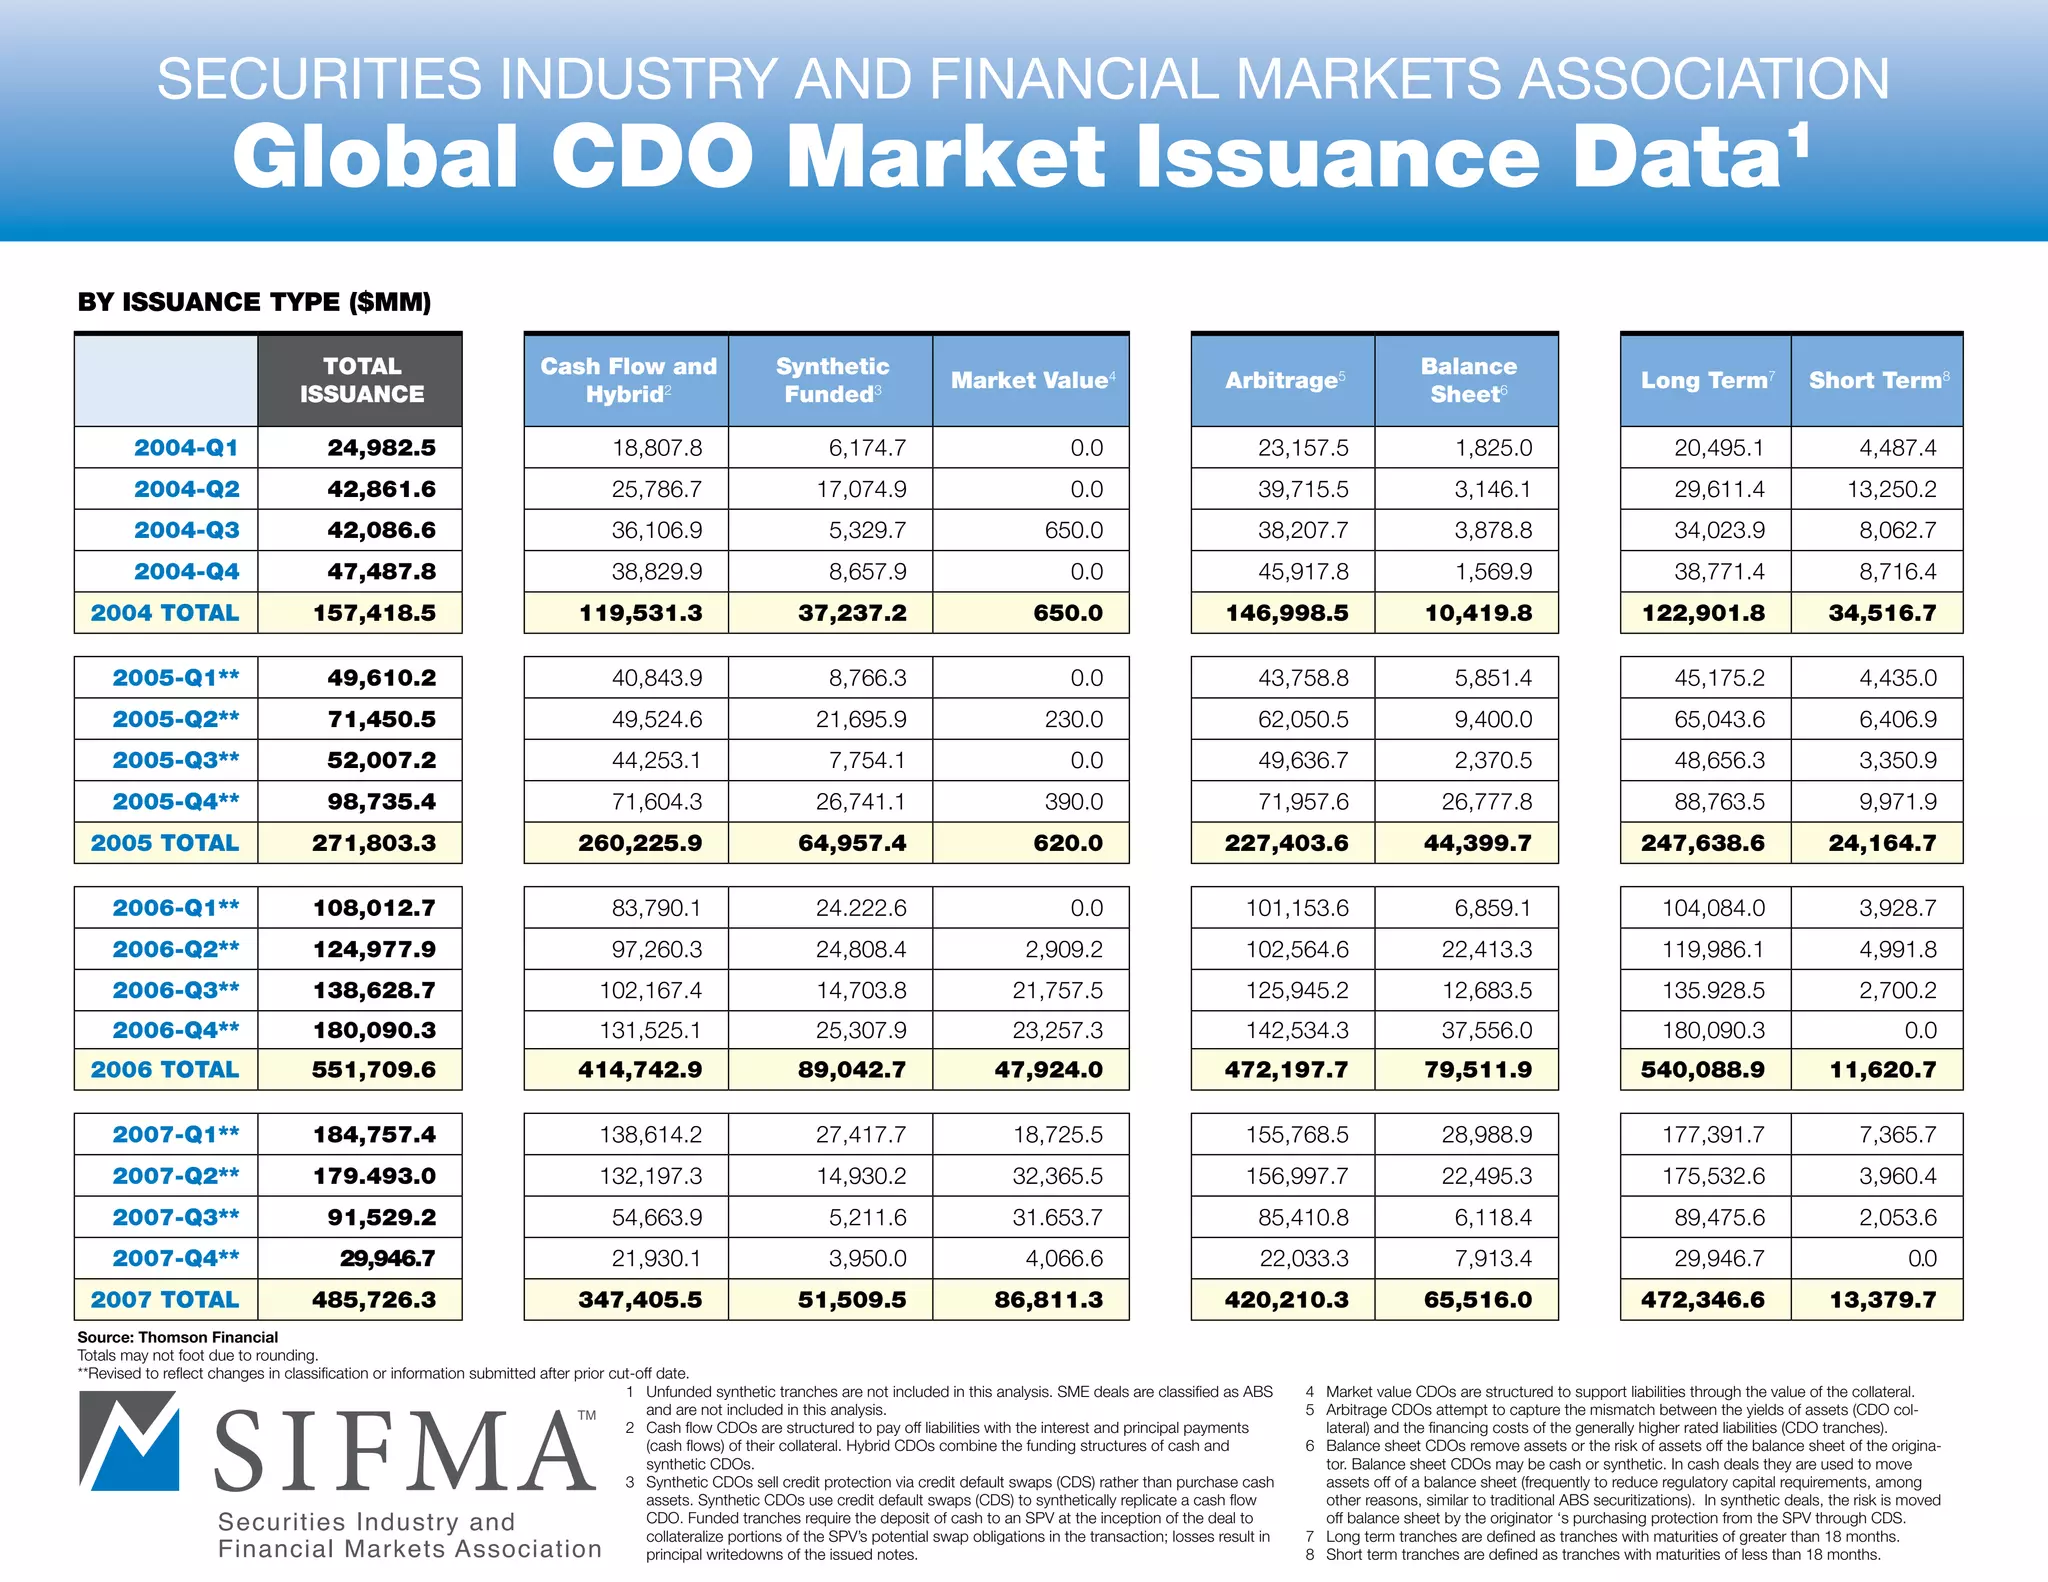
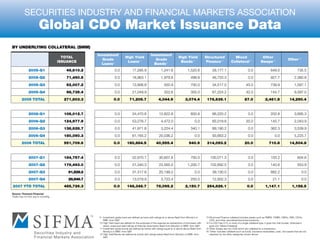
This document provides data on the global market for collateralized debt obligations (CDOs) from 2004 to 2007. It breaks down CDO issuance by type, including cash flow, synthetic, and hybrid structures. Total CDO issuance grew from $157 billion in 2004 to over $485 billion in 2007 before declining. Within types, cash flow CDOs made up the majority of issuance each year but synthetic CDOs increased their market share over this period. The data is broken down by quarter and presents totals for each year.
Isu tentang monopoli perusahaan PBM swasta di wilayah Pelindo khususnya Pelindo III cabang tanjung perak
disini kami meneliti dampak kebijakan tersebut
Isu tentang monopoli perusahaan PBM swasta di wilayah Pelindo khususnya Pelindo III cabang tanjung perak
disini kami meneliti dampak kebijakan tersebut
Financial Model Sample Format - Cement CompanyPranav Pareek
A sample of a basic financial model of a hypothetical cement company based in Kenya
Contains:
- Driver Sheet (with Revenue Model)
- Income Statement
- Balance Sheet
- Cash Flow
- DCF (including WACC calculation and Sensitivity Analysis)
- Ratio Analysis
Premium MEAN Stack Development Solutions for Modern BusinessesSynapseIndia
Stay ahead of the curve with our premium MEAN Stack Development Solutions. Our expert developers utilize MongoDB, Express.js, AngularJS, and Node.js to create modern and responsive web applications. Trust us for cutting-edge solutions that drive your business growth and success.
Know more: https://www.synapseindia.com/technology/mean-stack-development-company.html
Improving profitability for small businessBen Wann
In this comprehensive presentation, we will explore strategies and practical tips for enhancing profitability in small businesses. Tailored to meet the unique challenges faced by small enterprises, this session covers various aspects that directly impact the bottom line. Attendees will learn how to optimize operational efficiency, manage expenses, and increase revenue through innovative marketing and customer engagement techniques.
Cracking the Workplace Discipline Code Main.pptxWorkforce Group
Cultivating and maintaining discipline within teams is a critical differentiator for successful organisations.
Forward-thinking leaders and business managers understand the impact that discipline has on organisational success. A disciplined workforce operates with clarity, focus, and a shared understanding of expectations, ultimately driving better results, optimising productivity, and facilitating seamless collaboration.
Although discipline is not a one-size-fits-all approach, it can help create a work environment that encourages personal growth and accountability rather than solely relying on punitive measures.
In this deck, you will learn the significance of workplace discipline for organisational success. You’ll also learn
• Four (4) workplace discipline methods you should consider
• The best and most practical approach to implementing workplace discipline.
• Three (3) key tips to maintain a disciplined workplace.
VAT Registration Outlined In UAE: Benefits and Requirementsuae taxgpt
Vat Registration is a legal obligation for businesses meeting the threshold requirement, helping companies avoid fines and ramifications. Contact now!
https://viralsocialtrends.com/vat-registration-outlined-in-uae/
Putting the SPARK into Virtual Training.pptxCynthia Clay
This 60-minute webinar, sponsored by Adobe, was delivered for the Training Mag Network. It explored the five elements of SPARK: Storytelling, Purpose, Action, Relationships, and Kudos. Knowing how to tell a well-structured story is key to building long-term memory. Stating a clear purpose that doesn't take away from the discovery learning process is critical. Ensuring that people move from theory to practical application is imperative. Creating strong social learning is the key to commitment and engagement. Validating and affirming participants' comments is the way to create a positive learning environment.
Discover the innovative and creative projects that highlight my journey throu...dylandmeas
Discover the innovative and creative projects that highlight my journey through Full Sail University. Below, you’ll find a collection of my work showcasing my skills and expertise in digital marketing, event planning, and media production.
What are the main advantages of using HR recruiter services.pdfHumanResourceDimensi1
HR recruiter services offer top talents to companies according to their specific needs. They handle all recruitment tasks from job posting to onboarding and help companies concentrate on their business growth. With their expertise and years of experience, they streamline the hiring process and save time and resources for the company.
Falcon stands out as a top-tier P2P Invoice Discounting platform in India, bridging esteemed blue-chip companies and eager investors. Our goal is to transform the investment landscape in India by establishing a comprehensive destination for borrowers and investors with diverse profiles and needs, all while minimizing risk. What sets Falcon apart is the elimination of intermediaries such as commercial banks and depository institutions, allowing investors to enjoy higher yields.
What is the TDS Return Filing Due Date for FY 2024-25.pdfseoforlegalpillers
It is crucial for the taxpayers to understand about the TDS Return Filing Due Date, so that they can fulfill your TDS obligations efficiently. Taxpayers can avoid penalties by sticking to the deadlines and by accurate filing of TDS. Timely filing of TDS will make sure about the availability of tax credits. You can also seek the professional guidance of experts like Legal Pillers for timely filing of the TDS Return.
Business Valuation Principles for EntrepreneursBen Wann
This insightful presentation is designed to equip entrepreneurs with the essential knowledge and tools needed to accurately value their businesses. Understanding business valuation is crucial for making informed decisions, whether you're seeking investment, planning to sell, or simply want to gauge your company's worth.
Enterprise Excellence is Inclusive Excellence.pdfKaiNexus
Enterprise excellence and inclusive excellence are closely linked, and real-world challenges have shown that both are essential to the success of any organization. To achieve enterprise excellence, organizations must focus on improving their operations and processes while creating an inclusive environment that engages everyone. In this interactive session, the facilitator will highlight commonly established business practices and how they limit our ability to engage everyone every day. More importantly, though, participants will likely gain increased awareness of what we can do differently to maximize enterprise excellence through deliberate inclusion.
What is Enterprise Excellence?
Enterprise Excellence is a holistic approach that's aimed at achieving world-class performance across all aspects of the organization.
What might I learn?
A way to engage all in creating Inclusive Excellence. Lessons from the US military and their parallels to the story of Harry Potter. How belt systems and CI teams can destroy inclusive practices. How leadership language invites people to the party. There are three things leaders can do to engage everyone every day: maximizing psychological safety to create environments where folks learn, contribute, and challenge the status quo.
Who might benefit? Anyone and everyone leading folks from the shop floor to top floor.
Dr. William Harvey is a seasoned Operations Leader with extensive experience in chemical processing, manufacturing, and operations management. At Michelman, he currently oversees multiple sites, leading teams in strategic planning and coaching/practicing continuous improvement. William is set to start his eighth year of teaching at the University of Cincinnati where he teaches marketing, finance, and management. William holds various certifications in change management, quality, leadership, operational excellence, team building, and DiSC, among others.
RMD24 | Debunking the non-endemic revenue myth Marvin Vacquier Droop | First ...BBPMedia1
Marvin neemt je in deze presentatie mee in de voordelen van non-endemic advertising op retail media netwerken. Hij brengt ook de uitdagingen in beeld die de markt op dit moment heeft op het gebied van retail media voor niet-leveranciers.
Retail media wordt gezien als het nieuwe advertising-medium en ook mediabureaus richten massaal retail media-afdelingen op. Merken die niet in de betreffende winkel liggen staan ook nog niet in de rij om op de retail media netwerken te adverteren. Marvin belicht de uitdagingen die er zijn om echt aansluiting te vinden op die markt van non-endemic advertising.
LA HUG - Video Testimonials with Chynna Morgan - June 2024Lital Barkan
Have you ever heard that user-generated content or video testimonials can take your brand to the next level? We will explore how you can effectively use video testimonials to leverage and boost your sales, content strategy, and increase your CRM data.🤯
We will dig deeper into:
1. How to capture video testimonials that convert from your audience 🎥
2. How to leverage your testimonials to boost your sales 💲
3. How you can capture more CRM data to understand your audience better through video testimonials. 📊
LA HUG - Video Testimonials with Chynna Morgan - June 2024
Global CDO market Issuance Data
1. SecuritieS induStry and financial MarketS aSSociation
Global CDO Market Issuance Data1
By IssuanCe Type ($MM)
TOTal Cash Flow and synthetic Balance
Market Value4 arbitrage5 long Term7 short Term8
IssuanCe Hybrid2 Funded3 sheet6
2004-Q1 24,982.5 18,807.8 6,174.7 0.0 23,157.5 1,825.0 20,495.1 4,487.4
2004-Q2 42,861.6 25,786.7 17,074.9 0.0 39,715.5 3,146.1 29,611.4 13,250.2
2004-Q3 42,086.6 36,106.9 5,329.7 650.0 38,207.7 3,878.8 34,023.9 8,062.7
2004-Q4 47,487.8 38,829.9 8,657.9 0.0 45,917.8 1,569.9 38,771.4 8,716.4
2004 TOTal 157,418.5 119,531.3 37,237.2 650.0 146,998.5 10,419.8 122,901.8 34,516.7
2005-Q1** 49,610.2 40,843.9 8,766.3 0.0 43,758.8 5,851.4 45,175.2 4,435.0
2005-Q2** 71,450.5 49,524.6 21,695.9 230.0 62,050.5 9,400.0 65,043.6 6,406.9
2005-Q3** 52,007.2 44,253.1 7,754.1 0.0 49,636.7 2,370.5 48,656.3 3,350.9
2005-Q4** 98,735.4 71,604.3 26,741.1 390.0 71,957.6 26,777.8 88,763.5 9,971.9
2005 TOTal 271,803.3 260,225.9 64,957.4 620.0 227,403.6 44,399.7 247,638.6 24,164.7
2006-Q1** 108,012.7 83,790.1 24.222.6 0.0 101,153.6 6,859.1 104,084.0 3,928.7
2006-Q2** 124,977.9 97,260.3 24,808.4 2,909.2 102,564.6 22,413.3 119,986.1 4,991.8
2006-Q3** 138,628.7 102,167.4 14,703.8 21,757.5 125,945.2 12,683.5 135.928.5 2,700.2
2006-Q4** 180,090.3 131,525.1 25,307.9 23,257.3 142,534.3 37,556.0 180,090.3 0.0
2006 TOTal 551,709.6 414,742.9 89,042.7 47,924.0 472,197.7 79,511.9 540,088.9 11,620.7
2007-Q1** 184,757.4 138,614.2 27,417.7 18,725.5 155,768.5 28,988.9 177,391.7 7,365.7
2007-Q2** 179.493.0 132,197.3 14,930.2 32,365.5 156,997.7 22,495.3 175,532.6 3,960.4
2007-Q3** 91,529.2 54,663.9 5,211.6 31.653.7 85,410.8 6,118.4 89,475.6 2,053.6
2007-Q4** 29,946.7 21,930.1 3,950.0 4,066.6 22,033.3 7,913.4 29,946.7 0.0
2007 TOTal 485,726.3 347,405.5 51,509.5 86,811.3 420,210.3 65,516.0 472,346.6 13,379.7
Source: Thomson Financial
Totals may not foot due to rounding.
**Revised to reflect changes in classification or information submitted after prior cut-off date.
1 Unfunded synthetic tranches are not included in this analysis. SME deals are classified as ABS 4 Market value CDOs are structured to support liabilities through the value of the collateral.
and are not included in this analysis. 5 Arbitrage CDOs attempt to capture the mismatch between the yields of assets (CDO col-
2 Cash flow CDOs are structured to pay off liabilities with the interest and principal payments lateral) and the financing costs of the generally higher rated liabilities (CDO tranches).
(cash flows) of their collateral. Hybrid CDOs combine the funding structures of cash and 6 Balance sheet CDOs remove assets or the risk of assets off the balance sheet of the origina-
synthetic CDOs. tor. Balance sheet CDOs may be cash or synthetic. In cash deals they are used to move
3 Synthetic CDOs sell credit protection via credit default swaps (CDS) rather than purchase cash assets off of a balance sheet (frequently to reduce regulatory capital requirements, among
assets. Synthetic CDOs use credit default swaps (CDS) to synthetically replicate a cash flow other reasons, similar to traditional ABS securitizations). In synthetic deals, the risk is moved
CDO. Funded tranches require the deposit of cash to an SPV at the inception of the deal to off balance sheet by the originator ‘s purchasing protection from the SPV through CDS.
collateralize portions of the SPV’s potential swap obligations in the transaction; losses result in 7 Long term tranches are defined as tranches with maturities of greater than 18 months.
principal writedowns of the issued notes. 8 Short term tranches are defined as tranches with maturities of less than 18 months.
2. SecuritieS induStry and financial MarketS aSSociation
Global CDO Market Issuance Data
By unDerlyInG COllaTeral ($MM)
Investment Investment
TOTal High yield High yield structured Mixed Other
Grade Grade Other 16
IssuanCe loans10 Bonds12 Finance13 Collateral14 swaps15
loans9 Bonds11
2005-Q1 49,610.2 0.0 17,285.9 1,241.6 1,520.6 28,177.1 0.0 649.5 735.5
2005-Q2 71,450.5 0.0 18,963.1 1,979.8 498.8 46,720.3 0.0 927.7 2,360.8
2005-Q3 52,007.2 0.0 13,906.8 500.9 700.0 34,517.5 45.0 739.9 1,597.1
2005-Q4 98,735.4 0.0 21,049.9 322.6 355.0 67,224.2 42.0 144.7 9,597.0
2005 TOTal 271,803.3 0.0 71,205.7 4,044.9 3,074.4 176,639.1 87.0 2,461.8 14,290.4
2006-Q1 108,012.7 0.0 24,470.8 12,822.8 600.8 66,220.2 0.0 202.8 3,695.3
Source: Thomson Financial
2006-Q2
Totals may not foot due to rounding. 124,977.9 0.0 53,276.7 4,472.0 0.0 65,019.6 20.0 145.7 2,043.9
2006-Q3 138,628.7 0.0 41,971.8 3,224.4 340.1 89,190.2 0.0 362.3 3,539.9
2006-Q4 180,090.3 0.0 61,165.2 20,036.2 0.0 93,663.2 0.0 0.0 5,225.7
2006 TOTal 551,709.6 0.0 180,884.5 40,555.4 940.9 314,093.2 20.0 710.8 14,504.8
2007-Q1 184,757.4 0.0 52,670.7 30,607.6 700.0 100,071.3 0.0 103.2 604.6
2007-Q2 179,493.0 0.0 51,340.3 23,565.0 1,200.7 102,692.5 0.0 140.6 553.9
2007-Q3 91,529.2 0.0 31,317.8 20,199.2 0.0 39,130.0 0.0 882.2 0.0
2007-Q4 29,946.7 0.0 13,019.9 3,723.4 250.0 12,932.3 0.0 21.1 0.0
2007 yTD TOTal 485,726.3 0.0 148,348.7 78,095.2 2,150.7 254,826.1 0.0 1,147.1 1,158.5
Source: Thomson Financial
Totals may not foot due to rounding.
9 Investment grade loans are defined as loans with ratings at or above Baa3 from Moody’s or 13 Structured Finance collateral includes assets such as RMBS, CMBS, CMOs, ABS, CDOs,
BBB- from S&P. CDS, and other securitized/structured products.
10 High Yield loans are defined for the purposes of this exercise as transactions of borrowers with 14 If a CDO has 51% or more of a single collateral type, it goes into that bucket, otherwise it
senior unsecured debt ratings at financial close below Baa3 from Moody’s or BBB- from S&P. goes into ‘Mixed Collateral’.
11 Investment grade bonds are defined as bonds with ratings equal to or above above Baa3 from 15 Other Swaps are non-CDS which are collateral for a transaction.
Moody’s or BBB- from S&P. 16 ‘Other’ includes collateral such as funds, insurance receivables, cash, and assets that are not
12 High Yield Bonds are defined as bonds with ratings below Baa3 from Moody’s or BBB- from captured by the other categories shown above.
S&P.
3. SecuritieS induStry and financial MarketS aSSociation
Global CDO Market Issuance Data
By CurrenCy ($MM)
TOTal
us euro yen sterling Other
IssuanCe
2005-Q1 49,610.2 38,781.8 8,436.4 2,288.6 0.0 103.4
2005-Q2 71,450.5 46,212.1 19,492.8 1,847.0 365.7
3,532.9
2005-Q3 52,007.2 46,116.3 4,326.3 1,184.1 0.0 380.5
2005-Q4 98,735.4 77,993.5 11,222.2 216.9 9,302.8 0.0
2005 TOTal 271,803.3 209,103.7 43,477.7 5,536.6 9,668.5 4,016.8
2006-Q1 108,012.7 90,281.4 14,286.3 3,205.1 0.0 239.9
2006-Q2 124,977.9 90,833.1 31,822.6 1,016.5 89.6 1,216.1
2006-Q3 138,628.7 114,495.5 20,489.2 1,366.3 0.0 2,277.7
2006-Q4 180,090.3 125,989.0 43,522.4 886.0 8,294.1 1,398.8
2006 TOTal 551,709.6 421,599.0 110,120.5 6,473.9 8,383.7 5,132.5
2007-Q1 184,757.4 124,479.8 47,949.6 1,615.9 7,903.1 1,809.0
2007-Q2 179,493.0 136,157.5 40, 445.5 877.6 105.9 1,906.5
2007-Q3 91,529.2 53,825.0 34,426.6 815.9 689.5 1772.2
2007-Q4 29,946.7 19,219.9 9,017.4 0.0 0.0 1,709.4
2007 yTD TOTal
485,726.3 334,682.2 131,839.1 3309.4 8,698.5 7,197.1
Source: Thomson Financial
Totals may not foot due to rounding.