SlideShare a Scribd company logo
1 of 1
Download to read offline
WEST MACKAY - Sales & Growth Chart (House)


            Year                      No. of Sales                      Average                   Moving Median                         Growth                          Low                           High
              2007                              147                          $ 363,953                         $ 345,000                                                $ 112,100                      $ 900,000
              2008                              106                          $ 382,746                         $ 365,250                     5.9 %                      $ 198,000                      $ 950,000
              2009                              112                          $ 386,527                         $ 350,000                    -4.2 %                      $ 220,000                   $ 1,500,000
              2010                                 0


This report has been compiled on 04/03/2010 by Ray White Mackay City. © Property Data Solutions Pty Ltd 2010 - www.pricefinder.com.au
The materials provided are distributed as an information source only. © The State of Queensland (Dept. of Natural Resources, Mines and Energy) March/2010. Based on data provided with the
permission of the Dept. of Natural Resources, Mines and Energy: (QVAS) March/2010. The Dept. of Natural Resources, Mines and Energy makes no representations or warranties about accuracy,
reliability, completeness or suitability of the data for any particular purpose and disclaims all responsibility and all liability (including without limitation, liability in negligence) for all expenses, losses,
damages (including indirect or consequential damage) and costs which might be incurred as a result of the data being inaccurate or incomplete in any way and for any reason.

More Related Content

What's hot (16)

Q108Non_GAAP_Disclosure_Sales
Q108Non_GAAP_Disclosure_SalesQ108Non_GAAP_Disclosure_Sales
Q108Non_GAAP_Disclosure_Sales
 
Realogics Urbnlivn Presentation
Realogics Urbnlivn PresentationRealogics Urbnlivn Presentation
Realogics Urbnlivn Presentation
 
Owens_MinorQ307slides
Owens_MinorQ307slidesOwens_MinorQ307slides
Owens_MinorQ307slides
 
Stores 549 Report
Stores 549 ReportStores 549 Report
Stores 549 Report
 
Pre Budget Meeting December 5, 2012
Pre Budget Meeting December 5, 2012 Pre Budget Meeting December 5, 2012
Pre Budget Meeting December 5, 2012
 
Dcf
DcfDcf
Dcf
 
Galaxy Gaming (GLXZ) 2011 Earning Conference Call
Galaxy Gaming (GLXZ) 2011 Earning Conference CallGalaxy Gaming (GLXZ) 2011 Earning Conference Call
Galaxy Gaming (GLXZ) 2011 Earning Conference Call
 
Libro1 Industria Abc Ejercicio Excel
Libro1 Industria Abc Ejercicio ExcelLibro1 Industria Abc Ejercicio Excel
Libro1 Industria Abc Ejercicio Excel
 
June 2010 Philadelphia County Sold Median Price
June 2010 Philadelphia County Sold Median PriceJune 2010 Philadelphia County Sold Median Price
June 2010 Philadelphia County Sold Median Price
 
Delaware County Sold Median Price
Delaware County Sold Median PriceDelaware County Sold Median Price
Delaware County Sold Median Price
 
8 9 Cyn Lk
8 9 Cyn Lk8 9 Cyn Lk
8 9 Cyn Lk
 
Supplemental Data – Q2 2014 Earnings Call
Supplemental Data – Q2 2014 Earnings CallSupplemental Data – Q2 2014 Earnings Call
Supplemental Data – Q2 2014 Earnings Call
 
July 2010 Philadelphia County Basic Supply and Demand
July 2010 Philadelphia County Basic Supply and DemandJuly 2010 Philadelphia County Basic Supply and Demand
July 2010 Philadelphia County Basic Supply and Demand
 
4Q 07 EARNINGS SLIDES
4Q 07 EARNINGS SLIDES4Q 07 EARNINGS SLIDES
4Q 07 EARNINGS SLIDES
 
July 2010 Philadelphia County Basic Supply and Demand
July 2010 Philadelphia County Basic Supply and DemandJuly 2010 Philadelphia County Basic Supply and Demand
July 2010 Philadelphia County Basic Supply and Demand
 
June 2010 Philadelphia County Basic Supply and Demand
June 2010 Philadelphia County Basic Supply and DemandJune 2010 Philadelphia County Basic Supply and Demand
June 2010 Philadelphia County Basic Supply and Demand
 

Similar to West Mackay Growth Chart

pitney bowes TopQuestions_2
pitney bowes  TopQuestions_2pitney bowes  TopQuestions_2
pitney bowes TopQuestions_2finance47
 
pitney bowes TopQuestions_2
pitney bowes  TopQuestions_2pitney bowes  TopQuestions_2
pitney bowes TopQuestions_2finance47
 
pitney bowes Monahan_2
pitney bowes  Monahan_2pitney bowes  Monahan_2
pitney bowes Monahan_2finance47
 
pitney bowes Monahan_2
pitney bowes  Monahan_2pitney bowes  Monahan_2
pitney bowes Monahan_2finance47
 
oe E. Harlan Executive Vice President, Electro and Communications Business
oe E. Harlan Executive Vice President, Electro and Communications Businessoe E. Harlan Executive Vice President, Electro and Communications Business
oe E. Harlan Executive Vice President, Electro and Communications Businessfinance10
 
39348363 google-earnings-slides-q3-2010
39348363 google-earnings-slides-q3-201039348363 google-earnings-slides-q3-2010
39348363 google-earnings-slides-q3-2010Pranav Bhatnagar
 
2010 q3 google_earnings_slides
2010 q3 google_earnings_slides2010 q3 google_earnings_slides
2010 q3 google_earnings_slidesrabier
 
Granite Company Overview 2013 | Nationwide Voice and Data for Businesses
Granite Company Overview 2013 | Nationwide Voice and Data for BusinessesGranite Company Overview 2013 | Nationwide Voice and Data for Businesses
Granite Company Overview 2013 | Nationwide Voice and Data for BusinessesShane Hoff
 
Community Market Report | August 2012
Community Market Report | August 2012Community Market Report | August 2012
Community Market Report | August 2012Charter One Realty
 
2010 City Of Bethlehem Finance And Budget Presentation
2010 City Of Bethlehem Finance And Budget Presentation2010 City Of Bethlehem Finance And Budget Presentation
2010 City Of Bethlehem Finance And Budget PresentationNachman Shelef
 
newmont mining 5_20_08_GS_Basic_Materials_Conference
newmont mining 5_20_08_GS_Basic_Materials_Conferencenewmont mining 5_20_08_GS_Basic_Materials_Conference
newmont mining 5_20_08_GS_Basic_Materials_Conferencefinance37
 
newmont mining 5_20_08_GS_Basic_Materials_Conference
newmont mining 5_20_08_GS_Basic_Materials_Conferencenewmont mining 5_20_08_GS_Basic_Materials_Conference
newmont mining 5_20_08_GS_Basic_Materials_Conferencefinance37
 
Q1 2010 Shareholder Presentation May 2010
Q1 2010 Shareholder Presentation May 2010Q1 2010 Shareholder Presentation May 2010
Q1 2010 Shareholder Presentation May 2010Monster12
 

Similar to West Mackay Growth Chart (20)

pitney bowes TopQuestions_2
pitney bowes  TopQuestions_2pitney bowes  TopQuestions_2
pitney bowes TopQuestions_2
 
pitney bowes TopQuestions_2
pitney bowes  TopQuestions_2pitney bowes  TopQuestions_2
pitney bowes TopQuestions_2
 
pitney bowes Monahan_2
pitney bowes  Monahan_2pitney bowes  Monahan_2
pitney bowes Monahan_2
 
pitney bowes Monahan_2
pitney bowes  Monahan_2pitney bowes  Monahan_2
pitney bowes Monahan_2
 
oe E. Harlan Executive Vice President, Electro and Communications Business
oe E. Harlan Executive Vice President, Electro and Communications Businessoe E. Harlan Executive Vice President, Electro and Communications Business
oe E. Harlan Executive Vice President, Electro and Communications Business
 
Google Earnings Slides 2009 Q2
Google Earnings Slides 2009 Q2Google Earnings Slides 2009 Q2
Google Earnings Slides 2009 Q2
 
39348363 google-earnings-slides-q3-2010
39348363 google-earnings-slides-q3-201039348363 google-earnings-slides-q3-2010
39348363 google-earnings-slides-q3-2010
 
2010 q3 google_earnings_slides
2010 q3 google_earnings_slides2010 q3 google_earnings_slides
2010 q3 google_earnings_slides
 
Aoc63
Aoc63Aoc63
Aoc63
 
Granite Company Overview 2013 | Nationwide Voice and Data for Businesses
Granite Company Overview 2013 | Nationwide Voice and Data for BusinessesGranite Company Overview 2013 | Nationwide Voice and Data for Businesses
Granite Company Overview 2013 | Nationwide Voice and Data for Businesses
 
Jan 2010 Austin Economic Indicators
Jan 2010 Austin Economic IndicatorsJan 2010 Austin Economic Indicators
Jan 2010 Austin Economic Indicators
 
Jan 2010 Austin Economic Indicators
Jan 2010 Austin Economic IndicatorsJan 2010 Austin Economic Indicators
Jan 2010 Austin Economic Indicators
 
Community Market Report | August 2012
Community Market Report | August 2012Community Market Report | August 2012
Community Market Report | August 2012
 
2010 City Of Bethlehem Finance And Budget Presentation
2010 City Of Bethlehem Finance And Budget Presentation2010 City Of Bethlehem Finance And Budget Presentation
2010 City Of Bethlehem Finance And Budget Presentation
 
newmont mining 5_20_08_GS_Basic_Materials_Conference
newmont mining 5_20_08_GS_Basic_Materials_Conferencenewmont mining 5_20_08_GS_Basic_Materials_Conference
newmont mining 5_20_08_GS_Basic_Materials_Conference
 
newmont mining 5_20_08_GS_Basic_Materials_Conference
newmont mining 5_20_08_GS_Basic_Materials_Conferencenewmont mining 5_20_08_GS_Basic_Materials_Conference
newmont mining 5_20_08_GS_Basic_Materials_Conference
 
Q1 2010 Shareholder Presentation May 2010
Q1 2010 Shareholder Presentation May 2010Q1 2010 Shareholder Presentation May 2010
Q1 2010 Shareholder Presentation May 2010
 
IT Industry Statistics 2007 Final Report
IT Industry Statistics 2007 Final ReportIT Industry Statistics 2007 Final Report
IT Industry Statistics 2007 Final Report
 
Charts
ChartsCharts
Charts
 
Lake Elsinore EWDC 2-21-13
Lake Elsinore EWDC 2-21-13Lake Elsinore EWDC 2-21-13
Lake Elsinore EWDC 2-21-13
 

More from chrislaval

Recent Economic News for Mackay
Recent Economic News for MackayRecent Economic News for Mackay
Recent Economic News for Mackaychrislaval
 
Eimeo Growth Charts
Eimeo Growth ChartsEimeo Growth Charts
Eimeo Growth Chartschrislaval
 
Mount Pleasant Growth Charts
Mount Pleasant Growth ChartsMount Pleasant Growth Charts
Mount Pleasant Growth Chartschrislaval
 
Residential Land Activity Mackay
Residential Land Activity MackayResidential Land Activity Mackay
Residential Land Activity Mackaychrislaval
 
Pop Housing Fact Sheets Mackay 200908
Pop Housing Fact Sheets Mackay 200908Pop Housing Fact Sheets Mackay 200908
Pop Housing Fact Sheets Mackay 200908chrislaval
 
Pop Growth Highlights Trends Qld 2009
Pop Growth Highlights Trends Qld 2009Pop Growth Highlights Trends Qld 2009
Pop Growth Highlights Trends Qld 2009chrislaval
 
Mackay Regional Profile
Mackay Regional ProfileMackay Regional Profile
Mackay Regional Profilechrislaval
 
E Newsletter 19 February 2010
E Newsletter 19 February 2010E Newsletter 19 February 2010
E Newsletter 19 February 2010chrislaval
 

More from chrislaval (8)

Recent Economic News for Mackay
Recent Economic News for MackayRecent Economic News for Mackay
Recent Economic News for Mackay
 
Eimeo Growth Charts
Eimeo Growth ChartsEimeo Growth Charts
Eimeo Growth Charts
 
Mount Pleasant Growth Charts
Mount Pleasant Growth ChartsMount Pleasant Growth Charts
Mount Pleasant Growth Charts
 
Residential Land Activity Mackay
Residential Land Activity MackayResidential Land Activity Mackay
Residential Land Activity Mackay
 
Pop Housing Fact Sheets Mackay 200908
Pop Housing Fact Sheets Mackay 200908Pop Housing Fact Sheets Mackay 200908
Pop Housing Fact Sheets Mackay 200908
 
Pop Growth Highlights Trends Qld 2009
Pop Growth Highlights Trends Qld 2009Pop Growth Highlights Trends Qld 2009
Pop Growth Highlights Trends Qld 2009
 
Mackay Regional Profile
Mackay Regional ProfileMackay Regional Profile
Mackay Regional Profile
 
E Newsletter 19 February 2010
E Newsletter 19 February 2010E Newsletter 19 February 2010
E Newsletter 19 February 2010
 

West Mackay Growth Chart

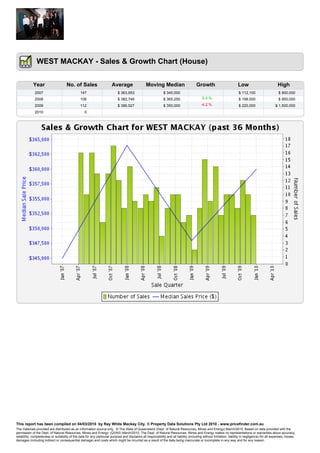
  • 1. WEST MACKAY - Sales & Growth Chart (House) Year No. of Sales Average Moving Median Growth Low High 2007 147 $ 363,953 $ 345,000 $ 112,100 $ 900,000 2008 106 $ 382,746 $ 365,250 5.9 % $ 198,000 $ 950,000 2009 112 $ 386,527 $ 350,000 -4.2 % $ 220,000 $ 1,500,000 2010 0 This report has been compiled on 04/03/2010 by Ray White Mackay City. © Property Data Solutions Pty Ltd 2010 - www.pricefinder.com.au The materials provided are distributed as an information source only. © The State of Queensland (Dept. of Natural Resources, Mines and Energy) March/2010. Based on data provided with the permission of the Dept. of Natural Resources, Mines and Energy: (QVAS) March/2010. The Dept. of Natural Resources, Mines and Energy makes no representations or warranties about accuracy, reliability, completeness or suitability of the data for any particular purpose and disclaims all responsibility and all liability (including without limitation, liability in negligence) for all expenses, losses, damages (including indirect or consequential damage) and costs which might be incurred as a result of the data being inaccurate or incomplete in any way and for any reason.