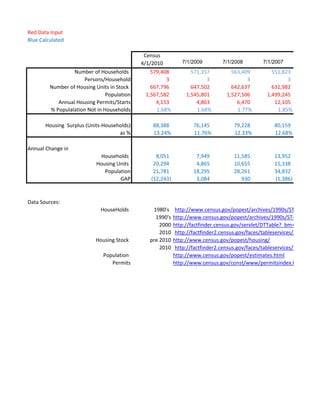
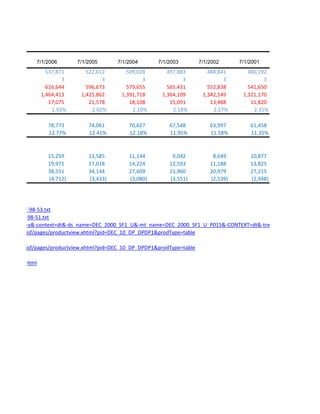
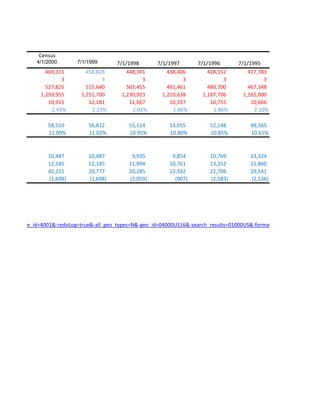
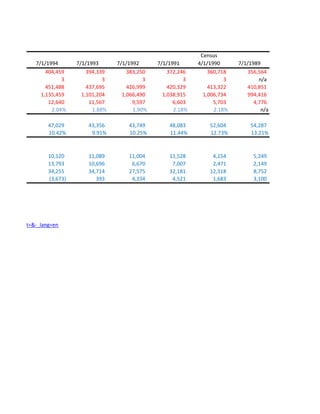
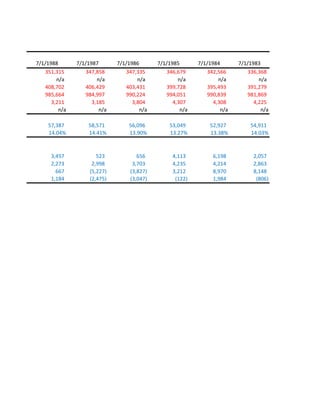
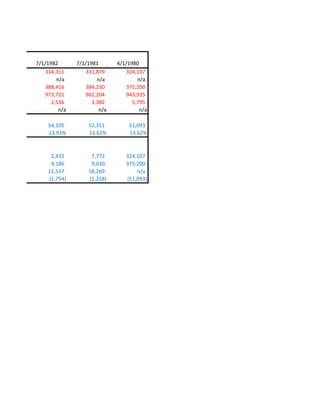
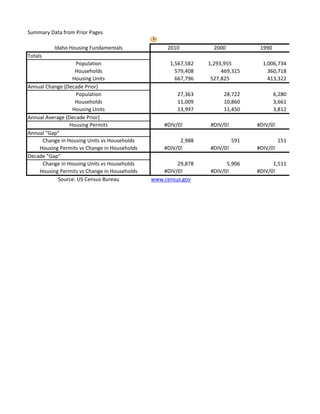
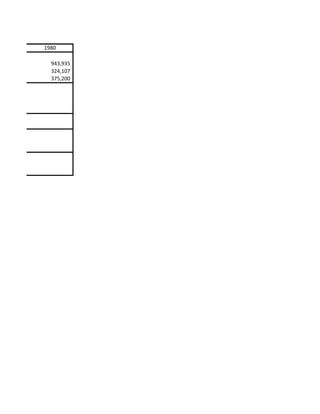
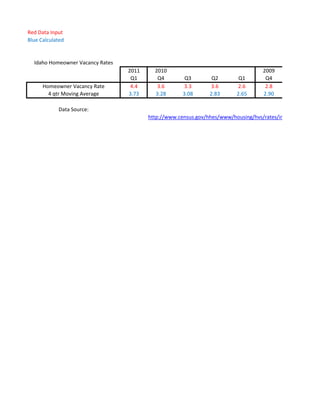
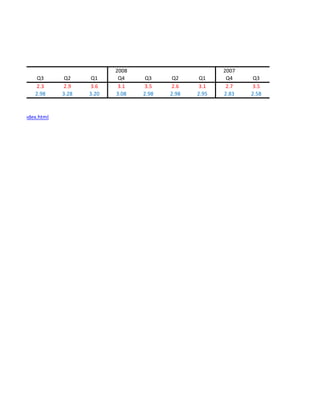
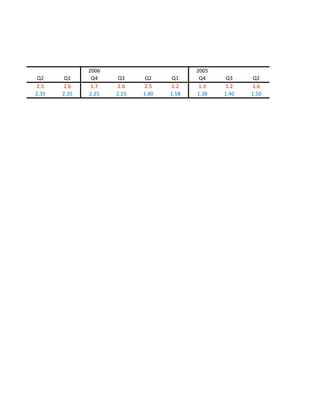
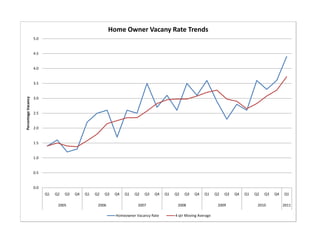
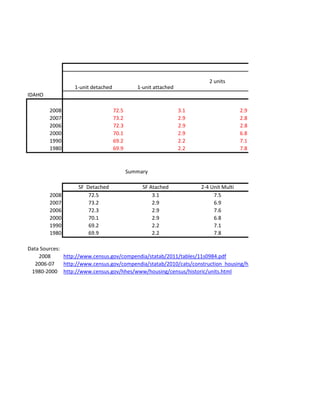
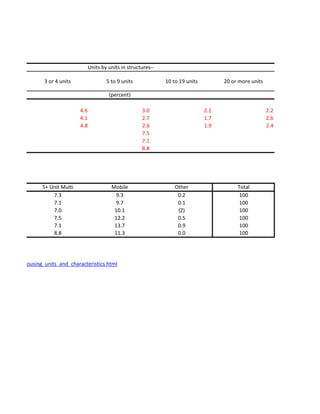
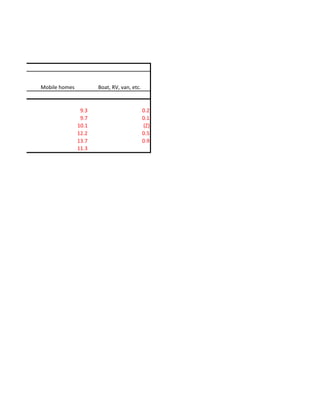
The following data sheets support assessments done in June 2011 to discuss Idaho's "housing Overhang."

A Powerpoint Presentation on this Website entitled " Idaho Housing Market Fundamentals" by Brian Greber is
based upon this data.
That presentation includes the following definitions:

•A housing unit is a house, an apartment, a mobile home, a group of rooms, or a single room that is occupied (or if vacant, is intended for
occupancy) as separate living quarters. Separate living quarters are those in which the occupants live and eat separately from any other persons
in the building and which have direct access from the outside of the building or through a common hall.


•A household includes all the persons who occupy a housing unit. A housing unit is a house, an apartment, a mobile home, a group of rooms,
or a single room that is occupied (or if vacant, is intended for occupancy) as separate living quarters. Separate living quarters are those in which
the occupants live and eat separately from any other persons in the building and which have direct access from the outside of the building or
through a common hall. The occupants may be a single family, one person living alone, two or more families living together, or any other group
of related or unrelated persons who share living arrangements. (People not living in households are classified as living in group quarters.)
•Building permits represent the number of new housing units authorized by building permits in the United States. The building permits data
relate to new private housing units intended for occupancy on a housekeeping basis. They exclude mobile homes (trailers), hotels, motels, and
group residential structures, such as nursing homes and college dormitories. They also exclude conversions of and alterations to existing
buildings.
–These are typically referred to as “housing starts”
•The homeowner vacancy rate is the proportion of the homeowner inventory that is vacant “for sale.” It is computed by dividing the total
number of vacant units “for sale only” by the sum of owner-occupied units,vacant units that are “for sale only,” and vacant units that have been
sold but not yet occupied; and then multiplying by 100.


Data sources are shown with links below each table.
Red Data Input
Blue Calculated

                                              Census
                                             4/1/2010         7/1/2009          7/1/2008         7/1/2007
                  Number of Households           579,408          571,357          563,409          551,823
                       Persons/Household               3                3                3                3
         Number of Housing Units in Stock        667,796          647,502          642,637          631,982
                                Population     1,567,582        1,545,801        1,527,506        1,499,245
            Annual Housing Permits/Starts          4,153            4,863            6,470           12,105
         % Populalation Not in Households          1.68%            1.68%            1.77%            1.85%

       Housing Surplus (Units-Households)        88,388            76,145           79,228           80,159
                                    as %         13.24%            11.76%           12.33%           12.68%

Annual Change in
                            Households            8,051             7,949           11,585           13,952
                           Housing Units         20,294             4,865           10,655           15,338
                              Population         21,781            18,295           28,261           34,832
                                    GAP         (12,243)            3,084              930           (1,386)


Data Sources:
                             HouseHolds          1980's     http://www.census.gov/popest/archives/1990s/ST-98-53.txt
                                                  1990's   http://www.census.gov/popest/archives/1990s/ST-98-51.txt
                                                    2000   http://factfinder.census.gov/servlet/DTTable?_bm=y&-context
                                                    2010    http://factfinder2.census.gov/faces/tableservices/jsf/pages/pr
                           Housing Stock        pre 2010   http://www.census.gov/popest/housing/
                                                    2010    http://factfinder2.census.gov/faces/tableservices/jsf/pages/pr
                              Population                   http://www.census.gov/popest/estimates.html
                                 Permits                   http://www.census.gov/const/www/permitsindex.html
7/1/2006        7/1/2005      7/1/2004        7/1/2003         7/1/2002      7/1/2001
                    537,871      522,612        509,028        497,883          488,841       480,192
                          3            3              3              3                3             3
                    616,644      596,673        579,655        565,431          552,838       541,650
                  1,464,413    1,425,862      1,391,718      1,364,109        1,342,149     1,321,170
                     17,075       21,578         18,108         15,091           13,488        11,820
                      1.93%        2.02%          2.10%          2.18%            2.27%         2.35%

                    78,773        74,061         70,627         67,548           63,997        61,458
                    12.77%        12.41%         12.18%         11.95%           11.58%        11.35%


                    15,259        13,585         11,144          9,042            8,649        10,877
                    19,971        17,018         14,224         12,593           11,188        13,825
                    38,551        34,144         27,609         21,960           20,979        27,215
                    (4,712)       (3,433)        (3,080)        (3,551)          (2,539)       (2,948)


es/1990s/ST-98-53.txt
s/1990s/ST-98-51.txt
Table?_bm=y&-context=dt&-ds_name=DEC_2000_SF1_U&-mt_name=DEC_2000_SF1_U_P015&-CONTEXT=dt&-tree_id=4001&-redoLog=
bleservices/jsf/pages/productview.xhtml?pid=DEC_10_DP_DPDP1&prodType=table

bleservices/jsf/pages/productview.xhtml?pid=DEC_10_DP_DPDP1&prodType=table

rmitsindex.html
Census
              4/1/2000       7/1/1999      7/1/1998       7/1/1997       7/1/1996       7/1/1995
                 469,315        458,828        448,341        438,406        428,552        417,783
                       3              3              3              3              3              3
                 527,825        515,640        503,455        491,461        480,700        467,348
               1,293,955      1,251,700      1,230,923      1,210,638      1,187,706      1,165,000
                  10,915         12,181         11,667         10,337         10,755         10,666
                   2.43%          2.23%          2.02%          1.86%          1.86%          2.10%

                  58,510         56,812         55,114         53,055         52,148         49,565
                  11.09%         11.02%         10.95%         10.80%         10.85%         10.61%


                  10,487         10,487          9,935          9,854         10,769         13,324
                  12,185         12,185         11,994         10,761         13,352         15,860
                  42,255         20,777         20,285         22,932         22,706         29,541
                  (1,698)        (1,698)        (2,059)          (907)        (2,583)        (2,536)


EXT=dt&-tree_id=4001&-redoLog=true&-all_geo_types=N&-geo_id=04000US16&-search_results=01000US&-format=&-_lang=en
Census
             7/1/1994       7/1/1993      7/1/1992      7/1/1991      4/1/1990      7/1/1989
                 404,459        394,339       383,250       372,246       360,718      356,564
                       3              3             3             3             3           n/a
                 451,488        437,695       426,999       420,329       413,322      410,851
               1,135,459      1,101,204     1,066,490     1,038,915     1,006,734      994,416
                  12,640         11,567         9,597         6,603         5,703         4,776
                   2.04%          1.88%         1.90%         2.18%         2.18%            n/a

                  47,029        43,356        43,749        48,083        52,604        54,287
                  10.42%         9.91%        10.25%        11.44%        12.73%        13.21%


                  10,120        11,089        11,004        11,528         4,154          5,249
                  13,793        10,696         6,670         7,007         2,471          2,149
                  34,255        34,714        27,575        32,181        12,318          8,752
                  (3,673)          393         4,334         4,521         1,683          3,100


0US&-format=&-_lang=en
7/1/1988       7/1/1987       7/1/1986       7/1/1985       7/1/1984       7/1/1983
   351,315        347,858        347,335        346,679        342,566        336,368
        n/a            n/a            n/a            n/a            n/a            n/a
   408,702        406,429        403,431        399,728        395,493        391,279
   985,664        984,997        990,224        994,051        990,839        981,869
      3,211          3,185          3,804          4,307          4,308          4,225
         n/a            n/a            n/a            n/a            n/a            n/a

    57,387         58,571         56,096         53,049         52,927         54,911
    14.04%         14.41%         13.90%         13.27%         13.38%         14.03%


      3,457            523            656          4,113          6,198          2,057
      2,273          2,998          3,703          4,235          4,214          2,863
        667         (5,227)        (3,827)         3,212          8,970          8,148
      1,184         (2,475)        (3,047)          (122)         1,984           (806)
7/1/1982       7/1/1981       4/1/1980
   334,311        331,879        324,107
        n/a            n/a            n/a
   388,416        384,230        375,200
   973,721        962,204        943,935
      2,536          3,382          5,795
         n/a            n/a            n/a

    54,105         52,351         51,093
    13.93%         13.62%         13.62%


     2,432          7,772        324,107
     4,186          9,030        375,200
    11,517         18,269            n/a
    (1,754)        (1,258)       (51,093)
Summary Data from Prior Pages

          Idaho Housing Fundamentals               2010           2000           1990
Totals
                   Population                       1,567,582   1,293,955         1,006,734
                   Households                         579,408        469,315        360,718
                 Housing Units                        667,796    527,825            413,322
Annual Change (Decade Prior)
                   Population                          27,363        28,722             6,280
                   Households                          11,009        10,860             3,661
                 Housing Units                         13,997        11,450             3,812
Annual Average (Decade Prior)
                Housing Permits                   #DIV/0!       #DIV/0!         #DIV/0!
Annual "Gap"
     Change in Housing Units vs Households              2,988             591             151
    Housing Permits vs Change in Households       #DIV/0!       #DIV/0!         #DIV/0!
Decade "Gap"
     Change in Housing Units vs Households             29,878         5,906           1,511
    Housing Permits vs Change in Households       #DIV/0!       #DIV/0!         #DIV/0!
            Source: US Census Bureau          www.census.gov
1980

  943,935
  324,107
  375,200
Red Data Input
Blue Calculated


  Idaho Homeowner Vacancy Rates
                                  2011     2010                                     2009
                                   Q1       Q4         Q3        Q2        Q1        Q4
      Homeowner Vacancy Rate       4.4      3.6       3.3       3.6       2.6        2.8
        4 qtr Moving Average      3.73     3.28       3.08      2.83      2.65      2.90

            Data Source:
                                         http://www.census.gov/hhes/www/housing/hvs/rates/index.html
2008                        2007
               Q3       Q2     Q1     Q4     Q3     Q2     Q1     Q4     Q3
              2.3      2.9    3.6     3.1   3.5    2.6    3.1     2.7   3.5
              2.98     3.28   3.20   3.08   2.98   2.98   2.95   2.83   2.58


hvs/rates/index.html
2006                        2005
 Q2     Q1     Q4     Q3     Q2     Q1     Q4     Q3     Q2
2.5    2.6     1.7   2.6    2.5    2.2     1.3   1.2    1.6
2.35   2.35   2.25   2.15   1.80   1.58   1.38   1.40   1.50
Q1
1.4
1.40
Home Owner Vacany Rate Trends
                     5.0


                     4.5


                     4.0


                     3.5


                     3.0
Percentage Vacancy


                     2.5


                     2.0


                     1.5


                     1.0


                     0.5


                     0.0
                           Q1   Q2   Q3   Q4   Q1   Q2   Q3   Q4   Q1   Q2   Q3   Q4   Q1   Q2   Q3   Q4    Q1     Q2   Q3   Q4   Q1   Q2   Q3   Q4   Q1

                                 2005                2006                2007                2008                   2009                2010          2011

                                                              Homeowner Vacancy Rate        4 qtr Moving Average
Units

                                                                         2 units
                  1-unit detached             1-unit attached
IDAHO

        2008                        72.5                        3.1                    2.9
        2007                        73.2                        2.9                    2.8
        2006                        72.3                        2.9                    2.8
        2000                        70.1                        2.9                    6.8
        1990                        69.2                        2.2                    7.1
        1980                        69.9                        2.2                    7.8


                                           Summary

                   SF Detached                  SF Atached            2-4 Unit Multi
        2008           72.5                         3.1                    7.5
        2007           73.2                         2.9                    6.9
        2006           72.3                         2.9                    7.6
        2000           70.1                         2.9                    6.8
        1990           69.2                         2.2                    7.1
        1980           69.9                         2.2                    7.8

Data Sources:
    2008      http://www.census.gov/compendia/statab/2011/tables/11s0984.pdf
   2006-07    http://www.census.gov/compendia/statab/2010/cats/construction_housing/housing_units_and_characterist
 1980-2000 http://www.census.gov/hhes/www/housing/census/historic/units.html
Units by units in structures--

                  3 or 4 units                  5 to 9 units             10 to 19 units         20 or more units

                                                 (percent)

                                  4.6                           3.0                       2.1                      2.2
                                  4.1                           2.7                       1.7                      2.6
                                  4.8                           2.6                       1.9                      2.4
                                                                7.5
                                                                7.1
                                                                8.8


                  5+ Unit Multi                   Mobile                     Other                   Total
                      7.3                           9.3                       0.2                     100
                      7.1                           9.7                       0.1                     100
                      7.0                          10.1                       (Z)                     100
                      7.5                          12.2                       0.5                     100
                      7.1                          13.7                       0.9                     100
                      8.8                          11.3                       0.0                     100


n_housing/housing_units_and_characteristics.html
Mobile homes          Boat, RV, van, etc.


                9.3                         0.2
                9.7                         0.1
               10.1                         (Z)
               12.2                         0.5
               13.7                         0.9
               11.3

Housing Overhang Summary Data

  • 1.
    The following datasheets support assessments done in June 2011 to discuss Idaho's "housing Overhang." A Powerpoint Presentation on this Website entitled " Idaho Housing Market Fundamentals" by Brian Greber is based upon this data. That presentation includes the following definitions: •A housing unit is a house, an apartment, a mobile home, a group of rooms, or a single room that is occupied (or if vacant, is intended for occupancy) as separate living quarters. Separate living quarters are those in which the occupants live and eat separately from any other persons in the building and which have direct access from the outside of the building or through a common hall. •A household includes all the persons who occupy a housing unit. A housing unit is a house, an apartment, a mobile home, a group of rooms, or a single room that is occupied (or if vacant, is intended for occupancy) as separate living quarters. Separate living quarters are those in which the occupants live and eat separately from any other persons in the building and which have direct access from the outside of the building or through a common hall. The occupants may be a single family, one person living alone, two or more families living together, or any other group of related or unrelated persons who share living arrangements. (People not living in households are classified as living in group quarters.) •Building permits represent the number of new housing units authorized by building permits in the United States. The building permits data relate to new private housing units intended for occupancy on a housekeeping basis. They exclude mobile homes (trailers), hotels, motels, and group residential structures, such as nursing homes and college dormitories. They also exclude conversions of and alterations to existing buildings. –These are typically referred to as “housing starts” •The homeowner vacancy rate is the proportion of the homeowner inventory that is vacant “for sale.” It is computed by dividing the total number of vacant units “for sale only” by the sum of owner-occupied units,vacant units that are “for sale only,” and vacant units that have been sold but not yet occupied; and then multiplying by 100. Data sources are shown with links below each table.
  • 2.
    Red Data Input BlueCalculated Census 4/1/2010 7/1/2009 7/1/2008 7/1/2007 Number of Households 579,408 571,357 563,409 551,823 Persons/Household 3 3 3 3 Number of Housing Units in Stock 667,796 647,502 642,637 631,982 Population 1,567,582 1,545,801 1,527,506 1,499,245 Annual Housing Permits/Starts 4,153 4,863 6,470 12,105 % Populalation Not in Households 1.68% 1.68% 1.77% 1.85% Housing Surplus (Units-Households) 88,388 76,145 79,228 80,159 as % 13.24% 11.76% 12.33% 12.68% Annual Change in Households 8,051 7,949 11,585 13,952 Housing Units 20,294 4,865 10,655 15,338 Population 21,781 18,295 28,261 34,832 GAP (12,243) 3,084 930 (1,386) Data Sources: HouseHolds 1980's http://www.census.gov/popest/archives/1990s/ST-98-53.txt 1990's http://www.census.gov/popest/archives/1990s/ST-98-51.txt 2000 http://factfinder.census.gov/servlet/DTTable?_bm=y&-context 2010 http://factfinder2.census.gov/faces/tableservices/jsf/pages/pr Housing Stock pre 2010 http://www.census.gov/popest/housing/ 2010 http://factfinder2.census.gov/faces/tableservices/jsf/pages/pr Population http://www.census.gov/popest/estimates.html Permits http://www.census.gov/const/www/permitsindex.html
  • 3.
    7/1/2006 7/1/2005 7/1/2004 7/1/2003 7/1/2002 7/1/2001 537,871 522,612 509,028 497,883 488,841 480,192 3 3 3 3 3 3 616,644 596,673 579,655 565,431 552,838 541,650 1,464,413 1,425,862 1,391,718 1,364,109 1,342,149 1,321,170 17,075 21,578 18,108 15,091 13,488 11,820 1.93% 2.02% 2.10% 2.18% 2.27% 2.35% 78,773 74,061 70,627 67,548 63,997 61,458 12.77% 12.41% 12.18% 11.95% 11.58% 11.35% 15,259 13,585 11,144 9,042 8,649 10,877 19,971 17,018 14,224 12,593 11,188 13,825 38,551 34,144 27,609 21,960 20,979 27,215 (4,712) (3,433) (3,080) (3,551) (2,539) (2,948) es/1990s/ST-98-53.txt s/1990s/ST-98-51.txt Table?_bm=y&-context=dt&-ds_name=DEC_2000_SF1_U&-mt_name=DEC_2000_SF1_U_P015&-CONTEXT=dt&-tree_id=4001&-redoLog= bleservices/jsf/pages/productview.xhtml?pid=DEC_10_DP_DPDP1&prodType=table bleservices/jsf/pages/productview.xhtml?pid=DEC_10_DP_DPDP1&prodType=table rmitsindex.html
  • 4.
    Census 4/1/2000 7/1/1999 7/1/1998 7/1/1997 7/1/1996 7/1/1995 469,315 458,828 448,341 438,406 428,552 417,783 3 3 3 3 3 3 527,825 515,640 503,455 491,461 480,700 467,348 1,293,955 1,251,700 1,230,923 1,210,638 1,187,706 1,165,000 10,915 12,181 11,667 10,337 10,755 10,666 2.43% 2.23% 2.02% 1.86% 1.86% 2.10% 58,510 56,812 55,114 53,055 52,148 49,565 11.09% 11.02% 10.95% 10.80% 10.85% 10.61% 10,487 10,487 9,935 9,854 10,769 13,324 12,185 12,185 11,994 10,761 13,352 15,860 42,255 20,777 20,285 22,932 22,706 29,541 (1,698) (1,698) (2,059) (907) (2,583) (2,536) EXT=dt&-tree_id=4001&-redoLog=true&-all_geo_types=N&-geo_id=04000US16&-search_results=01000US&-format=&-_lang=en
  • 5.
    Census 7/1/1994 7/1/1993 7/1/1992 7/1/1991 4/1/1990 7/1/1989 404,459 394,339 383,250 372,246 360,718 356,564 3 3 3 3 3 n/a 451,488 437,695 426,999 420,329 413,322 410,851 1,135,459 1,101,204 1,066,490 1,038,915 1,006,734 994,416 12,640 11,567 9,597 6,603 5,703 4,776 2.04% 1.88% 1.90% 2.18% 2.18% n/a 47,029 43,356 43,749 48,083 52,604 54,287 10.42% 9.91% 10.25% 11.44% 12.73% 13.21% 10,120 11,089 11,004 11,528 4,154 5,249 13,793 10,696 6,670 7,007 2,471 2,149 34,255 34,714 27,575 32,181 12,318 8,752 (3,673) 393 4,334 4,521 1,683 3,100 0US&-format=&-_lang=en
  • 6.
    7/1/1988 7/1/1987 7/1/1986 7/1/1985 7/1/1984 7/1/1983 351,315 347,858 347,335 346,679 342,566 336,368 n/a n/a n/a n/a n/a n/a 408,702 406,429 403,431 399,728 395,493 391,279 985,664 984,997 990,224 994,051 990,839 981,869 3,211 3,185 3,804 4,307 4,308 4,225 n/a n/a n/a n/a n/a n/a 57,387 58,571 56,096 53,049 52,927 54,911 14.04% 14.41% 13.90% 13.27% 13.38% 14.03% 3,457 523 656 4,113 6,198 2,057 2,273 2,998 3,703 4,235 4,214 2,863 667 (5,227) (3,827) 3,212 8,970 8,148 1,184 (2,475) (3,047) (122) 1,984 (806)
  • 7.
    7/1/1982 7/1/1981 4/1/1980 334,311 331,879 324,107 n/a n/a n/a 388,416 384,230 375,200 973,721 962,204 943,935 2,536 3,382 5,795 n/a n/a n/a 54,105 52,351 51,093 13.93% 13.62% 13.62% 2,432 7,772 324,107 4,186 9,030 375,200 11,517 18,269 n/a (1,754) (1,258) (51,093)
  • 8.
    Summary Data fromPrior Pages Idaho Housing Fundamentals 2010 2000 1990 Totals Population 1,567,582 1,293,955 1,006,734 Households 579,408 469,315 360,718 Housing Units 667,796 527,825 413,322 Annual Change (Decade Prior) Population 27,363 28,722 6,280 Households 11,009 10,860 3,661 Housing Units 13,997 11,450 3,812 Annual Average (Decade Prior) Housing Permits #DIV/0! #DIV/0! #DIV/0! Annual "Gap" Change in Housing Units vs Households 2,988 591 151 Housing Permits vs Change in Households #DIV/0! #DIV/0! #DIV/0! Decade "Gap" Change in Housing Units vs Households 29,878 5,906 1,511 Housing Permits vs Change in Households #DIV/0! #DIV/0! #DIV/0! Source: US Census Bureau www.census.gov
  • 9.
    1980 943,935 324,107 375,200
  • 10.
    Red Data Input BlueCalculated Idaho Homeowner Vacancy Rates 2011 2010 2009 Q1 Q4 Q3 Q2 Q1 Q4 Homeowner Vacancy Rate 4.4 3.6 3.3 3.6 2.6 2.8 4 qtr Moving Average 3.73 3.28 3.08 2.83 2.65 2.90 Data Source: http://www.census.gov/hhes/www/housing/hvs/rates/index.html
  • 11.
    2008 2007 Q3 Q2 Q1 Q4 Q3 Q2 Q1 Q4 Q3 2.3 2.9 3.6 3.1 3.5 2.6 3.1 2.7 3.5 2.98 3.28 3.20 3.08 2.98 2.98 2.95 2.83 2.58 hvs/rates/index.html
  • 12.
    2006 2005 Q2 Q1 Q4 Q3 Q2 Q1 Q4 Q3 Q2 2.5 2.6 1.7 2.6 2.5 2.2 1.3 1.2 1.6 2.35 2.35 2.25 2.15 1.80 1.58 1.38 1.40 1.50
  • 13.
  • 14.
    Home Owner VacanyRate Trends 5.0 4.5 4.0 3.5 3.0 Percentage Vacancy 2.5 2.0 1.5 1.0 0.5 0.0 Q1 Q2 Q3 Q4 Q1 Q2 Q3 Q4 Q1 Q2 Q3 Q4 Q1 Q2 Q3 Q4 Q1 Q2 Q3 Q4 Q1 Q2 Q3 Q4 Q1 2005 2006 2007 2008 2009 2010 2011 Homeowner Vacancy Rate 4 qtr Moving Average
  • 15.
    Units 2 units 1-unit detached 1-unit attached IDAHO 2008 72.5 3.1 2.9 2007 73.2 2.9 2.8 2006 72.3 2.9 2.8 2000 70.1 2.9 6.8 1990 69.2 2.2 7.1 1980 69.9 2.2 7.8 Summary SF Detached SF Atached 2-4 Unit Multi 2008 72.5 3.1 7.5 2007 73.2 2.9 6.9 2006 72.3 2.9 7.6 2000 70.1 2.9 6.8 1990 69.2 2.2 7.1 1980 69.9 2.2 7.8 Data Sources: 2008 http://www.census.gov/compendia/statab/2011/tables/11s0984.pdf 2006-07 http://www.census.gov/compendia/statab/2010/cats/construction_housing/housing_units_and_characterist 1980-2000 http://www.census.gov/hhes/www/housing/census/historic/units.html
  • 16.
    Units by unitsin structures-- 3 or 4 units 5 to 9 units 10 to 19 units 20 or more units (percent) 4.6 3.0 2.1 2.2 4.1 2.7 1.7 2.6 4.8 2.6 1.9 2.4 7.5 7.1 8.8 5+ Unit Multi Mobile Other Total 7.3 9.3 0.2 100 7.1 9.7 0.1 100 7.0 10.1 (Z) 100 7.5 12.2 0.5 100 7.1 13.7 0.9 100 8.8 11.3 0.0 100 n_housing/housing_units_and_characteristics.html
  • 17.
    Mobile homes Boat, RV, van, etc. 9.3 0.2 9.7 0.1 10.1 (Z) 12.2 0.5 13.7 0.9 11.3